A Walk in the Park? Examining the Impact of App-Based Weather Warnings on Affective Reactions and the Search for Information in a Virtual City - MDPI
←
→
Page content transcription
If your browser does not render page correctly, please read the page content below
International Journal of
               Environmental Research
               and Public Health

Article
A Walk in the Park? Examining the Impact of App-Based
Weather Warnings on Affective Reactions and the Search for
Information in a Virtual City
Samuel Tomczyk *,† , Maxi Rahn † , Henriette Markwart and Silke Schmidt

                                          Department Health and Prevention, Institute of Psychology, University of Greifswald, Robert-Blum-Straße 13,
                                          17489 Greifswald, Germany; maxi.rahn@uni-greifswald.de (M.R.); henriette.markwart@uni-greifswald.de (H.M.);
                                          silke.schmidt@uni-greifswald.de (S.S.)
                                          * Correspondence: samuel.tomczyk@uni-greifswald.de
                                          † These authors contributed equally.

                                          Abstract: Background: Warning apps can provide personalized public warnings, but research on
                                          their appraisal and impact on compliance is scarce. This study introduces a virtual city framework
                                          to examine affective reactions when receiving an app-based warning, and subsequent behavioral
                                          intentions. Methods: In an online experiment, 276 participants (M = 41.07, SD = 16.44, 62.0% female)
                                          were randomly allocated to one of eight groups (warning vs. no warning, thunderstorm vs. no
                                          thunderstorm, video vs. vignette). Participants were guided through a virtual city by a mock-up
                                          touristic app (t1). Then, the app issued a warning about an impending thunderstorm (t2), followed by
                                          a virtual thunderstorm (t3). The virtual city tour was presented via vignettes or videos. ANCOVAs

                                   were used to investigate trajectories of momentary anxiety, hierarchical regressions analyzed the
                                          impact of momentary anxiety on information seeking. Results: Participants who received a warning
Citation: Tomczyk, S.; Rahn, M.;
Markwart, H.; Schmidt, S. A Walk in
                                          message and were confronted with a thunderstorm showed the highest increase in momentary
the Park? Examining the Impact of         anxiety, which predicted information seeking intentions. Conclusions: The findings underscore the
App-Based Weather Warnings on             importance of affective appraisal in processing warning messages. The virtual city framework is
Affective Reactions and the Search for    able to differentiate the impact of warning versus event in an online context, and thus promising for
Information in a Virtual City. Int. J.    future warning research in virtual settings.
Environ. Res. Public Health 2021, 18,
8353. https://doi.org/10.3390/            Keywords: emergency alert; public warning systems; affect heuristic; weather; disaster; online experiment
ijerph18168353

Academic Editor: Paul B. Tchounwou

                                          1. Introduction
Received: 29 June 2021
Accepted: 30 July 2021
                                               Severe weather comes in a variety of forms, such as droughts, floods, or thunder-
Published: 6 August 2021
                                          storms, each of which may have massive societal and meteorological impact [1]. The
                                          World Meteorological Organization has developed a definition of severe weather that
Publisher’s Note: MDPI stays neutral
                                          acknowledges regional differences in types of (e.g., sand/snow storms, flash floods) as well
with regard to jurisdictional claims in
                                          as thresholds for severe weather events (e.g., intensity of wind or rain) but characterizes
published maps and institutional affil-   severe weather as “an extreme meteorological event or phenomenon, which represents a real
iations.                                  hazard (to human life and property)” ([2], p. 2). Although severe weather is less intense and
                                          occurs less frequently in the European region than in other parts of the world, it still poses
                                          an increasing threat in Europe [3,4]: for instance, thunderstorms, or so-called convective
                                          storms, can arise with heavy winds or even tornadoes, rainfall, hail, and lightning [5–9].
Copyright: © 2021 by the authors.
                                               By alerting and providing information to populations that are potentially affected by
Licensee MDPI, Basel, Switzerland.
                                          thunderstorms and other large-scale weather events, warning messages are an effective
This article is an open access article
                                          means of preventing various forms of damage, including loss of life and property [9,10]. A
distributed under the terms and           large body of literature informs the construction of effective warning messages from an
conditions of the Creative Commons        interdisciplinary perspective [10,11]. For example, studies on weather warnings indicate
Attribution (CC BY) license (https://     that warning messages emphasizing potential consequences and providing guidance for
creativecommons.org/licenses/by/          protective measures are perceived as more threatening and are more likely to be followed
4.0/).                                    than those, which describe the event alone [12,13].

Int. J. Environ. Res. Public Health 2021, 18, 8353. https://doi.org/10.3390/ijerph18168353                   https://www.mdpi.com/journal/ijerph
Int. J. Environ. Res. Public Health 2021, 18, 8353 2 of 17
Traditionally, TV and radio news broadcast weather reports and weather warnings,
but in recent years, new channels have been utilized to communicate warning messages.
Mobile warning apps, such as FEMA in the U.S., or NINA and KATWARN in Germany,
are able to promptly alert a broad range of the population regarding hazards and threats
while simultaneously providing them with information on protective measures [14–16].
While some apps inform about a range of hazards (e.g., FEMA and KATWARN), others
specifically focus on weather forecasting and severe weather (e.g., WarnWetter, a weather
app), with the latter being highly popular [17,18]. A survey conducted among university
students found that around 80% used weather warning apps at least once per day to
get forecasts, thus indicating high use rates compared to traditional media, such as local
television (6.8%) [19]. Yet, information processing of app-based warning messages has
not been conclusively investigated, for instance, a range of new requirements needs to
be considered (e.g., brevity of the warning message or format of the warning). As they
play a seminal role in the future of civil protection regarding environmental hazards, it is
important to comprehensively understand how mobile warning messages are processed
by recipients.
Sutton and Kuligowski [20] provide an overview of existing short messaging channels
used to communicate warning messages and they outline a theoretical background referring
to an adaption of the Protective Action Decision Model (PADM) [21,22]. The PADM
describes information processing and human responses towards hazards and threats
through several stages, such as pre-decisional processes and core perceptions, followed by
decision-making processes. Social or environmental cues, as well as information provided
by warning messages, and a recipient’s characteristics, can elicit pre-decisional processes,
which consist of the reception, attention, and comprehension of said cues or information.
Consequently, an estimation of credibility and personal threat or risk can take place. If a cue
is perceived as credible and one’s own risk is perceived as high (including cognitive and
affective appraisal of the threat), the individual will seek protective actions and implement
them. This makes risk appraisal an important factor in the warning process.
1.1. Risk Appraisal and Warning Compliance
However, several studies revealed complex relationships between risk appraisal and
behavior, in that perceived risk is not necessarily accompanied by the implementation
of protective measures [23–25]. One reason for this could be the varying—and partly
one-sided–cognitive operationalization of risk appraisal [26,27]. Beyond cognitive risk
appraisal, research from the field of health behavior [28] and on different hazards and
warnings [29–32] showed that affective responses are as important when examining hazard-
related information processing and compliance. The Protection Motivation Theory [33]
and the Extended Parallel Process Model [34], for example, formalize this distinction in
the context of fear appeals. They discern threat appraisals and efficacy appraisals as key
determinants of compliance, with negative affective reactions (e.g., fear) leading to higher
threat appraisal (i.e., affective risk appraisal), and positive evaluations of personal coping
capabilities (e.g., self-efficacy) leading to more positive efficacy beliefs. Taken together, high
threat perceptions and high efficacy beliefs predict behavioral compliance with a warning
message. Conversely, a study on home fires showed that positive affective associations with
wood heating (i.e., lower affective risk appraisal) attenuated the effects of cognitive risk
appraisal on using alternative heating systems, thus weakening the association between
risk perceptions and behavior [35].
Another theoretical model considering such affective reactions towards threats is the
affect heuristic, which differentiates between an analytic and an experiential system when
it comes to information processing [36–38]. The analytical system describes a slower way
of processing information, which is activated when there is enough time to weigh all the
facts and information about the situation. In contrast, the experiential system is driven by
affective reactions and emotions towards the hazard. It is activated when there is an acute
threat, so that judgments and decisions have to be made fast or under time pressure. In thisInt. J. Environ. Res. Public Health 2021, 18, 8353 3 of 17
sense, warning messages represent acute threats, as they point to imminent danger. This
perspective aligns with neurobiological assumptions based on the BIS/BAS Model [39–42],
which postulates two motivational systems—the BIS (behavioral inhibition) and the BAS
(behavioral approach)—that influence affect and behavior. While BAS is activated by
cues of reward and may enhance approach tendencies, BIS is sensitive towards cues of
punishment and threat, and therefore often associated with avoidance tendencies. When
confronted with an unknown or threatening cue—for example after receiving a warning
message for a thunderstorm or perceiving other thunderstorm-related stimuli, such as
dark clouds or growling thunder–activation of the BIS can increase attention towards the
cue and enhance arousal and negative emotions such as anxiety. This in turn can lead
to the inhibition or reduction of current behaviors, eventually followed by avoidance
behavior. With the BIS activated, a person may interrupt their current activity, collect more
information about the impending threat, and implement protective measures.
To date, applied warning research has produced ample evidence for these assump-
tions: For instance, a study on pop-up messages showed that negative affect impacts
the perception and processing of relatively trivial threats (e.g., outdated software while
surfing the internet) [43]. Meta-analyses and studies of warning messages on tobacco
products highlighted the advantages of pictorial warnings over text-based warnings by
evoking more negative emotional responses (e.g., fear, sadness, or disgust), as well as
higher intentions not to start or to quit smoking. Thus, it appears that warnings on tobacco
products influence behavioral intentions by increasing negative affect [44–46]. Similar
affective response patterns also seem to play a role in weather-related hazards. For ex-
ample, exposure-based research in a clinical sample found that the (virtual) exposure to a
threatening stimulus can elicit affective, mainly fear-related reactions [47–49]. These effects
are applied in exposure-based cognitive behavioral therapies for storm-related phobias [50].
Previous research on other hazards like earthquakes [51], fires [52], and floods [53] has also
used virtual reality to create a realistic scenario that can induce negative affect when con-
fronted with an event. This allows researchers to study and modify subsequent affective,
cognitive, and behavioral reactions.
Consequently, eliciting negative affect could also be a key factor of weather warning
compliance in that increased fear will lead to increased compliance intentions or behav-
iors [30,31,54]. Nevertheless, receiving warning messages can also lead to a reduction in
negative affect [29]. A meta-analytic study of fear appeal theory offers a potential explana-
tion for this countervailing trend, namely an interaction between threat and efficacy [55].
The receipt of a warning message could increase salience of a threat, thereby evoking
negative affect. But simultaneously communicating effective protective measures against
the threat could lead to increased efficacy, which, in turn, might reduce negative affect.
1.2. Research Questions and Hypothesis
Despite recommendations to investigate mobile warning messages under conditions
that are as realistic as possible [11,56], few studies have investigated said processes under
real-life conditions [30] or in experimental settings [57] that dissect the warning process (i.e.,
perceiving, processing, and complying with app-based warnings). Therefore, the intuitive
affective processing of weather warnings poses unanswered questions. To close this gap,
the present study introduces the virtual city framework and aims to examine affective
processing of a thunderstorm warning message via an experimental, repeated measures
design. This virtual city framework is embedded in a browser-based online survey plat-
form [58] that provides easy access and ensures functionality across different browsers and
devices. While this increases the reach and applicability of the virtual city framework, it
also means lower realism than more complex and immersive virtual environments, such
as virtual reality [59] that require additional equiment. In virtual reality, users can create
photorealistic representations of real buildings and topographic structures, e.g., [60,61] that
can increase immersive effects and perceived realism of the virtual environment. Virtual
reality is already widely implemented in (geo-)spatial sciences [60] and construction [62]Int. J. Environ. Res. Public Health 2021, 18, 8353 4 of 17
and it also holds promise for sociobehavioral spatial research, for instance, in evaluating
warning compliance under realistic conditions (e.g., [63,64]).
Highly immersive environments can lead to stronger emotional (e.g., negative affec-
tive appraisal) and cognitive reactions (e.g., perceived severity, self-efficacy) [65,66] and
the evoked reactions might be closer to their real-life equivalent than in low immersive
environments. So far, however, findings regarding the ecological validity of these methods
(e.g., the congruency between virtual and real behavior) are mixed (e.g., [67–70]). Hence,
more research is needed to examine biopsychosocial processes underlying decision-making
in these situations to explore facilitators and barriers to compliance and implementing
adaptive behavior when confronted with warnings or hazards.
Therefore, in this experiment, we choose a simpler, less immersive approach where
warning message and thunderstorm are presented in two different formats, namely in
videos or vignettes. Videos can elicit stronger negative affective appraisals than vignettes,
have a higher criterion validity, and they are connected to stronger stimulation of cogni-
tive learning processes [71–74]. Presumably, videos are able to present a more accurate
depiction of contextual cues that increase the perceived realism of a scenario and thus
increases external validity [72,74]. Due to their efficiency and high internal validity, how-
ever, experimental vignette studies are still popular in applied warning research [29,75,76].
Therefore, both formats will be compared in the current study: Participants will receive a
thunderstorm warning message via a mobile app during a virtual city tour, followed by an
exposure (vs. non-exposure) to a thunderstorm. Based on previous research, we propose
the following hypotheses:
Hypothesis 1 (H1). The receipt of a warning message regarding a thunderstorm will lead to an
increase in momentary anxiety.
Hypothesis 2 (H2). The exposure to a thunderstorm will lead to an increase in momentary anxiety.
Hypothesis 3 (H3). Presentation format will influence momentary anxiety, in that video footage
will lead to greater momentary anxiety than vignettes.
To enhance the relevance of our research, the present study will additionally focus
on the recipient’s search for information in association with momentary anxiety. The
search for further information can be part of every stage of the PADM, for example, by
inquiring about effective protective measures or suitable locations to seek shelter [20].
Also, individuals who have received a warning message often try to verify and confirm
it by seeking out other sources [77]. Such behaviors are connected to negative affect and
might be associated with risk and coping appraisals or uncertainty, for instance, regarding
message content or behavioral recommendations [78]. Thus, searching for information
following a warning message may reduce negative affect by leading to more positive
coping appraisals or reducing perceived threat and uncertainty [29,78,79], but it could also
be a sign of milling. Milling refers to information seeking behavior following a warning, for
example, by searching on other channels and exchanging information with others, which
leads to a time delay and further protective measures not being initiated immediately [80].
Hence, information seeking depicts a protective behavior that cannot in itself be labeled as
an adaptive or maladaptive response to a warning message, but we can assume that it is
predicted by negative affect. Therefore, we will examine the following hypotheses:
Hypothesis 4 (H4). Higher momentary anxiety will lead to an increased search for further information.
Hypothesis 5 (H5). In participants who were confronted with a thunderstorm, the receipt of a
warning message, and the presentation format will interact with momentary anxiety, which will
lead to an increased search for further information.Int. J. Environ. Res. Public Health 2021, 18, 8353 5 of 17
Finally, as already outlined in the PADM, individual characteristics can impact the
processing of weather warning messages. Prior experience with severe weather as well as
experienced personal harm impact subsequent appraisal of risk and the implementation of
preparedness behavior [81–86]. Sociodemographic variables, such as age or gender, play a
role in risk appraisal in connection with weather warnings and protective measures: female
gender and higher age are factors that are associated with higher compliance [12,87,88].
Therefore, age, gender, previous experience with thunderstorms, and storm fear are in-
cluded as covariates. We will also include current the usage of warning apps as a covariate.
2. Materials and Methods
2.1. Sample
Data collection took place from February to June 2020. A German adult sample was
recruited via various online services (e.g., internet forum posts via Facebook, and platforms
for psychological online surveys). Participants were invited to participate in an online
study evaluating a novel app as a cover story (see 2.4). Participants were included if they
were at least 18 years of age and fluent in German. As an incentive, participants entered a
raffle for six gift vouchers (15 Euros).
2.2. Materials
The videos used in this study took the viewer on a virtual city tour to Berlin. The
virtual scenery was created with the game engine Unity (Unity 5.4.3f1 (64-bit), Unity
Technologies, San Francisco, USA, https://unity.com/ (accessed on: 2 August 2021))). For
the generation of the videos, Open Broadcaster Software (OBS Studio Version 25.0.8 (64-bit),
Hugh Bailey, https://obsproject.com/ (accessed on: 2 August 2021))) and OpenShot
Video Editor (OpenShot 2.4.4, Jonathan Thomas, https://www.openshot.org/ (accessed on:
2 August 2021)) were used. Vignettes consisted of screenshots of the videos and written
descriptions. Videos and vignettes used in this study can be found in the Supplementary
Materials online (File S1 (vignettes) and File S2 (videos)). In both files, videos and vignettes
are labelled according to their position in the experiment (1 baseline, 2 warning, 3 no
warning, 4 thunderstorm, 5 no thunderstorm).
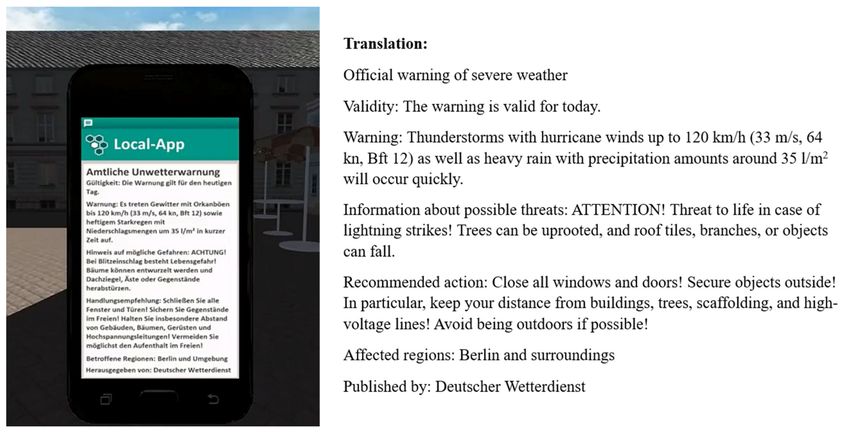
In this study, a thunderstorm warning message was sent via a simulated mobile phone
app. The message was issued by the Deutscher Wetterdienst (DWD). The DWD operates
as the German National Meteorological Service and is in charge of the forecast as well
as the warning of weather hazards [17]. The warning message contained a description
of a pending thunderstorm, possible impact, recommended protective actions, and the
affected region. The message was adapted from previously issued severe weather warnings,
optimized for mobile warning systems based on current recommendations [20,54,89]. The
thresholds for severe weather were based on DWD criteria for warnings of severe weather
(so-called Level 3 events) [90]. The original message (in German) and its English translation
can be found in Figure 1. The full text is also available upon request from the first author.
2.3. Measures
Momentary anxiety was assessed with one item (“How anxious do you feel at the
moment?”) at three time points. A 5-point Likert scale was used, ranging from 1 (not at all)
to 5 (extremely). The search for further information was assessed using one item (“How
likely is it that you would search for more information about this situation?”). Again, a
5-point Likert scale was used, ranging from 1 (not at all) to 5 (very likely).
Seven items were used to measure previous thunderstorm experience with 7-point
Likert scales (1 (never) to 7 (very often)). For example, participants were asked whether they
or their friends and family had already experienced a thunderstorm, or whether they were
in danger during a thunderstorm. To measure storm fear, the Storm Fear Questionnaire
(SFQ) [47] was used. The SFQ consists of 15 items that address weather- and storm-related
phobia in adults. Current warning app use was assessed via one item (“Do you currentlyInt. J. Environ. Res. Public Health 2021, 18, 8353 6 of 17
use one or more apps to be warned of weather events?”); a ‘yes’ indicated current app use.
Gender (1 = male, 2 = female) and age (in years) were assessed using single items.
Figure 1. Warning message used at second point of measurement (t2; in German), and English translation of the warning message.
2.4. Study Design and Study Procedure
Participants were invited via Facebook posts, and online survey platforms (e.g., Psy-
chology Today https://www.psychologie-heute.de/aktuelles/studienteilnahme.html (ac-
cessed on: 2 August 2021)) to test and rate a touristic app that aims to provide multifaceted
information about location, sights, traffic, and weather. A hyperlink directed participants
to the experiment, which was implemented via SoSci Survey, Version 3.2.33 [58] and took
about 30 minutes to complete. Participants were welcomed to the study and received
information about the study background and how their data would be collected and used.
After they gave their informed consent, participants first reported sociodemographic data
(e.g., age and gender). Then, they received a cover story asking them to take part in the
evaluation of a new touristic city app called “Local App” during a virtual city tour.
Data collection took place using a quasi-experimental 2 × 2 × 2 factorial design. The
study procedure can be found in Figure 2. Due to randomization, a subset of participants
received all further footage of the virtual city either via videos or vignettes (video/vignette).
Following randomization by random draw, momentary anxiety was assessed for the
first time (t1). Then, one group received a thunderstorm warning message while the
other group received neutral information about the city (warning message/no warning
message), followed by the second assessment of momentary anxiety (t2). Finally, either
a thunderstorm or neutral information was presented (thunderstorm/no thunderstorm),
and momentary anxiety was assessed for the last time point (t3).
Lastly, prior thunderstorm experience, storm fear, and current use of warning apps
were assessed in a questionnaire. Upon completion, all participants were given informa-
tion for psychosocial support services if they needed assistance due to the exposure to
a thunderstorm. The required sample size for this study was estimated a priori using
G × Power [91], based on an anticipated power of β = 0.80, an alpha error value of α = 0.05,
a medium effect size of f = 0.25, eight groups, and three repeated measurements with an
estimated non-correlation between repeated measures (due to experimental manipulation).
An ANOVA with repeated measures, and within-between interactions was chosen as the
statistical analysis, resulting in a required sample size of n = 104.Int. J. Environ. Res. Public Health 2021, 18, 8353 7 of 17
Figure 2. Study procedure: Participants were randomized into eight groups according to presentation format (video vs.
vignette), warning receipt (no warning vs. warning), and thunderstorm exposure (no thunderstorm vs. thunderstorm).
Momentary anxiety was assessed at three time points: t1 (beginning of the cover story), t2 (warning message receipt vs. no
receipt), t3 (thunderstorm exposure vs. no exposure).
2.5. Statistical Analysis
All analyses were performed using IBM SPSS Statistics for Windows, Version 27.0 (IBM
Corp., Armonk, NY, USA) and PROCESS macro, Version 3.0 (https://onlinelibrary.wiley.
com/doi/abs/10.1111/jedm.12050 (accessed on: 2 August 2021)). Means and standard
deviations were calculated for the SFQ and prior thunderstorm experience. Chi-square
tests and t tests were performed to analyze differences between experimental conditions.
Pearson correlations were performed to investigate links between the examined constructs.
To answer Hypotheses 1 to 3, a repeated measures ANOVA as well as ANCOVA were
conducted with time (i.e., momentary anxiety at three time points) as a within-person factor
and warning, thunderstorm, and format (video/vignette) as a between-person factors.
As a measure of effect size, partial eta squared (η p 2 ) was reported. To correct violations
of sphericity, Greenhouse-Geisser adjustment was applied. To answer Hypotheses 4 and
5, a moderation analysis was conducted via multiple linear regression. For the repeated
measure ANCOVA and moderation analysis, age, gender, prior thunderstorm experience,
storm fear, and app use were included as covariates. The moderation analysis was per-
formed in the subsample of participants who were confronted with a thunderstorm during
the experiment (n = 209).
3. Results
3.1. Descriptive Statistics
A total of 276 participants completed the survey. Missing values on item level ranged
from 0.0% (e.g., momentary anxiety at t1) to 5.4% (app use). Most participants had no or
one missing value (89.3%), followed by multiple missing values in previous experience of
thunderstorms (3.7%), and storm fear (3.7%). Complete cases analysis was performed.
The sample included 62.0% females (n = 171) and 34.1% males (n = 94), with no information
received from 4.0% (n = 11). Participants’ age ranged from 17 to 83 years (M = 41.07, SD = 16.44).
Mean score of previous thunderstorm experience was 2.90 (SD = 0.71, Range = 1.00–6.43) and
mean score of storm fear was 1.50 (SD = 0.54, Range = 1–5). About 31.2% (n = 86) of participants
reported current use of a mobile warning app for weather events.Int. J. Environ. Res. Public Health 2021, 18, 8353 8 of 17
According to the randomization, 141 (48.9%) participants received a warning message,
209 (75.7%) participants were confronted with a thunderstorm, and 146 (52.9%) received
their information as videos. The thunderstorm condition was oversampled to account for
potential dropout due to technical difficulties in playing the videos that were reported
in a pilot test of the experiment. The sample size for each group (n = 12–56) as well as
descriptive statistics for each group can be found in Appendix A (Table A1). The eight
groups did not differ by age, gender, previous thunderstorm experience, storm fear, and
app use, pointing to a successful randomization procedure. The only difference was
observed for format and gender (χ2 (1) = 8.15, p < 0.01), in that more female participants
received information via vignettes.
Bivariate correlations of study variables can be found in Table 1. Significant pos-
itive correlations were found for momentary anxiety (t1–t3) and the search for further
information (t3) (r = 0.13–0.31, p < 0.05–0.001). In the warning message group, significant
positive associations were found for momentary anxiety at t2 (r = 0.34, p < 0.001) and t3
(r = 0.14, p < 0.05), while exposure to a virtual thunderstormwas positively correlated with
momentary anxiety at t3 (r = 0.34, p < 0.001). Thus, receiving a warning message and
being exposed to a thunderstorm were associated with higher anxiety ratings. Negative
correlations were observed for presentation format and momentary anxiety at t2 (r = −0.12,
p < 0.05) and t3 (r = −0.14, p < 0.05), meaning that vignettes caused less momentary anxiety
than videos.
3.2. Trajectory of Momentary Anxiety
The following section presents the results of the ANCOVA regarding momentary
anxiety (H1 to H3), and the regression of information seeking intentions on momentary
anxiety (H4 and H5). A repeated measures ANOVA without covariates showed three
significant effects: a main effect of time, indicating an increase in momentary anxiety over
time (F(1.81, 482.64) = 34.148, p < 0.001, η p 2 = 0.113), an interaction of time x warning
(F(1.81, 482.64) = 8.19, p < 0.05, η p 2 = 0.03), and an interaction of time x thunderstorm
(F(1.82, 482.64) = 27.64, p < 0.001, η p 2 = 0.09), with participants receiving a warning or being
exposed to a thunderstorm reporting higher anxiety scores. The remaining effects did not
reach statistical significance.
H1. The receipt of a warning message regarding a thunderstorm will lead to an increase in
momentary anxiety.
Repeated measure ANCOVA revealed a significant interaction of time and receiving a
warning message (F(1.82, 412.01) = 7.84, p < 0.01, η p 2 = 0.03). Participants who received a
warning message regarding a thunderstorm reported higher momentary anxiety compared
to participants who received no warning.
H2. The exposure to a thunderstorm will lead to an increase in momentary anxiety.
A significant interaction was found for time and exposure to a thunderstorm (F(1.82,
412.01) = 21.70, p < 0.001, η p 2 = 0.09), in that participants who were confronted reported
higher momentary anxiety. Trajectories of momentary anxiety divided for warning receipt
and thunderstorm exposure can be found in Figure 3.Int. J. Environ. Res. Public Health 2021, 18, 8353 9 of 17
Table 1. Pairwise (Pearson) correlations of momentary anxiety (t1–t3), search for further information, warning message receipt, thunderstorm confrontation, and presentation fomat,
including covariates (age, gender, thunderstorm experience, storm fear, app use), n = 250–276.
1 2 3 4 5 6 7 8 9 10 11 12
1 momentary anxiety t1 1
2 momentary anxiety t2 0.49 *** 1
3 momentary anxiety t3 0.39 *** 0.53 *** 1
search for further
4 0.13 * 0.25 *** 0.31 *** 1
information
5 warning message receipt 0.02 0.34 *** 0.14 * 0.10 1
6 thunderstorm exposure 0.10 0.02 0.34 *** 0.18 ** 0.00 1
7 format −0.01 −0.12 * −0.14 * 0.03 −0.01 −0.06 1
8 age −0.12 * −0.09 0.02 0.08 −0.05 0.13 * 0.02 1
9 gender 0.07 0.11 0.14 * 0.12 * 0.02 0.05 −0.18 ** −0.18 ** 1
10 thunderstorm experience 0.11 0.01 −0.02 0.08 0.02 −0.03 −0.07 0.08 −0.04 1
11 storm fear 0.20 ** 0.23 *** 0.19 ** 0.12 * 0.01 −0.02 −0.01 −0.02 0.01 0.23 *** 1
12 app use −0.10 −0.12 * −0.05 0.02 0.11 0.09 0.01 0.21 ** −0.09 0.15 * 0.18 ** 1
Note. t1–t3: Points of measurement: t1 (beginning of the cover story), t2 (warning message receipt vs. no receipt), t3 (thunderstorm exposure vs. no exposure). Momentary anxiety was assessed using a 5-point
Likert scale, ranging from 1 (not at all) to 5 (extremely). Warning message receipt (0 = no warning. 1 = warning); thunderstorm exposure (0 = no exposure. 1 = exposure); presentation format (1 = vignette.
2 = film); gender (0 = male, 1 = female); app use (0 = no current use. 1 = current use). * p < 0.05. ** p < 0.01. *** p < 0.001.Int. J. Environ. Res. Public Health 2021, 18, 8353 10 of 17
Figure 3. Mean values of momentary anxiety over the course of the study. Note. The lines represent
four groups (warning/no warning x thunderstorm/no thunderstorm); presentation format was not
included as an additional factor due to a lack of statistical significance in the ANOVA and ANCOVA.
Points of measurement: t1 (beginning of the cover story), t2 (warning message receipt vs. no receipt),
t3 (thunderstorm exposure vs. no exposure). Momentary anxiety was assessed using a 5-point Likert
scale, ranging from 1 (not at all) to 5 (extremely). Error bars show the 95% confidence interval.
H3. Presentation format will influence momentary anxiety, in that video footage will cause more
momentary anxiety than vignettes.
No significant interaction was found for time and presentation format (F(1.82, 412.01)
= 0.59, p = 0.54, η p 2 = 0.00).
3.3. Association between Momentary Anxiety and Information Seeking
Hypotheses 4 and 5 examined the association between momentary anxiety (t3) and
information seeking intentions via hierarchical regression models.
H4. Higher momentary anxiety will lead to an increased search for further information.
Multiple regression analysis for participants who were confronted with a thunder-
storm revealed a significant overall model (F(10.00, 171.00) = 2.83, p < 0.01, R2 = 0.12).
Momentary anxiety (t3) predicted the search for further information (b = 0.30, p < 0.001,
95% CI = 0.14–0.47), while the other effects were non-significant.
H5. In participants who were exposed to a thunderstorm, the receipt of a warning message, and the
presentation format will interact with momentary anxiety, which will lead to an increased search for
further information.
The receipt of a warning message (b = 0.25, p = 0.10, 95% CI = −0.05–0.56, ∆R2 = 0.01,
F(1.00, 171.00) = 2.66) and presentation format (b = −0.07, p = 0.65, 95% CI = −0.38–0.24,
∆R2 = 0.00, F(1.00, 171.00) = 0.20) did not significantly moderate the effect between mo-
mentary anxiety (t3) and search for further information.
Regarding the examined covariates, a significant interaction was found for momentary
anxiety and age in the ANCOVA (F(1.82, 412.01) = 3.20, p < 0.05, η p 2 = 0.01). Higher age
was associated with less momentary anxiety at the first point of measurement (t1). For the
remaining covariates, no significant interactions were found.Int. J. Environ. Res. Public Health 2021, 18, 8353 11 of 17
4. Discussion
The present study investigated changes of momentary anxiety and intention to seek
further information following the receipt of an app-based thunderstorm warning message,
and the exposure to a thunderstorm in a virtual city. Results showed that receiving a warn-
ing message and being confronted with a virtual thunderstorm both significantly increased
momentary anxiety compared to control conditions, which in turn predicted intentions to
seek further information. However, neither format (video or vignette) nor the interaction
between warning and thunderstorm had a significant impact on momentary anxiety.
4.1. The Role of Affective Appraisal in App-Based Warning Processes
Statistical analyses confirmed Hypotheses 1 and 2, in that momentary anxiety in-
creased after receiving a warning message, as well as after being confronted with a thunder-
storm. These trajectories point to the activation of the experiential system as proposed by
the affect heuristic [36–38], and the behavioral inhibition system as defined by the BIS/BAS
model [39–42]. Facing an unexpected or potentially threatening stimulus (in the present
case, a warning of an impending thunderstorm) appeared to activate appropriate systems
and induce affective reactions. This observation corroborates previous research on the
processing of severe weather hazards [47–49]. In line with fear appeal theory [33,34], and
the PADM [21], this affective appraisal could indicate enhanced threat appraisal.
In contrast to the first two hypotheses, Hypothesis 3 was not confirmed. This means
that there was no difference in the reported level of momentary anxiety regarding the
presentation format. Videos, as well as vignettes, seem to be equally suitable for the
experimental investigation of thunderstorm warning messages. This contrasts previous
studies [71–74] that pointed to stronger affective reactions to videos. However, in said
studies, affect was mediated by perceived realism of the scenario, which we did not assess
in this study, therefore we could not compare the perceived realism of both formats. Since
higher perceived realism is associated with stronger affective reactions [65,66], this could
be a limiting factor of our study, because neither videos nor vignettes are highly immersive,
unlike modern virtual reality applications [92,93].
However, the association between perceived realism and anxiety is more complex:
research on the connection between perceived realism (as a part of the overall sense of
presence in a virtual environment) and emotional arousal (e.g., anxiety) suggests that
exteroception (i.e., immersive qualities of the environments) as well as interoception (i.e.,
physiological arousal) influence assessments of realism and anxiety [94]. Since we observed
a significant increase in anxiety ratings, we assume that it was not strongly affected by the
immersiveness of the technology, and thus exteroceptive cues, but rather the intero-ceptive
appraisal of the threat.
In future research, a direct comparison of high immersive technology (e.g., vir-
tual reality) and low immersive technology (e.g., vignettes) implementing the virtual
city framework can provide more information on the interplay of immersion, and per-
ceived realism on affective and cognitive processing of warning messages throughout the
warning process.
Furthermore, qualitative research methods can be integrated to identify relevant
dimensions of perceived realism to enhance immersiveness and arousal. A qualitative
analysis of a virtual reality fire extinguisher training, for example [95], revealed specific
aspects of the virtual environment that were connected to perceived realism and could be
addressed in future iterations of the training to improve training effects.
Finally, field studies promise higher validity and allow for in-situ assessments of phys-
iological reactions in addition to cognitive and affective appraisals of warning messages
(e.g., via ambulatory assessments) [11]. A recent study on app-based weather warnings [96]
found that affective and cognitive but not behavioral responses to warning messages dif-
fered between experimental and field approaches. In the field experiment, participants
reported better understanding of warning message, threat and how to respond, but also
less concern regarding one’s safety. But since the research was cross-sectional and didInt. J. Environ. Res. Public Health 2021, 18, 8353 12 of 17
not examine cognitive and affective appraisal of warning messages prospectively, further
research is necessary to examine and compare trajectories of appraisal and subsequent
behaviors in field studies as well as experiments. Combining field studies and the ex-
perimental approach of the virtual city framework could be a promising area for future
warning research.
4.2. Information Seeking versus Milling
By examining the search for further information, the present study mapped another
step of processing warning messages as described in the PADM, namely behavioral re-
sponses [20–22]. Hypothesis 4 was confirmed as higher momentary anxiety at the third
point of measurement was associated with increased intention to search for more informa-
tion. The results are in line with prior research, which found that emotional reactions, such
as fear, towards real-time weather events could have a main impact on the implementa-
tion of behavioral responses [30]. Activated by the BIS [39–42], momentary anxiety could
interrupt the current activity and promote seeking information for a better orientation.
This interpretation was further supported by testing Hypothesis 5, which revealed that
warning message receipt did not affect the intention to seek further information, thus Hy-
pothesis 5 had to be rejected. This indicates that momentary affect is particularly important
in the decision-making process following warning messages or weather events, which
corroborates the affect heuristic [38]. Moreover, our findings contradict the phenomenon of
milling. According to milling, the receipt of a warning message leads to an increased search
for information as the individuals at risk do not feel sufficiently informed and want to
exchange information with each other before taking protective measures [80]. In this study,
although momentary anxiety increased with warning message receipt, it also decreased
when no threat occurred. Thus, the search for further information seems to be affected
by the thunderstorm itself rather than by the warning message. This, is evident in the
non-significant correlative relationship between message receipt and information search.
Nevertheless, the search for further information embodies only one (protective) be-
havior, which can be both beneficial and detrimental [80]. Also, for most hazards as well as
for thunderstorms, a combination of several measures needs to be implemented to protect
oneself (e.g., closing doors and windows, search for shelter). Future studies should examine
all protective measures conveyed in a warning message. In this context, the intention to
act is suitable, as is the actual implementation of protective measures. Field studies could
allow situational analyses by using ambulatory assessments [96].
In an effort to include characteristics of the warning message recipients, statistical
analyses were controlled for age, gender, previous thunderstorm experience, app use, and
storm fear. With one exception (i.e., a negative association between age and anxiety at
baseline), none of these variables affected momentary anxiety. However, the bivariate
correlations (Table 1) showed that the investigated covariates were associated with anxiety,
and they may still become relevant in other stages of the warning process. For example,
participants who were currently using a weather warning app showed less momentary
anxiety at the second point of measurement (i.e., when they received a warning). This
may indicate that the affective reaction was reduced due to existing experience with
such warning messages, which may have implications for threat and efficacy appraisals
within the compliance process [34], as previous research pointed to a connection between
positive affect (i.e., less negative affect), and lower intentions regarding behavior change,
for instance, towards pro-environmental behavior [35]. This interplay of warning app use,
affective and cognitive risk appraisal, and compliance warrants further research.
Positive correlations also emerged between app use and prior thunderstorm experi-
ence, as well as app use and storm fear. One can assume that individuals who had already
experienced severe weather and were perhaps harmed were more likely to develop a fear
regarding storms and, therefore, wanted to protect themselves through the use of weather
warning apps [81,83–85]. Although these correlations do not imply causality and requireInt. J. Environ. Res. Public Health 2021, 18, 8353 13 of 17
further investigation, it becomes apparent that the characteristics of the message receivers
should not be neglected.
4.3. Limitations
The present study clearly has limitations that should be considered when interpreting
the results. The results are based on a German convenience sample. Therefore, no represen-
tative statements can be made. Since weather-related fears are relatively low in Germany
and European countries vary in their risk communication practice and policies [9,24], an
international comparison would be of interest.
Although this study was based on established and well-known definitions of severe
weather (according to the DWD), and recommendations for designing mobile public
warning messages [11,20,89], we did not examine the realism and perceived of each vignette
or video. Prior research showed that the more severe or threatening a weather event is
perceived, the more likely it is for those at risk to take protective actions and start to
implement them at an earlier stage [83]. Because of this, future research should consider
various levels of severity, and assess cognitive and affective appraisals of the hazard
simultaneously. Similarly, effects of differing warning message content and style could also
be tested, as we were not able to vary aspects, such as length and design, that may have an
impact on affective reactions [78].
Although the participants in the present study were presented with realistic footage
of warning messages sent by an app and thunderstorms (e.g., video material), we were not
able to collect data under real-life conditions (e.g., field studies). Recent research shows,
however, that scenario-based surveys do not seem to differ from field assessments in their
results [30]. Nevertheless, the virtual city framework could also be tested in more realistic
conditions, for example, by using virtual reality [64], and be extended by more fine-grained
assessments, such as ambulatory assessments to further explore psychosocial mechanisms
of warning compliance and observe behavioral reactions.
5. Conclusions
Overall, the results of this study indicate that app-based warning messages regarding a
severe weather event as well as the event itself differentially affect momentary anxiety (i.e.,
negative affect) throughout the warning process, when controlling for previous warning
app use as well as experience with thunderstorms. While the study has methodological
limitations, it provides support for a virtual city framework to test warning messages
and subsequent appraisals, and potentially behaviors. The multi-step structure allows
for a segmentation of the warning process that can be used to study psychophysiological,
cognitive, and affective correlates of each step of the warning process more closely. With
mobile warning apps increasing in popularity and reach, the digital setting presented in
this study can be useful to develop and test different types of warnings and conditions
with presumably high internal validity, before implementing them in field studies, and
testing their ecological validity. The set-up could also be used to implement warning-based
trainings, for senders and receivers of warning messages. Therefore, we welcome future
research to replicate and refine the virtual city framework in more diverse samples, using
different measures and investigating different hazards, to improve our understanding of
app-based warning processing, and strengthen preventive efforts and resiliency.
Supplementary Materials: The following are available online at https://www.mdpi.com/article/10
.3390/ijerph18168353/s1, File S1: Vignettes; File S2: Videos. The Supplementary Material is available
online. It contains supplementary files S1 and S2 that were used as study materials.
Author Contributions: Conceptualization, S.T. and H.M.; Data curation, M.R. and H.M.; Formal
analysis, S.T. and H.M.; Investigation, S.T. and H.M.; Methodology, S.T. and H.M.; Project administra-
tion, S.T. and H.M.; Resources, S.T. and H.M.; Software, M.R. and H.M.; Supervision, S.S.; Validation,
S.T.; Visualization, M.R.; Writing–original draft, S.T. and M.R.; Writing–review & editing, H.M. and
S.S. All authors have read and agreed to the published version of the manuscript.Int. J. Environ. Res. Public Health 2021, 18, 8353 14 of 17
Funding: This research received no external funding.
Institutional Review Board Statement: The study was conducted according to the guidelines of
the Declaration of Helsinki, and approved by the Ethics Committee of the University Medicine
Greifswald (protocol code BB098/19; 1 August 2019).
Informed Consent Statement: Informed consent was obtained from all subjects involved in the study.
Data Availability Statement: The data presented in this study are available on request from the
corresponding author. The data are not publicly available due to ethical concerns.
Acknowledgments: We would like to thank Matthias Brasch for creating the stimuli used in this
study. We would like to thank Tom Lukas Tegler and Lisa Sophie Ruff for their support in study
preparation, including study materials, and data collection.
Conflicts of Interest: The authors declare no conflict of interest.
Appendix A
Table A1. Momentary anxiety in the overall sample, divided by groups (warning message vs. no warning message;
thunderstorm vs. no thunderstorm; video vs. vignette).
Group 1 Group 2 Group 5 Group 6
Group 3 Group 4 Group 7 Group 8
Mo- No No No No
Warning, Warning, Warning, Warning,
men- Total Warning, Warning, Warning, Warning,
No Thun- Thunder- No Thun- Thunder-
Tary Sample No Thun- Thunder- No Thun- Thunder-
derstorm, storm, derstorm, storm,
Anx- N = 276 derstorm, storm, derstorm, storm,
Video Video Vignette Vignette
iety Video Video Vignette Vignette
n = 18 n = 56 n = 16 n = 51
n = 21 n = 51 n = 12 n = 51
M SD M SD M SD M SD M SD M SD M SD M SD M SD
t1 1.36 0.74 1.14 0.48 1.33 0.77 1.17 0.51 1.50 0.87 1.25 0.62 1.45 0.83 1.38 0.72 1.31 0.65
t2 1.57 0.87 1.05 0.22 1.22 0.61 1.78 0.88 1.78 0.92 1.58 1.00 1.35 0.74 1.94 0.85 1.96 1.02
t3 2.08 1.15 1.24 0.70 1.76 1.09 1.50 0.71 2.46 1.14 1.50 0.80 2.45 1.08 1.38 0.72 2.51 1.22
Note. Points of measurement: t1 (beginning of the cover story), t2 (warning message receipt vs. no receipt), t3 (thunderstorm vs. no
thunderstorm). Momentary anxiety was assessed using a 5-point Likert scale, ranging from 1 (not at all) to 5 (extremely).
References
1. Doswell, C.A.; Edwards, R.; Thompson, R.L.; Hart, J.A.; Crosbie, K.C. A Simple and Flexible Method for Ranking Severe Weather
Events. Weather Forecast. 2006, 21, 939–951. [CrossRef]
2. Establishing Guideline for Implementation of a Demonstration Project of Severe Weather Forecasting; World Meteorological Orga-
nization, Ed.; In Proceedings of the Workshop on Severe and Extreme Events Forecasting, Toulouse, France, 26–29 October 2004.
3. Doswell, C.A. Societal impacts of severe thunderstorms and tornadoes: Lessons learned and implications for Europe. Atmos. Res.
2003, 67–68, 135–152. [CrossRef]
4. Allen, J.T.; Allen, E.R. A review of severe thunderstorms in Australia. Atmos. Res. 2016, 178–179, 347–366. [CrossRef]
5. Doswell, C.A. Severe convective storms in the European societal context. Atmos. Res. 2015, 158–159, 210–215. [CrossRef]
6. Groenemeijer, P.; Púčik, T.; Holzer, A.M.; Antonescu, B.; Riemann-Campe, K.; Schultz, D.M.; Kühne, T.; Feuerstein, B.; Brooks,
H.E.; Doswell, C.A.; et al. Severe Convective Storms in Europe: Ten Years of Research and Education at the European Severe
Storms Laboratory. Bull. Am. Meteorol. Soc. 2017, 98, 2641–2651. [CrossRef]
7. Kron, W.; Löw, P.; Kundzewicz, Z.W. Changes in risk of extreme weather events in Europe. Environ. Sci. Policy 2019, 100, 74–83.
[CrossRef]
8. Taszarek, M.; Allen, J.T.; Groenemeijer, P.; Edwards, R.; Brooks, H.E.; Chmielewski, V.; Enno, S.-E. Severe Convective Storms
across Europe and the United States. Part I: Climatology of Lightning, Large Hail, Severe Wind, and Tornadoes. J. Clim.
2020, 33, 10239–10261. [CrossRef]
9. Rauhala, J.; Schultz, D.M. Severe thunderstorm and tornado warnings in Europe. Atmos. Res. 2009, 93, 369–380. [CrossRef]
10. Mayhorn, C.B.; McLaughlin, A.C. Warning the world of extreme events: A global perspective on risk communication for natural
and technological disaster. Saf. Sci. 2014, 61, 43–50. [CrossRef]
11. Bean, H.; Sutton, J.; Liu, B.F.; Madden, S.; Wood, M.M.; Mileti, D.S. The Study of Mobile Public Warning Messages: A Research
Review and Agenda. Rev. Commun. 2015, 15, 60–80. [CrossRef]
12. Potter, S.H.; Kreft, P.V.; Milojev, P.; Noble, C.; Montz, B.; Dhellemmes, A.; Woods, R.J.; Gauden-Ing, S. The influence of impact-
based severe weather warnings on risk perceptions and intended protective actions. Int. J. Disaster Risk Reduct. 2018, 30, 34–43.
[CrossRef]Int. J. Environ. Res. Public Health 2021, 18, 8353 15 of 17
13. Weyrich, P.; Scolobig, A.; Bresch, D.N.; Patt, A. Effects of Impact-Based Warnings and Behavioral Recommendations for Extreme
Weather Events. Weather Clim. Soc. 2018, 10, 781–796. [CrossRef]
14. Reuter, C.; Kaufhold, M.; Leopold, I.; Knipp, H. KATWARN, NINA, or FEMA? Multi-method study on distribution, use, and
public views on crisis apps. In Proceedings of the Twenty-Fifth European Conference on Information Systems (ECIS), Guimarães,
Portugal, 5–10 June 2017; pp. 2187–2201.
15. Fischer, D.; Putzke-Hattori, J.; Fischbach, K. Crisis Warning Apps: Investigating the Factors Influencing Usage and Compliance
with Recommendations for Action. In Proceedings of the 52nd Hawaii International Conference on System Sciences, Honolulu,
Hawaii, 8–11 January 2019.
16. Petridou, E.; Danielsson, E.; Olofsson, A.; Lundgren, M.; Große, C. If Crisis or War Comes: A Study of Risk Communication of
Eight European Union Member States. JICRCR 2019, 2, 207–232. [CrossRef]
17. DWD. Wetter und Klima—Deutscher Wetterdienst—Our Services—WarnWetter-App. Available online: https://www.dwd.de/
EN/ourservices/warnwetteapp/warnwetterapp.html (accessed on 8 March 2021).
18. Zabini, F. Mobile weather apps or the illusion of certainty. Met. Appl. 2016, 23, 663–670. [CrossRef]
19. Phan, M.D.; Montz, B.E.; Curtis, S.; Rickenbach, T.M. Weather on the Go: An Assessment of Smartphone Mobile Weather
Application Use among College Students. Bull. Amer. Meteor. Soc. 2018, 99, 2245–2257. [CrossRef]
20. Sutton, J.; Kuligowski, E.D. Alerts and Warnings on Short Messaging Channels: Guidance from an Expert Panel Process.
Nat. Hazards Rev. 2019, 20, 4019002. [CrossRef]
21. Lindell, M.K.; Perry, R.W. The protective action decision model: Theoretical modifications and additional evidence. Risk Anal.
2012, 32, 616–632. [CrossRef]
22. Lindell, M.K.; Perry, R.W. Communicating Environmental Risk in Multiethnic Communities; SAGE Publications: Thousand Oaks, CA,
USA, 2003.
23. Wachinger, G.; Renn, O.; Begg, C.; Kuhlicke, C. The risk perception paradox–implications for governance and communication of
natural hazards. Risk Anal. 2013, 33, 1049–1065. [CrossRef]
24. Keul, A.G.; Brunner, B.; Allen, J.; Wilson, K.A.; Taszarek, M.; Price, C.; Soleiman, G.; Sharma, S.; Roy, P.; Aini, M.S.; et al.
Multihazard Weather Risk Perception and Preparedness in Eight Countries. Weather Clim. Soc. 2018, 10, 501–520. [CrossRef]
25. Williams, D.J.; Noyes, J.M. How does our perception of risk influence decision-making? Implications for the design of risk
information. Theor. Issues Ergon. Sci. 2007, 8, 1–35. [CrossRef]
26. Leppin, A.; Aro, A.R. Risk perceptions related to SARS and avian influenza: Theoretical foundations of current empirical research.
Int. J. Behav. Med. 2009, 16, 7–29. [CrossRef] [PubMed]
27. Wilson, R.S.; Zwickle, A.; Walpole, H. Developing a Broadly Applicable Measure of Risk Perception. Risk Anal. 2019, 39, 777–791.
[CrossRef] [PubMed]
28. Sheeran, P.; Harris, P.R.; Epton, T. Does heightening risk appraisals change people’s intentions and behavior? A meta-analysis of
experimental studies. Psychol. Bull. 2014, 140, 511–543. [CrossRef] [PubMed]
29. Rahn, M.; Tomczyk, S.; Schmidt, S. Storms, Fires, and Bombs: Analyzing the Impact of Warning Message and Receiver
Characteristics on Risk Perception in Different Hazards. Risk Anal. 2020. [CrossRef]
30. Weyrich, P.; Scolobig, A.; Walther, F.; Patt, A. Responses to severe weather warnings and affective decision-making. Nat. Hazards
Earth Syst. Sci. 2020, 20, 2811–2821. [CrossRef]
31. Villegas, J.; Matyas, C.; Srinivasan, S.; Cahyanto, I.; Thapa, B.; Pennington-Gray, L. Cognitive and affective responses of Florida
tourists after exposure to hurricane warning messages. Nat. Hazards 2013, 66, 97–116. [CrossRef]
32. Gutteling, J.M.; Terpstra, T.; Kerstholt, J.H. Citizens’ adaptive or avoiding behavioral response to an emergency message on their
mobile phone. J. Risk Res. 2018, 21, 1579–1591. [CrossRef]
33. Prentice-Dunn, S.; Rogers, R.W. Protection Motivation Theory and preventive health: Beyond the Health Belief Model.
Health Educ. Res. 1986, 1, 153–161. [CrossRef]
34. Witte, K. Putting the fear back into fear appeals: The extended parallel process model. Commun. Monogr. 1992, 59, 329–349.
[CrossRef]
35. Hine, D.W.; Marks, A.D.; Nachreiner, M.; Gifford, R.; Heath, Y. Keeping the home fires burning: The affect heuristic and wood
smoke pollution. J. Environ. Psychol. 2007, 27, 26–32. [CrossRef]
36. Finucane, M.L.; Alhakami, A.; Slovic, P.; Johnson, S.M. The affect heuristic in judgments of risks and benefits. J. Behav. Decis. Mak.
2000, 13, 1–17. [CrossRef]
37. Slovic, P.; Peters, E. Risk Perception and Affect. Curr. Dir. Psychol. Sci. 2006, 15, 322–325. [CrossRef]
38. Slovic, P.; Finucane, M.L.; Peters, E.; MacGregor, D.G. The affect heuristic. Eur. J. Oper. Res. 2007, 177, 1333–1352. [CrossRef]
39. Amodio, D.M.; Master, S.L.; Yee, C.M.; Taylor, S.E. Neurocognitive components of the behavioral inhibition and activation
systems: Implications for theories of self-regulation. Psychophysiology 2008, 45, 11–19. [CrossRef]
40. Voigt, D.C.; Dillard, J.P.; Braddock, K.H.; Anderson, J.W.; Sopory, P.; Stephenson, M.T. BIS/BAS scales and their relationship to
risky health behaviours. Personal. Individ. Differ. 2009, 47, 89–93. [CrossRef]
41. Carver, C.S.; White, T.L. Behavioral inhibition, behavioral activation, and affective responses to impending reward and punish-
ment: The BIS/BAS Scales. J. Personal. Soc. Psychol. 1994, 67, 319–333. [CrossRef]
42. Gray, J.A. Brain Systems that Mediate both Emotion and Cognition. Cogn. Emot. 1990, 4, 269–288. [CrossRef]You can also read