A Statistical Overview of the Kentucky Death Penalty - Frank ...
←
→
Page content transcription
If your browser does not render page correctly, please read the page content below
A Statistical Overview of the Kentucky Death Penalty

                                    Frank R. Baumgartner
               Richard J. Richardson Distinguished Professor of Political Science
                        The University of North Carolina at Chapel Hill
                                            MS 3265
                                  Chapel Hill NC 27599-3265
                                        frankb@unc.edu
                                     http://fbaum.unc.edu/

Abstract:
In the years since 1975, when the state of Kentucky established its modern death penalty system,
the state has condemned 82 individuals to die, resulting in three executions. Any assessment of
the value of the punishment must contend with certain facts. First, use of the death penalty has
been unequal with respect to race, particularly that of the victim. Cases with white victims are
more than five times as likely to see a death sentence as those with black victims, and those with
white female victims are 11 times as likely to see a death sentence as those with black male
victims. When the offender is black and the victim a white female, odds are more than 20 times
greater for a death sentence than in cases where both are black. These extraordinary racial
disparities call into question the equity of the entire system, but they are not the only flaws. The
death penalty is extremely rare; of more than 10,500 homicides in the post-1975 period, just
three (0.03 percent) have led to an execution, and 82 (0.77 percent) have led to a death sentence.
Of the 82 death sentences imposed, 41 have been reversed, eight have ended in natural death, 30
have resulted in the individual remaining on death row, often decades after the crime, and just
three have resulted in execution. Individuals sentenced to death are 14 times more likely to have
their sentence reversed than be executed. The average age of those on death row has risen from
approximately 30 in 1976 to more than 60 today. Finally, the punishment is not handed down
proportionately across the counties of the state. Overall, this assessment reveals a number of
flaws in the use of the ultimate punishment. Because of its comprehensive scope, dealing with
the entire modern period, and every death sentence, it should ignite a conversation about what is
the criminal justice value of a system that is so racially biased, ineffective, prone to error, and
unreliable.

Keywords: Capital punishment, death penalty, homicide, racial disparities, geography, Kentucky

                                         January 11, 2022
Introduction
Any death penalty system should be assessed based on its actual functioning, not on how anyone

might wish or hope it would function. In this report, I provide relevant facts and figures relating

to the history of use of the death penalty in Kentucky with a focus on the “modern” period, since

1975 when the current death penalty system was created.1

         In 2018, I published a book providing a “statistical portrait” of the U.S. death penalty

system; facts and figures about capital punishment, particularly focused on trends over time and

other quantifiable indicators about the actual functioning of the U.S. death penalty system (see

Baumgartner et al. 2018). In the period since then, I have established a national database with

information on every death sentence imposed since 1973. While this database is not perfectly

complete (information about certain facts about every case could not be found), it provides

information about 8,691 individuals, including the county of their conviction; the dates of birth,

crime, death sentence, and removal from death row; race and gender of the offender; and the

eventual outcome of the case or its current status as of 2021. Associated with this work, I have

also compiled information from the Centers for Disease Control and the FBI about homicides,

linking them to the year and the county where they were committed. This work has supported

several peer reviewed publications (Baumgartner Box-Steffensmeier and Campbell 2018,

Baumgartner et al. 2020) and is the most complete such set of records currently available. In this

report, I examine this accumulated statistical information for the state of Kentucky. My hope is

to provide relevant facts to allow a fair assessment of the value of the system as it has functioned

over the entire time period.

1
  The US Supreme Court invalidated all state death penalty systems in 1972 with its Furman v. Georgia decision.
Kentucky, like other states, was forced to revise its statute to meet new safeguards for proportionality and other
factors. The “modern” death penalty refers to this post-1975 system.

                                                                                                                     2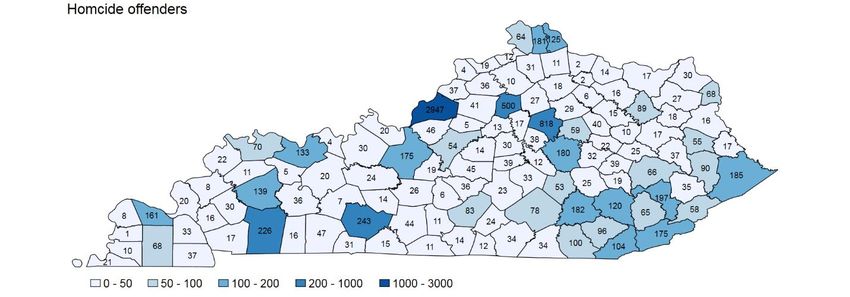
Racial disparities
Kentucky has sentenced 82 individuals to die in the years since 1975; 79 have been men and 3

women. The racial breakdown of these death-sentenced individuals is 63 white (76.8 percent), 18

black (21.9 percent), and one Latinx (1.2 percent). Table 1 summarizes the patterns associated

with race and gender of offenders and victims in Kentucky homicides (1976 to 2019) and death

sentences. Of course, every homicide is not death-eligible, and the aggregate comparison of

homicides with death sentences in general does not allow a micro-level comparison of the facts

of the crime and other relevant factors that might determine why a particular individual receives

a death sentence and another does not. Still, looking at aggregate patterns can allow some

assessment of which cases tend, on average, to be considered among the “worst of the worst” and

therefore result in capital prosecutions. These comparisons are therefore of great interest.

       Table 1 compares homicide cases, of which there were over 10,000 in Kentucky during

the period of study, with the 82 death sentences imposed in the state. It shows the race and sex of

the offenders, then those characteristics of the victims, and finally the different offender-victim

combinations. For each group in the table, it shows the number of homicide cases as well as the

percentage that these represent of the total. The last row calculates the “death sentencing rate”

which is simply the number, per 100 such homicides, who are sentenced to death. The first row,

shows, for example, that of 9,803 homicide offenders, 82 received a death sentence, and the rate

therefore is 0.84, or just less than one percent of all homicide offenders.

       The comparison of homicide rates within each category is of primary interest. If race and

gender were not consequential in determining which cases are more likely to lead to a sentence

of death, then all of the rates would be roughly similar, give or take some random fluctuation.

Note that when we compare offenders, there are 82 death sentences out of 9,803 individuals who

have committed homicide, but when we look at the victims from those same cases, there are 135

                                                                                                      3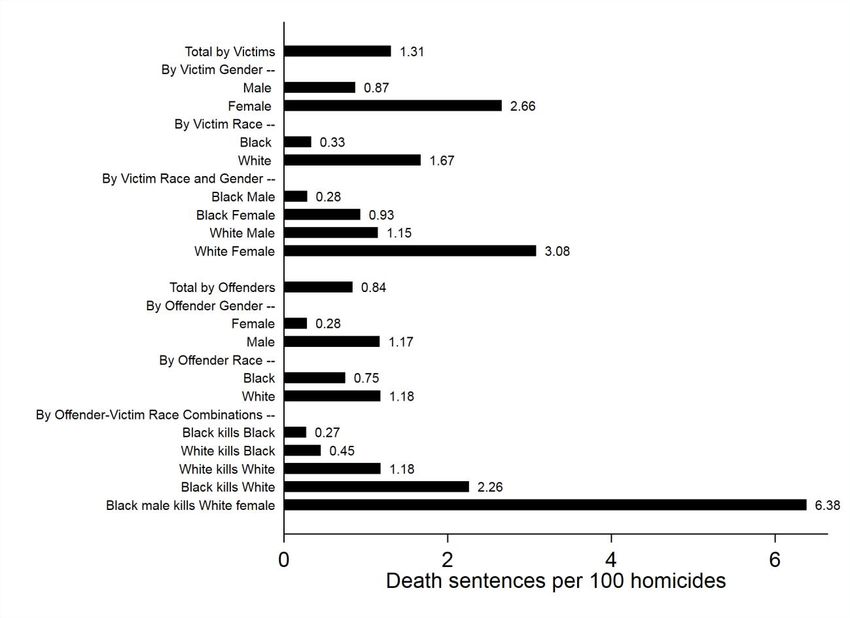
victims from death sentenced cases out of 10,342 homicide victims overall. The rate by victim is

therefore 1.31 and the rate by offender is 0.84.

       When we look at this death-sentencing rate across the different categories, we see that it

differs dramatically by race and gender, suggesting significant systematic tendencies to reserve

capital punishment for cases involving white victims. Reading down the last column of the Table

shows, for example, that male offenders are sentenced to death in 1.17 percent of all homicide

cases, but female offenders are so sentenced in only 0.28 percent of the cases. That means that,

on average, male offenders are more than 4 times as likely to be sentenced to death as female

homicide offenders (1.17 / 0.28 = 4.18). Following Table 1, Figure 1 summarizes these

differences in death sentencing rates.

                                                                                                    4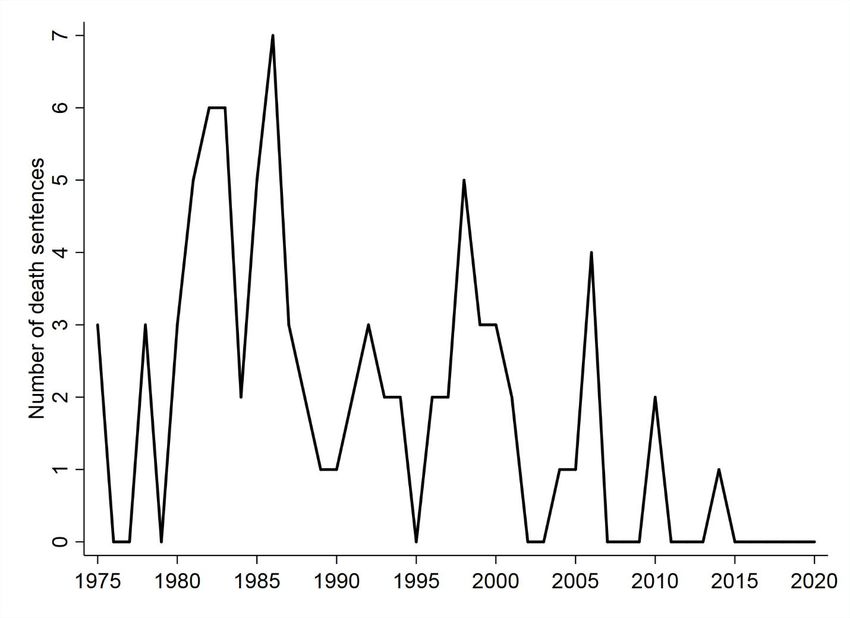
Table 1. Race and gender characteristics of homicides and death sentences compared.
                                                                                  Rate per
                                                                    Death           100
                                            Homicides             Sentences      Homicides
 Number of Offenders                        9,803       %         82         %         0.84

 Male Offenders                           6,762     86.3        79        96.3         1.17
 Female Offenders                         1,072     13.7         3         3.7         0.28
 Total by Sex of Offender                 7,834    100.0        82       100.0         1.05

 White Offenders                          5,354     69.0        63        77.8         1.18
 Black Offenders                          2,406     31.0        18        22.2         0.75
 Total White or Black Offenders           7,760    100.0        81       100.0         1.04

 Number of Victims                      10,342         %       135          %          1.31

 Male Victims                            7,810       75.6       68        50.4         0.87
 Female Victims                          2,519       24.4       67        49.6         2.66
 Total by Sex of Victim                 10,329       99.9      135       100.0         1.31

 White Victims                           7,187      70.5       120        92.3         1.67
 Black Victims                           3,014      29.5        10         7.7         0.33
 Total either Black or White            10,201     100.0       130       100.0         1.27

 White Male Victims                      5,239      51.4        60        45.5         1.15
 Black Male Victims                      2,476      24.3         7         5.3         0.28
 White Female Victims                    1,948      19.1        60        45.5         3.08
 Black Female Victims                      537       5.3         5         3.8         0.93
 Total White Black Male or Female       10,200     100.0       132       100.0         1.29

 Offender-Victim Combinations
 White kills White                          5,087       66.1       60         69.0        1.18
 White kills Black                            223         2.9        1         1.1        0.45
 Black kills White                            531         6.9      12         13.8        2.26
  - (Of which, Black male kills
      White female)                           141         1.8        9        10.3        6.38
 Black kills Black                          1,850       24.1         5         5.7        0.27
 Total by Race of Offender and
 Victim                                     7,691      100.0       87       100.0         1.13
Source: Homicides data from FBI, covering the period of 1976 to 2019 (see Kaplan 2020). Death
sentences: author. Note that some cases involve victims of more than one race. In such cases,
“white victim” is defined as where any of the victims is white, and “black victim” means that
there was at least one such victim, but no white victims.

                                                                                              5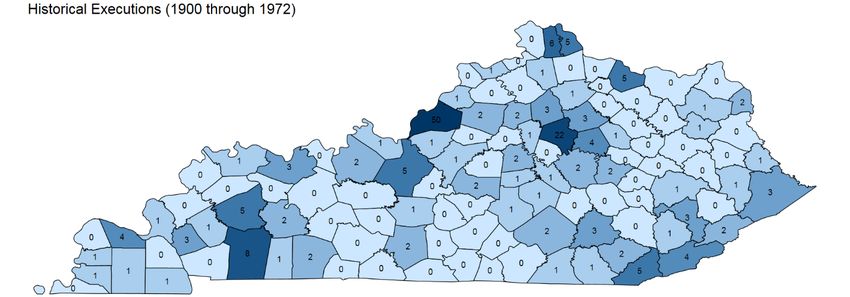
Figure 1. Death Sentencing Rates by Race and Gender of Offender and Victim.

Source: See Table 1.

       Figure 1 summarizes the main results apparent from Table 1, and the Table provides the

precise numbers that produce these patterns. Looking at victims, those with male victims are

much less likely to receive a sentence of death than those with female victims: 0.87 v. 2.66,

which is a ratio of more than 3. Looking at the victims’ race, those with white victims are more

than 5 times as likely (1.67 percent) to be sentenced to death than those with black victims

(0.33). These death-sentencing ratios reach a value of 11 when we compare those with white

female victims (3.08 percent sentenced to death) to those with black male victims (0.28 percent).

Note from Table 1 that black male victims represent 29.5 percent of all homicide victims in the

state, but under 8 percent of the victims in cases leading to a death sentence. Looking at

offenders shows that male offenders are more than 3 times as likely to see a death sentence as

                                                                                                   6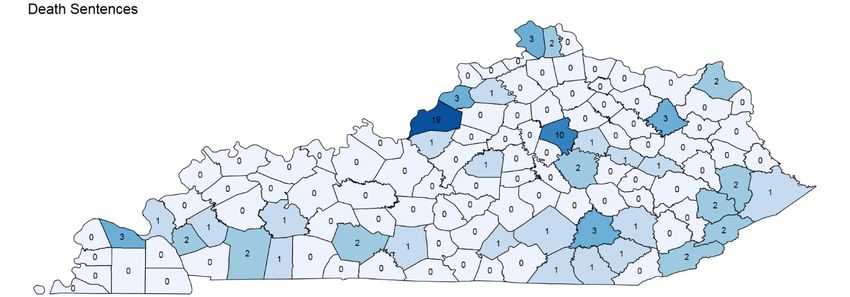
female offenders, and that white offenders are 1.57 times as likely to see a death sentence

compared to black offenders. While this racial difference may appear to be counter-intuitive, the

reason for this is clear. Most white offenders have white victims, and such crimes have a higher

rate of death sentencing (1.18) compared to those where black offenders have black victims (0.27

percent). The most powerful distinctions in death sentencing outcomes come when we look at

the race of both the victim and the offender. The Table also shows the particular combination of

white female victims and black male offenders. Looking at these combined victim-offender

combinations shows that such crimes are more than 20 times as likely to lead to a death sentence

compared to the more common instance of black offenders with black victims. Note that there

were only 141 cases in the entire time frame when a black offender was alleged to have killed a

white female, or 1.8 percent of all homicides. Nine of these cases lead to a death sentence,

however, so they represented more than 10 percent of all death sentenced cases.

       Figure 2 summarizes the differences just described. For each comparison laid out in

Figure 1, it shows the ratio of the highest death-sentencing rate to the lowest.

                                                                                                   7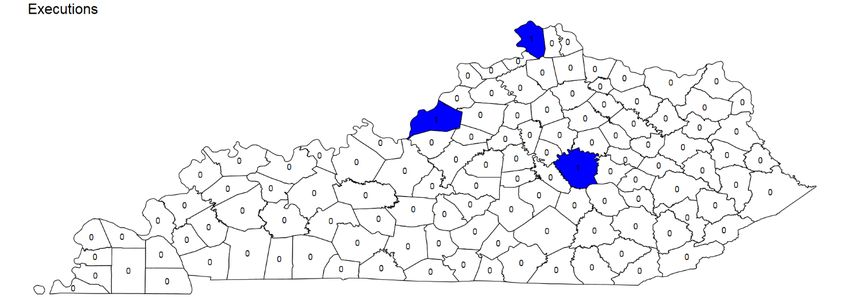
Figure 2. Death Sentencing Rates Compared.

Source: Calculated from Figure 1. Ratios are calculated by dividing the highest value within a
category by the lowest value in that same category.

       Figure 2 allows a simple comparison of what comparisons generate the largest

differences in rates of use of the death penalty. Note that all the values are substantially different

from 1.00, which would be the ratio if there were no difference in rates of use across the various

categories. For offender race, the ratio of 1.57 reflects the fact from Figure 1 that white offenders

are 57 percent more likely to receive a death sentence than black offenders. This is the smallest

difference observed. Victim gender shows a much greater disparity, offender gender is even

greater than that, and so on. The ratios of 11 and 24 seen for victim race and gender, and

offender-victim race combinations show that these distinctions are powerful determinants of

death sentencing outcomes.

                                                                                                     8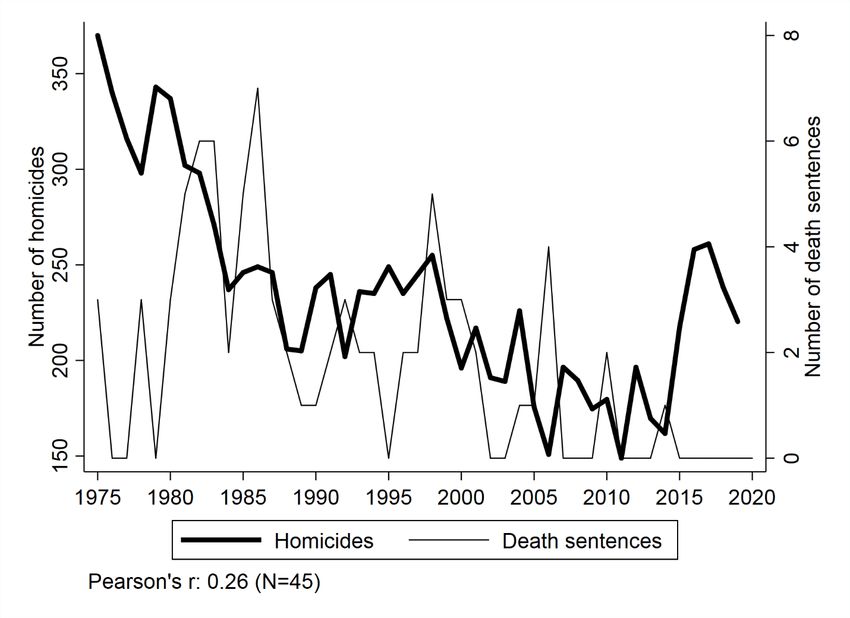
These remarkable statistics on different rates of death penalty usage depending on the

characteristics of the offenders and victims are consistent with what has been found in national

studies. These, however, compared homicide cases with cases leading to execution (see

Baumgartner, Grigg, and Mastro 2015). As Kentucky has carried out just three executions, no

statistical comparison will be attempted here. But all three executed individuals had a white

female victim. The offenders themselves were all white males, but given the statistics laid out

here, the fact that they had white female victims may be the more important driving factor. Most

killers of white victims, including white female victims, are white males. In assessing the power

of race in death sentencing outcomes, it is important to look simultaneously at the victims as well

as the offenders and to keep in mind that the vast majority of homicides in Kentucky, as in other

U.S. states, involve victims and offenders of the same race.

       Race may be the most powerful driving factor in Kentucky’s death penalty. But the racial

disparities laid out here, extreme as they are, are not the only flaws in the system. It has a host of

others: very low levels of use, little connection to homicide occurrence, geographic arbitrariness,

high rates of error and reversal, and delays in carrying out death sentences leading to a graying

population on death row. None of these characteristics speaks of a system that anyone would

design nor choose to have. But we must assess the system as it really works, not as we wish it

would be. The following sections lay out these additional problems beyond the racial inequities

just described.

Declining usage over time
In parallel with the United States as a whole, judicial executions in Kentucky were more

common in the distant past. Nation-wide, and in the state, the number of executions peaked in

the 1930s. Figure 3 shows the number of judicial executions per decade, as well as the share of

                                                                                                     9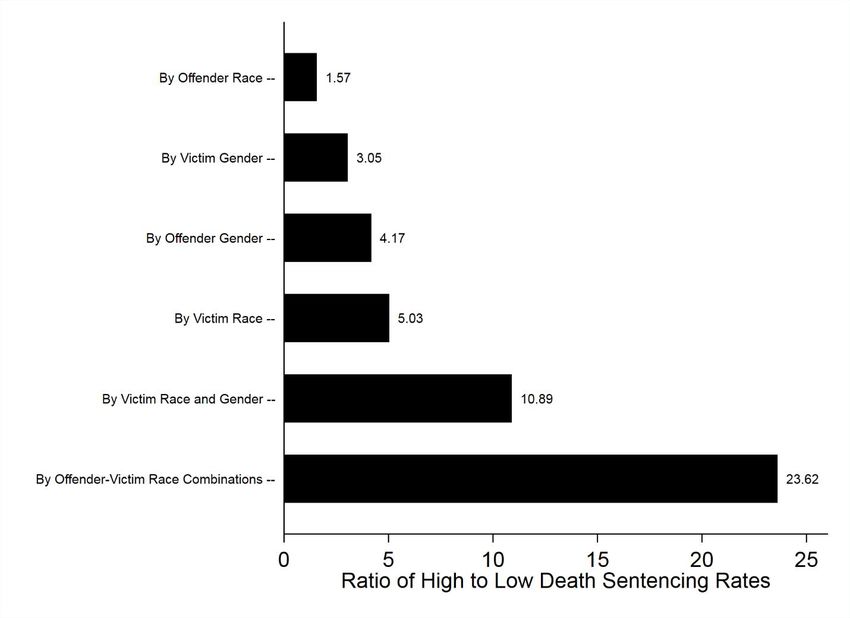
those executed who were black. Historically, from 1780 through the 1960s, 424 individuals were

executed, including 175 whites (41 percent) and 232 blacks (55 percent). A small number were

of other races. In the modern era (e.g., since the Furman decision in 1972), however, just three

individuals have been executed in Kentucky. Those three individuals were all white.

Figure 3. Judicial executions in Kentucky over time

Source: Pre-Furman cases from Espy and Smykla 2005; modern cases from author.

       Since 1975, 82 individuals have been sentenced to death, an average of about two per

year. Figure 4 shows these numbers, making clear their peak at seven death sentences in 1986

and a steady decline since then, particularly since 1998, when five individuals were condemned.

The state has not issued a new death sentence in the past six years.

                                                                                                   10
Figure 4. Death sentences in the modern era
Source: Author.
Few executions carried out since 1976
Kentucky has carried out three executions in the modern (post-Furman) era: Harold McQueen on
July 1, 1997 for a 1980 crime in Madison County; Edward Lee Harper, on May 25, 1999 for a
Jefferson County crime in 1982; and Marco Allen Chapman on November 21, 2008 for a 2002
crime in Boone County. All three were white men; all three had white female victims; two also
had white male victims. Two were “volunteers” for execution, having dropped their appeals. Mr.
McQueen was electrocuted and the other two were killed by lethal injection.
11High rates of reversal
If there have been 82 death sentences but only three executions, it seems obvious that many
cases must have other outcomes. As of 2021, 30 individuals remain under sentence of death.
What happened to the others? Figure 5 shows the outcomes of all 82 cases, and how these
patterns developed over time.
Figure 5. A summary of outcomes of Kentucky death penalty cases
Source: Author.
The thick black line defining the top of the curves in Figure 5 shows the cumulative
number of individuals sentenced to death over time. It is the simple count of the annual totals
from Figure 4. It climbed steeply in the early years, reflecting the higher numbers of death
sentences being imposed during that period, reflected also in Figure 4. The blue line shows the
size of the state’s death row population. It rises in parallel with the total number of death
12sentences in the early years, but then a number of sentence reversals begin to be apparent by the
late 1980s (see the green line). The total population of death row remained relatively steady from
approximately 1986, when it reached 31, to a peak of 41 in 2006, and to its current size, 30.
Eight individuals have died, one a suicide, and the others from natural causes while under
sentence of death. The single most common outcome of a death sentence, affecting exactly half
of those ever sentenced to death, is to see a successful appeal of their death sentence and the
imposition of a new sentence. In fact, individuals are nearly 14 times more likely to have their
sentence reversed than carried out. One individual, Larry Osborne, was exonerated in 2002; he
had been 17 years of age at the time of the crime for which he was sentenced to death based on
the perjured testimony from a 15 year-old friend whose police interrogation tape had a
mysterious 40-minute gap. His exoneration came in 2002 (see National Registry of Exonerations,
2021).
Many reversals come after decades on death row
The 41 individuals initially sentenced to death before seeing their sentences overturned served
between 1.2 and 36 years on death row, with an average of 8 years. This time has increased
steadily over time. One individual, Lief Halvorsen, was sentenced in 1983 as a 28 year old man
and was removed from death row in December, 2019, at the age of 65, when Governor Matt
Bevin commuted his sentence. Halvorsen had earned two college degrees and served as a mentor
to younger inmates in his years under sentence of death (see WDRB 2020). Figure 6 shows the
rapidly increasing times individuals have spent on death row before release. It shows, for each of
the 41 individuals removed from death row, the number of years they spent on death row, by the
date of their removal.
13Figure 6. Elapsed time on death row for those whose sentences were reversed
Many reversals come after only a few years, as can be seen by the row of observations
toward the bottom of the graph. However, about half served for 10 years or longer under
sentence of death before seeing their sentence eventually overturned: 20 served more than 10
years; 16 more than 15 years; nine more than 20 years; three more than 25 years; and one served
36 years.
A geriatric death row
Among those remaining on death row, they are an older and older group of individuals. Figures 4
and 5 made clear that few new individuals are being added to the state’s death row population, so
as the years go by, the age of those remaining has increased dramatically. Figure 7 shows the
14ages of each individual on death row at six different time points: 1976, 1980, and then every ten
years since then, through to 2020.
Figure 7. Ages of Kentucky death row inmates over time
Source: Author.
The average age of death row prisoners moved as follows in the figures, as indicated by
the red vertical lines: 34.3, 32.0, 36.1, 41.9, 50.5, and 60.3. As of 2020, no individual on death
row was under the age of 45, and five individuals, or one-sixth of the total, were in their
seventies.
Little connection to homicide rates over time
There are two main ways to assess the numbers of homicides in a given year. The Centers for
Disease Control records all deaths, including the cause of death, which includes different forms
15of homicide (CDC, annual). The FBI reports homicide counts based on police records. I
collected CDC data on homicide victims from 1959 through 2004, when the CDC stopped
reporting them by state. I collected FBI data from 1976 through 2019 from a database compiled
by Jacob Kaplan (2021). Figure 8 shows the CDC and the FBI numbers compared. Note that the
FBI numbers were missing entirely for Kentucky for 1988 and were apparently under-reported in
1987, 1989, 1994, and 1998 to 2003. This is not uncommon for the FBI Supplemental Homicide
Reports.
Figure 8. CDC and FBI homicide totals for Kentucky compared
During the years when the FBI and the CDC both reported what appear to be complete
data, they are very similar. Differences can be accounted for by the fact that the CDC records the
homicide according to the address of the decedent and the FBI does so by where the crime
16occurred. In any case, the solid line in the graph represents the best estimate of the number of
homicides over time. It is the CDC number through 2004, then it is an estimate of that number
based on the FBI reports2. After 2004, none of the FBI reports appear to be anomalous, and the
adjusted R2 in a regression predicting the CDC number from the FBI number where both appear
to be valid is 0.9936.
The CDC data can be broken down by the race of the victim, and these numbers are
consistently in the range of approximately 25 percent black victims and 75 percent white victims.
During the period from 1975 through 2004, the CDC reports a total of 7,645 homicides, of which
1,889 were black victims (24.7 percent), 5,733 were white (75.0 percent), with a very small share
of other-race victims. These numbers are similar to the totals if we extend back to 1959, but that
is before the period of interest, the modern death penalty period. The total number of estimated
homicides in Kentucky from 1975 through 2020 is 10,584.
Figure 9 compares the number of homicides, from the figure above, with the number of
death sentences imposed annually.
2
The two numbers are virtually identical, so the estimated CDC number, based on the valid FBI data is given by
this formula: CDC Homicide Victims = 0.9924395 * FBI Homicide Victims.
17Figure 9. Homicides and death sentences compared
Since 1975, the number of homicides in the state has varied from more than 350 down to
as low as 150 in 2011. At the same time, the number of death sentences has varied from zero to a
maximum of seven. The thin line shows the death sentences and the thick line shows the
homicides. Homicides were declining sharply in the first 10 years of the modern death penalty
system, while death sentences were increasing. Overall, it is clear that death sentences typically
result from a very small share of homicides, and that there is little connection between the two.
Across the 45 years presented in the figure, the correlation between the two numbers is just 0.26.
The average number of homicides from 1975 through 2019 is 235, but the number of death
sentences is 1.8, on average, from 1975 through 2020. Fewer than one percent of all homicides
lead to a death sentence. And, since just three death sentences have been ultimately carried out,
the share of homicides resulting in execution is vanishingly small: 0.028 percent.
18Idiosyncratic geographic patterns unrelated to homicides
The 82 death sentences imposed in modern times have come from just a few counties out of
Kentucky's 120 counties. Table 2 shows the number of death sentences imposed per county.
Table 2. Number of death sentences, 1972 to 2020, by county.
Number of Death Sentences Imposed Number of Counties
None 85
One 18
Two 10
Three 5
Ten (Fayette) 1
Nineteen (Jefferson) 1
Total 120
Source: Author
Just as the previous section showed that a very small share of all homicides lead to a
death sentence, so too are these death sentences concentrated in just a small number of
jurisdictions. Eighty-five counties have issued not a single death sentence over the entire period
since 1972, and all but two counties have issued fewer than four across this 48 year period. Only
Fayette County, with 10 death sentences, and Jefferson, with 19, have imposed more than three.
Figure 10 shows this geographic pattern. The vast number of counties are shaded in very light
colors, representing zero, one, or two death sentences across the entire time period.
Figure 10. Death sentences since 1972.
19By contrast with Figure 10, Figure 11 shows the cumulative numbers of homicide
offenders, according to the FBI supplemental homicide report numbers used above (see Kaplan
2021). Figure 12 then illustrates the combined rates; the number of death sentences in each
county, per 100 homicides. Comparison of the three maps allows an assessment of whether the
death sentences and homicides are closely connected. If they were strongly connected, the maps
showing death sentences and homicides would be similar, and the map showing rates of death
sentencing per 100 homicides should show equal rates across the state. What do we see?
Figure 11. Homicide offenders, 1976 to 2019.
Figure 12. Death sentences per 100 homicide victims.
Figure 11 shows some rough similarity with Figure 10, with large numbers of homicides
in the two counties, Fayette and Jefferson, with the highest use of the death penalty. But these are
also the most populous counties in the state. However, Figure 10 also shows very low rates of
20death penalty usage in many of the counties significant homicide numbers. This is apparent as
well in Figure 12. The 82 counties with no death sentences of course are all shaded in the lightest
color, but in this presentation it is clear that some counties with higher rates of death penalty
usage are not those with the highest numbers of homicides.
Figure 13 illustrates this in greater detail. Because Fayette and Jefferson Counties are so
different from the 118 other counties in terms of homicides and death sentences, the Figure is
presented with and without these outlier counties.
Figure 13. Death sentences and homicides compared.
A. All counties B. Excluding two outlier counties
Figure 13 shows a cluster of counties, 118 of 120 in fact, that never or rarely use the
death penalty. Part B of the figure focuses on these cases. Among those with no death sentences,
the number of homicides ranges from very low to 500 homicides in Franklin County, which has
more homicides than any of the other counties except for Fayette and Jefferson. Overall, the
Figure makes clear that, aside from the two outlier counties, death sentences are not strongly
associated with homicides across the counties of Kentucky. The correlation is just 0.36.
What about executions? Of course, there have been only three executions in the modern
era. These stemmed from cases in Jefferson, Madison, and Boone Counties, as shown in Figure
14.
21Figure 14. Executions.
The three counties shaded in blue in Figure 14 had 2,947, 180, and 64 cumulative
homicide offenders across the modern period (compare Figure 14 with Figure 11). So it is
impossible to make the statistical argument that judicial executions in the modern era have
stemmed from those counties with the greatest number of homicides.
Just as we see increasingly isolated use of executions in the U.S. as a whole, judicial
executions are more geographically isolated in Kentucky in the modern period as compared to
previous periods. My colleagues and I found this was the case across the U.S. states by
comparing the historical record with post-1976 events; executions are much more concentrated
in just a few states in the modern period compared with the historical record (see Baumgartner et
al. 2018, p. 338). The same is true across the counties of Kentucky. Figure 14 showed the
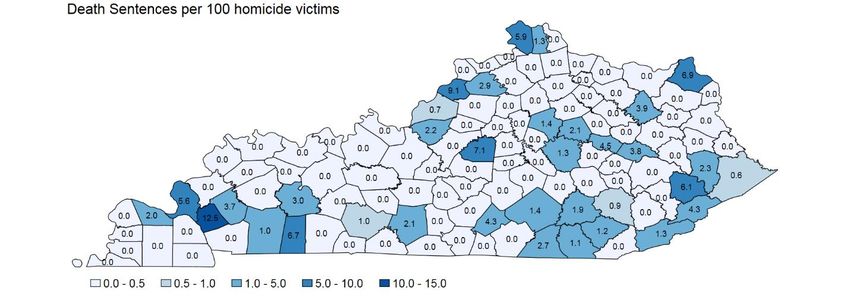
modern data for executions, and Figure 10 for death sentences. Figures 15 and 16 show the
historical record, first for the entire period from 1780 through 1972 and secondly for the period
of 1900 through 1972.
22Figure 15. Executions, 1780 to 1972.
Figure 16. Executions, 1900 to 1972.
Note that all the data associated with this section of the report appear in the Appendix.
The historical use of the death penalty was much more widespread than in modern times.
When the punishment is used so rarely as it has been since 1975, and comes from only three of
the 120 counties of the state, we can indeed ask the question of whether it conforms with
expectations about equal protection of the law. If 117 counties have not carried out even a single
execution, and 85 have not handed down a single death sentence, what distinguishes them from
those few counties that have followed a different path? Clearly, the answer is not that they have
no homicides; they do. The extreme geographic concentration of the death penalty, combined
with the declining use (shown in Figure 4, showing not a single death sentence state-wide since
232014), raises questions both of equal protection and evolving standards. At some point, the
punishment must be considered to be “unusual” in the constitutional sense. Given that it has been
applied in just 0.77 percent of all homicides, and carried out in just 0.03 percent, this conclusion
would seem clear.
Conclusion
One can support or oppose the death penalty based on philosophical or religious precepts
concerning forgiveness, the sanctity of life, or the need for retribution. One should not, however,
assume that our criminal justice system works flawlessly. In carrying out the ultimate
punishment, a state has a responsibility to do so with proportionality so that only those guilty of
the most heinous crimes, and who are the most deserving, receive the ultimate punishment.
While this overview of the historical record has been incomplete as it has not looked at the
aggravating factors associated with all 10,000+ homicides in the state since 1976, it has,
nonetheless, shown enough information to challenge any assumption that the state’s death
penalty system is coherent, reliable, proportionate, racially neutral in its application, or
reasonable by any measure. On the contrary, it exhibits extreme racial disparities, with killers of
white victims vastly more likely to receive a death sentence than those with victims of other
races; it is rarely used; it is geographically arbitrary; it has little relation with homicides either
across time or across space; it most commonly leads to decades on death row before the sentence
is later overturned on appeal; and it is falling out of use since no sentences have been handed
down since 2014, even though over 1,000 homicides have occurred in that period. It begs the
question, what is the point of retaining a costly system that is racially biased, rarely used, and so
capriciously applied?
24References
Baumgartner, Frank R., Marty Davidson, Kaneesha R. Johnson, Arvind Krishnamurthy, and
Colin P. Wilson. 2018. Deadly Justice: A Statistical Portrait of the Death Penalty. New
York: Oxford University Press.
Baumgartner, Frank R., Amanda J. Grigg and Alisa Mastro. 2015. #BlackLivesDon’tMatter:
Race-of-Victim Effects in US Executions, 1977–2013. Politics, Groups, and Identities 3,
2: 209–221.
Baumgartner, Frank R., Janet M. Box-Steffensmeier, Benjamin W. Campbell, Christian Caron,
and Hailey Sherman. 2020. Learning to Kill: Why a Small Handful of Counties
Generates the Bulk of US Death Sentences. PLoS-ONE, 15, 10 (2020): e0240401
Baumgartner, Frank R., Janet M. Box-Steffensmeier, and Benjamin W. Campbell. 2018. Event
Dependence in U.S. Executions. PLoS-ONE 13, 1 (2018): e0190244.
Centers for Disease Control (CDC). Annual. National Vital Statistics Reports. National Center
for Health Statistics, https://www.cdc.gov/nchs/products/nvsr.htm.
Espy, M. Watt, and John Ortiz Smykla. 2005. Executions in the United States, 1608–2002: The
Espy File [computer file]. ICPSR version. Ann Arbor, MI: University of Michigan
[distributor], 2016.
Kaplan, Jacob. 2021. Jacob Kaplan’s Concatenated Files: Uniform Crime Reporting (UCR)
Program Data: Supplementary Homicide Reports, 1976-2019. Ann Arbor, MI: Inter-
university Consortium for Political and Social Research [distributor], 2021-01-16.
https://doi.org/10.3886/E100699V10
National Registry of Exonerations. 2021. Larry Osborne.
https://www.law.umich.edu/special/exoneration/Pages/casedetail.aspx?caseid=4216
25WDRB. 2020. Triple murderer taken off death row by former Gov. Matt Bevin to serve rest of
life behind bars. WDRB.com. https://www.wdrb.com/news/triple-murderer-taken-off-
death-row-by-former-gov-matt-bevin-to-serve-rest-of/article_a43e52f6-9971-11ea-b010-
839a0c527d93.html
26Appendix
Table A1. List of 82 death sentences in Kentucky since 1975.
Date of
Death
Last Name First Names County Outcome Sex Race Sentence
Self Jimmy Keith McCracken 4 M W 9/15/1975*
Meadows Ronnie McCracken 4 M W 9/19/1975
Boyd Wallace Oscar Greenup 4 M W 12/12/1975
Hudson Joe Eddie Jefferson 4 M B 6/20/1978
Smith Johnny Marshall Muhlenberg 5 M W 9/29/1978
Gall Jr. Eugene William Boone 4 M W 10/6/1978
White Karu Gene Powell 10 M W 3/29/1980
O'Bryan La Verne Jefferson 5 F W 9/12/1980
Ice Todd Wolfe 5 M W 10/9/1980
McQueen Harold Madison 1 M W 1/17/1981
James Larry T Oldham 4 M W 1/20/1981
Holland Jack Joe Oldham 4 M W 1/20/1981
Bowling Alexander Rowan 2 M W 7/1/1981*
Kordenbrock Paul Boone 4 M W 7/10/1981
Stanford Kevin N. Jefferson 7 M B 4/6/1982
McClellan Raymond T Jefferson 4 M W 5/18/1982
Skaggs David Leroy Barren 3 M W 7/13/1982
Marlowe Hugh Harlan 5 M W 7/29/1982
Matthews David Eugene Jefferson 10 M W 11/11/1982
Harper Jr. Edward Lee Jefferson 1 M W 12/6/1982
William Okie
Bevins (Oakie) Greenup 3 M W 4/21/1983
David "Little
Smith Britches" Pike 3 M W 6/1/1983
Ward Douglas Clay 8 M W 7/1/1983*
Halvorsen Leif C. Fayette 7 M W 9/15/1983
Willoughby Mitchell L. Fayette 10 M W 9/15/1983
Leonard Jeffrey Jefferson 7 M B 12/2/1983
Sanborn Parramore Lee Henry 10 M W 3/16/1984
Moore Brian Keith Jefferson 10 M W 11/29/1984
Askew Robert Lee Jefferson 5 M B 1/4/1985
Grooms Fred Lyon 4 M B 2/2/1985
Simmons Beoria A. Jefferson 4 M B 5/14/1985
Tamme Eugene Frank Washington 3 M W 8/8/1985
Dean Roy Wayne Todd 4 M W 10/7/1985
Morris Joseph Edward Harlan 5 M W 1/10/1986
Christopher
Walls Charles Jefferson 4 M W 3/7/1986
27Cosby Teddy Lee Jefferson 4 M B 3/7/1986
Taylor Victor Dewayne Fayette 10 M B 5/23/1986
Epperson Roger Dale Letcher 10 M W 6/20/1986
Hodge Benny Lee Letcher 10 M W 6/20/1986
Thompson Eugene William Lyon 10 M W 10/15/1986
Foster LaFonda Faye Fayette 4 F W 5/11/1987
Sanders David Lee Madison 10 M W 6/5/1987
Clark Michael Dean Fayette 4 M W 10/29/1987
Thomas Alfred Grayson Knott 4 M W 4/29/1988
Wilson Gregory Kenton 10 M B 10/31/1988
Jacobs Clawvern Knott 4 M W 9/6/1989
Smith Robert Allen McCracken 4 M W 7/1/1990*
Bowling Thomas Clyde Fayette 3 M W 1/4/1991
Hunter James D. Clark 4 M W 4/11/1991
Bussell Charles Wayne Christian 4 M B 1/17/1992
Perdue Tommie Russell 4 M W 8/7/1992
Bowling Ronnie L. Laurel 10 M W 12/9/1992
Foley Robert Carl Laurel 10 M W 9/23/1993
Cushman Allen Laurel 3 M W 11/19/1993
Baze Ralph Stephen Rowan 10 M W 2/4/1994
Haight Randy Winton Jefferson 10 M W 3/22/1994
Rogers Ernest Arnaze Christian 8 M B 2/28/1996
Mills John Knox 4 M W 10/18/1996
Fields Samuel Stevens Rowan 10 M W 4/29/1997
Johnson Donald Herb Floyd 10 M W 10/1/1997
Vincent
Stopher Christian Jefferson 10 M W 3/23/1998
Young Gerald Fayette 4 M B 7/15/1998
Woodall Robert Keith Caldwell 10 M W 9/4/1998
St. Clair Michael D. Bullitt 4 M W 9/14/1998
McKinney Gary Casper Pulaski 4 M W 9/24/1998
Osborne Larry Whitley 6 M W 1/27/1999
Garland John Roscoe McCreary 3 M W 2/15/1999
Furnish Fred Kenton 10 M W 7/8/1999
Caudill Virginia Susan Fayette 10 F W 3/24/2000
Johnathon
Goforth Wayne Fayette 10 M W 3/24/2000
Soto Miguel Oldham 4 M H 8/17/2000
Parrish Melvin Lee Jefferson 10 M B 2/1/2001
Wheeler Roger Lamont Jefferson 10 M B 4/27/2001
Chapman Marco Allen Boone 1 M W 12/14/2004
Noble Sherman Louis Jefferson 3 M B 2/7/2005
Hunt James Floyd 10 M W 7/28/2006
28Brown Phillip L. Warren 4 M B 8/21/2006
Meece William Warren 10 M W 11/9/2006
Windsor Shawn Jefferson 10 M W 11/17/2006
Dunlap Kevin Livingston 10 M W 3/19/2010
Ordway Carlos Lamont Fayette 4 M B 10/29/2010
White Larry Lamont Jefferson 10 M B 10/14/2014
Notes: * indicates that the date of the death sentence is an approximation, not an exact date.
Values for Outcomes are as follows: 1 = executed, 2 = suicide, 3 = natural death, 4 =
resentenced: Life, 5 = resentenced: less than life, 6 = exonerated, 7 = commuted, 8 = removed,
unspecified reason, 9 = new trial ordered, removed from death row, outcome of new trial
unknown, 10 = on death row.
29Table A2. Yearly numbers of homicides, executions, and death sentences, 1972–2020.
Year Homicides Executions Sentences
1972 158 0 0
1973 336 0 0
1974 336 0 0
1975 370 0 3
1976 340 0 0
1977 316 0 0
1978 298 0 3
1979 343 0 0
1980 337 0 3
1981 302 0 5
1982 298 0 6
1983 271 0 6
1984 237 0 2
1985 246 0 5
1986 249 0 7
1987 246 0 3
1988 206 0 2
1989 205 0 1
1990 238 0 1
1991 245 0 2
1992 202 0 3
1993 236 0 2
1994 235 0 2
1995 249 0 0
1996 235 0 2
1997 245 1 2
1998 255 0 5
1999 222 1 3
2000 196 0 3
2001 217 0 2
2002 191 0 0
2003 189 0 0
2004 226 0 1
2005 176 0 1
2006 151 0 4
2007 197 0 0
2008 190 1 0
2009 175 0 0
2010 180 0 2
2011 149 0 0
2012 197 0 0
302013 170 0 0
2014 162 0 1
2015 217 0 0
2016 258 0 0
2017 261 0 0
2018 238 0 0
2019 220 0 0
2020 0 0
Homicide numbers are based on CDC values, estimated using FBI numbers after 2004. See
Figure 8 in the text for explanation.
31Table A3. Executions, Death Sentences, and Homicides by County.
Death
Sentences
Executions Executions, per 100
before 1900 to Death Homicide Homicide Homicide Homicide
County 1972 1972 Sentences Executions Incidents Victims Offenders Victims
Jefferson 75 50 19 1 2,576 2,696 2,947 0.70
Fayette 32 22 10 0 693 712 818 1.40
Franklin 6 2 0 0 412 438 500 -
Warren 3 0 2 0 196 207 243 0.97
Christian 19 8 2 0 190 199 226 1.01
Perry 3 3 0 0 163 180 197 -
Pike 4 3 1 0 166 181 185 0.55
Laurel 3 3 3 0 146 158 182 1.90
Kenton 8 6 2 0 151 160 181 1.25
Madison 3 2 2 1 147 160 180 1.25
Harlan 5 4 2 0 150 153 175 1.31
Hardin 6 5 0 0 152 160 175 -
McCracken 10 4 3 0 141 152 161 1.97
Hopkins 5 5 0 0 111 118 139 -
Daviess 6 3 0 0 103 108 133 -
Campbell 9 5 0 0 110 116 125 -
Clay 3 0 1 0 101 109 120 0.92
Bell 6 5 0 0 90 94 104 -
Whitley 2 1 1 0 82 91 100 1.10
Knox 5 2 1 0 80 83 96 1.20
Floyd 2 1 2 0 81 87 90 2.30
Rowan 0 0 3 0 70 76 89 3.95
Adair 4 0 0 0 71 78 83 -
Pulaski 4 2 1 0 67 69 78 1.45
Henderson 11 1 0 0 61 69 70 -
32Boyd 3 2 0 0 60 66 68 -
Graves 4 1 0 0 56 64 68 -
Breathitt 2 1 0 0 63 65 66 -
Leslie 2 1 0 0 61 62 65 -
Boone 2 0 3 1 47 51 64 5.88
Clark 4 4 1 0 46 48 59 2.08
Letcher 2 2 2 0 44 47 58 4.26
Johnson 0 0 0 0 52 53 55 -
Nelson 4 1 0 0 51 55 54 -
Rockcastle 0 0 0 0 46 47 53 -
Logan 2 2 0 0 41 41 47 -
Bullitt 1 1 1 0 41 46 46 2.17
Marion 2 2 0 0 40 41 45 -
Barren 5 2 1 0 43 48 44 2.08
Shelby 2 2 0 0 37 37 41 -
Montgomery 2 1 0 0 36 36 40 -
Boyle 3 1 0 0 28 32 39 -
Lee 0 0 0 0 32 34 39 -
Jessamine 1 0 0 0 36 36 38 -
Calloway 1 1 0 0 32 33 37 -
Oldham 2 1 3 0 33 33 37 9.09
Magoffin 0 0 0 0 34 34 37 -
Muhlenberg 5 2 1 0 32 33 36 3.03
Taylor 1 0 0 0 35 35 36 -
Henry 1 0 1 0 34 34 36 2.94
Knott 0 0 2 0 32 33 35 6.06
McCreary 1 1 1 0 33 37 34 2.70
Wayne 1 0 0 0 31 35 34 -
Lincoln 2 1 0 0 27 27 33 -
Marshall 2 0 0 0 32 37 33 -
Estill 5 2 0 0 26 27 32 -
33Grant 1 1 0 0 24 25 31 -
Simpson 2 0 0 0 28 29 31 -
Caldwell 3 1 1 0 27 27 30 3.70
Breckinridge 8 2 0 0 29 29 30 -
Mercer 2 2 0 0 28 29 30 -
Greenup 12 0 2 0 28 29 30 6.90
Bourbon 9 3 0 0 29 29 29 -
Carter 4 1 0 0 22 23 27 -
Scott 8 3 0 0 25 28 27 -
Hart 1 1 0 0 26 26 26 -
Jackson 0 0 0 0 22 23 25 -
Wolfe 1 0 1 0 25 26 25 3.85
Russell 0 0 1 0 23 23 24 4.35
Grayson 1 0 0 0 22 23 24 -
Casey 1 1 0 0 19 20 23 -
Union 2 0 0 0 16 17 22 -
Powell 1 0 1 0 21 22 22 4.55
Fulton 2 0 0 0 20 21 21 -
Ohio 2 0 0 0 19 22 20 -
Livingston 1 1 1 0 18 18 20 5.56
Meade 3 1 0 0 15 18 20 -
Larue 0 0 0 0 16 16 19 -
Carroll 1 1 0 0 18 20 19 -
Owsley 1 0 0 0 19 19 19 -
Elliott 1 1 0 0 18 18 18 -
Harrison 3 1 0 0 18 18 18 -
Martin 1 1 0 0 15 16 17 -
Woodford 5 1 0 0 17 19 17 -
Morgan 0 0 0 0 15 15 17 -
Lewis 1 0 0 0 13 13 17 -
Trigg 5 0 0 0 16 16 17 -
34Lawrence 3 0 0 0 14 14 16 -
Lyon 3 3 2 0 16 16 16 12.50
Fleming 2 0 0 0 11 12 16 -
Todd 1 1 1 0 15 15 16 6.67
Bath 3 0 0 0 14 14 15 -
Allen 1 0 0 0 15 15 15 -
Mason 7 5 0 0 12 12 14 -
Cumberland 1 0 0 0 11 12 14 -
Washington 1 0 1 0 13 14 14 7.14
Edmonson 0 0 0 0 11 12 14 -
Anderson 0 0 0 0 13 13 13 -
Garrard 7 1 0 0 12 13 12 -
Gallatin 0 0 0 0 10 10 12 -
Clinton 0 0 0 0 11 11 12 -
Metcalfe 0 0 0 0 10 10 11 -
Pendleton 0 0 0 0 11 11 11 -
Webster 0 0 0 0 10 11 11 -
Monroe 1 0 0 0 11 12 11 -
Hickman 1 1 0 0 9 9 10 -
Menifee 0 0 0 0 9 9 10 -
Owen 1 0 0 0 10 10 10 -
Ballard 3 0 0 0 8 8 8 -
Crittenden 1 0 0 0 6 6 8 -
Butler 0 0 0 0 7 7 7 -
Nicholas 0 0 0 0 6 6 6 -
Green 2 0 0 0 6 7 6 -
Spencer 1 0 0 0 5 5 5 -
McLean 0 0 0 0 5 5 5 -
Hancock 2 0 0 0 4 4 4 -
Trimble 0 0 0 0 2 2 4 -
Bracken 4 0 0 0 2 2 2 -
35Robertson 0 0 0 0 2 2 2 -
Carlisle 1 1 0 0 1 1 1 -
Notes: Death Sentences and Executions numbers refer to the period of 1972 to 2020. Homicides numbers refer to the period from
1976 to 2019 (using FBI data). Historical Executions data from Espy and Smykla (2005).
36You can also read