A sheep pangenome reveals the spectrum of structural variations and their effects on tail phenotypes
←
→
Page content transcription
If your browser does not render page correctly, please read the page content below
Downloaded from genome.cshlp.org on December 31, 2023 - Published by Cold Spring Harbor Laboratory Press

Resource

A sheep pangenome reveals the spectrum of structural
variations and their effects on tail phenotypes
Ran Li,1,15 Mian Gong,1,15 Xinmiao Zhang,1,15 Fei Wang,1,15 Zhenyu Liu,1,15
Lei Zhang,1,15 Qimeng Yang,1 Yuan Xu,1 Mengsi Xu,2 Huanhuan Zhang,1
Yunfeng Zhang,2 Xuelei Dai,1 Yuanpeng Gao,1 Zhuangbiao Zhang,1 Wenwen Fang,1
Yuta Yang,1 Weiwei Fu,1 Chunna Cao,1 Peng Yang,2 Zeinab Amiri Ghanatsaman,3
Niloufar Jafarpour Negari,4 Hojjat Asadollahpour Nanaei,5 Xiangpeng Yue,6
Yuxuan Song,1 Xianyong Lan,1 Weidong Deng,7 Xihong Wang,1 Chuanying Pan,1
Ruidong Xiang,8 Eveline M. Ibeagha-Awemu,9 Pat (J.S.) Heslop-Harrison,10
Benjamin D. Rosen,11 Johannes A. Lenstra,12 Shangquan Gan,2,13 and Yu Jiang1,14
1
  Key Laboratory of Animal Genetics, Breeding and Reproduction of Shaanxi Province, College of Animal Science and Technology,
Northwest A&F University, Yangling, Shaanxi 712100, China; 2State Key Laboratory of Sheep Genetic Improvement and Healthy
Production, Xinjiang Academy of Agricultural and Reclamation Sciences, Shihezi, Xinjiang 832000, China; 3Department of Animal
Science, Fars Agricultural and Natural Resources Research and Education Center, Agricultural Research, Education & Extension
Organization (AREEO), Shiraz 7155863511, Iran; 4Department of Animal Science, Shahid Bahonar University of Kerman, Kerman
7616914111, Iran; 5Reproductive Biotechnology Research Center, Avicenna Research Institute, ACECR, Tehran 1983969412, Iran;
6
  State Key Laboratory of Grassland Agro-ecosystems, Key Laboratory of Grassland Livestock Industry Innovation, Ministry of
Agriculture and Rural Affairs, Engineering Research Center of Grassland Industry, Ministry of Education, College of Pastoral Agriculture
Science and Technology, Lanzhou University, Lanzhou 730020, China; 7Faculty of Animal Science and Technology, Yunnan
Agricultural University, Kunming 650201, China; 8Faculty of Veterinary & Agricultural Science, The University of Melbourne, Parkville,
3052 Victoria, Australia; 9Sherbrooke Research and Development Centre, Agriculture and Agri-Food Canada, Sherbrooke, Quebec
J1M 0C8, Canada; 10Department of Genetics and Genome Biology, University of Leicester, Leicester LE1 7RH, United Kingdom;
11
   Animal Genomics and Improvement Laboratory, USDA-ARS, Beltsville, Maryland 20705, USA; 12Faculty of Veterinary
Medicine, Utrecht University, Utrecht 3508 TD, The Netherlands; 13College of Coastal Agricultural Sciences, Guangdong
Ocean University, Zhanjiang 524088, China; 14Key Laboratory of Livestock Biology, Northwest A&F University, Yangling,
Shaanxi 712100, China

        Structural variations (SVs) are a major contributor to genetic diversity and phenotypic variations, but their prevalence and
        functions in domestic animals are largely unexplored. Here we generated high-quality genome assemblies for 15 individuals
        from genetically diverse sheep breeds using Pacific Biosciences (PacBio) high-fidelity sequencing, discovering 130.3 Mb non-
        reference sequences, from which 588 genes were annotated. A total of 149,158 biallelic insertions/deletions, 6531 divergent
        alleles, and 14,707 multiallelic variations with precise breakpoints were discovered. The SV spectrum is characterized by an
        excess of derived insertions compared to deletions (94,422 vs. 33,571), suggesting recent active LINE expansions in sheep.
        Nearly half of the SVs display low to moderate linkage disequilibrium with surrounding single-nucleotide polymorphisms
        (SNPs) and most SVs cannot be tagged by SNP probes from the widely used ovine 50K SNP chip. We identified 865 pop-
        ulation-stratified SVs including 122 SVs possibly derived in the domestication process among 690 individuals from sheep
        breeds worldwide. A novel 168-bp insertion in the 5′ untranslated region (5′ UTR) of HOXB13 is found at high frequency
        in long-tailed sheep. Further genome-wide association study and gene expression analyses suggest that this mutation is caus-
        ative for the long-tail trait. In summary, we have developed a panel of high-quality de novo assemblies and present a catalog
        of structural variations in sheep. Our data capture abundant candidate functional variations that were previously unex-
        plored and provide a fundamental resource for understanding trait biology in sheep.
        [Supplemental material is available for this article.]

15
   These authors contributed equally to this work.
Corresponding authors: yu.jiang@nwafu.edu.cn,
shangquangan@gdou.edu.cn
Article published online before print. Article, supplemental material, and publi-   © 2023 Li et al. This article, published in Genome Research, is available under a
cation date are at https://www.genome.org/cgi/doi/10.1101/gr.277372.122.            Creative Commons License (Attribution-NonCommercial 4.0 International), as
Freely available online through the Genome Research Open Access option.             described at http://creativecommons.org/licenses/by-nc/4.0/.

33:1–15 Published by Cold Spring Harbor Laboratory Press; ISSN 1088-9051/23; www.genome.org                                        Genome Research                1
                                                                                                                                      www.genome.org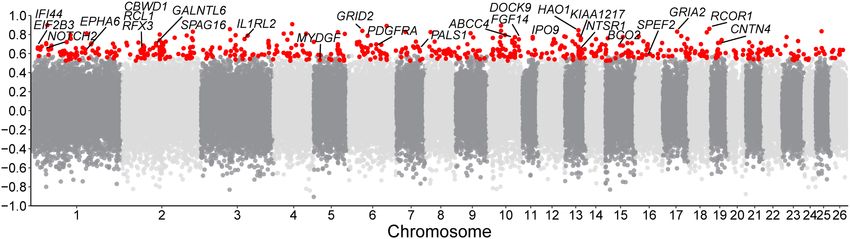
Downloaded from genome.cshlp.org on December 31, 2023 - Published by Cold Spring Harbor Laboratory Press

Li et al.

Structural variations (SVs) are large genomic alterations of at least    mon SNPs (minor allele frequency [MAF] > 0.05) among 649 do-
50 bp. They are expected to induce larger-scale genomic perturba-        mestic sheep (Supplemental Fig. S1) used in this study. The 15
tions in genes and regulatory regions than single-nucleotide poly-       sheep were sequenced using PacBio HiFi sequencing at an average
morphisms (SNPs) with impact on gene expression and phenotype            coverage of 20.9× (Table 1; Supplemental Table S2), yielding high-
(Sudmant et al. 2015; Chiang et al. 2017). The spectrum of SVs has       ly accurate long reads with average read length of 13.9 kb and per-
been extensively studied in the human genome in recent years,            base accuracy >99.9%. We used the hifiasm assembler (Cheng et al.
serving as a critical genetic resource for biomedical research and       2021) for de novo assembly, which could generate one primary as-
precision medicine (Almarri et al. 2020; Collins et al. 2020;            sembly as well as a pair of partially phased contig assemblies. The
Beyter et al. 2021; Ebert et al. 2021; Sirén et al. 2021; Wu et al.      15 primary assemblies were further anchored to chromosomal lev-
2021). However, despite being a major source of genetic diversity        el as described below to serve as a reference panel for each breed,
(Mao et al. 2021; Leonard et al. 2022), SVs with a combination           whereas the partially phased assemblies were used for pangenome
of long-read and short-read sequencing remain largely unexplored         construction and SV detection.
in most mammalian species including sheep.                                     We further ordered and arranged ∼93.6% of the contigs from
       Comprehensive characterization of SVs has been hindered by        each primary assembly into chromosomes based on their synteny
technical limitations in accurate detection and genotyping (Ebler        to the reference genome (ARS-UI_Ramb_v2.0). The length of
et al. 2022), which are now being eliminated by recent advances          the 15 primary assemblies is 2.87 Gb on average, which is closer
in sequencing technologies and computational algorithms.                 to the estimated sheep genome size (2.84 to 3.10 Gb)
Whereas the Pacific Biosciences (PacBio) Continuous Long Read            (Supplemental Fig. S2; Supplemental Table S3). Most of the chro-
(CLR) Mode and Nanopore long reads suffer a sequencing error             mosomes are longer than their counterparts in the reference ge-
rate of 5%–15% (Audano et al. 2019; Alonge et al. 2020; Liu et al.       nome with a larger content of satellite sequences (Fig. 1B,C).
2020; Beyter et al. 2021; Qin et al. 2021), the latest PacBio circular   Each assembly further possesses 135–257 Mb of the unplaced con-
consensus long-read sequencing (CCS) delivers high-fidelity (HiFi)       tigs that are dominated by satellite sequences (Fig. 1B) and the ma-
reads of 15 to 25 kb with >99.9% base accuracy (De Coster and Van        jority (84.0% on average) were annotated as centromeric
Broeckhoven 2019; Wenger et al. 2019). This not only enables             sequences (Supplemental Table S4).
high-quality de novo assemblies but also empowers the resolution               Thirteen of the 15 primary assemblies harbor fewer than 100
of SV breakpoints and sequence content with unprecedented pre-           gaps in chromosomes (Supplemental Table S2) and the most con-
cision and accuracy (Cheng et al. 2021; Ebert et al. 2021).              tinuous assemblies (FRI1 and DOR1) only have 28 and 35 gaps, re-
Furthermore, breakthroughs in pangenome-based genome infer-              spectively. Using whole-genome alignments where our new
ence have largely addressed previous challenges in the discovery         assemblies have non-N’s sequences covering the gap region, these
of diverse SV types including multiallelic complex variations            assemblies combined filled 82.1% (69/84) of the gaps in the refer-
(Crysnanto et al. 2021; Leonard et al. 2022). By integrating SVs         ence genome (Fig. 1D). The average contig number is 1513 with a
and reference genome, the pangenome graph approach can partic-           contig N50 length of 68.8 Mb. All assemblies except WDU1 have a
ularly improve SV genotyping accuracy of short-read data (Chen           comparable or better continuity than the reference genome (Fig.
et al. 2019; Ebler et al. 2022). In this way, the population frequency   1E). Particularly, FRI1 and DOR1 achieve contig N50 values of
of otherwise inaccessible variants can be inferred in large popula-      85.1 and 92.4 Mb, which are much longer than that of the sheep
tions made up of thousands of individuals (Sirén et al. 2021).           reference genome (ARS-UI_Ramb_v2.0, 43.2 Mb). The HiFi se-
       Sheep is among the first domesticated livestock with econom-      quencing depth is correlated positively with contig N50 (rs =
ic and cultural importance. Previous studies have implicated SVs in      0.88) and negatively with contig number (rs = −0.62), but no effect
characteristics that have been under selection for millennia in          on assembly length (rs = −0.04) was observed. In addition, the par-
sheep, including white coat color (Norris and Whan 2008), fleece         tially phased assemblies achieved a median contig N50 of 10.3 Mb,
variations (Demars et al. 2017), and polledness (Wiedemar and            containing the haplotype-resolved alleles for each individual.
Drögemüller 2015). Nevertheless, the SV spectrum of sheep re-                  A benchmarking universal single-copy orthologs (BUSCO)
mains to be explored across populations. In this study, we take ad-      analysis shows that all assemblies except WDU1 displayed a com-
vantage of the PacBio HiFi sequencing technology to generate a           pleteness that is comparable with the reference genome (Table 1;
diverse panel of 15 reference-quality sheep genomes and an exten-        Fig. 1F). BUSCO scores for the partially phased assemblies were
sive catalog of sequence-resolved SVs. We construct the first ovine      lower but still consistently >90% complete (Table 1;
pangenome and, through analysis of the SV spectrum in short se-          Supplemental Table S2). The quality value (QV) of the assemblies
quence reads of 649 domestic and 41 wild sheep (Supplemental             was measured using Illumina short reads sequenced to 24× on av-
Table S1), highlight SVs as so far largely unexplored contributors       erage (Table 1), which showed higher values for all the primary and
to variations in phenotypes.                                             phased assemblies than obtained for the reference genome (QV =
                                                                         42.5), except for WDU1 (QV = 41.7).

Results
                                                                         SV discovery from PacBio HiFi reads and the ovine
High-quality de novo assemblies of 15 individuals from                   genome graph
different breeds                                                         The SVs from the 15 individuals are discovered by leveraging
We selected 15 genetically diverse individuals, including eight          PacBio HiFi reads and a genome graph constructed from partially
European (Suffolk, Dorset, Texel, Charollais, Merino, Romney,            phased contig assemblies (see Methods). In total, we detected
East Friesian, and Romanov), five East Asian (Ujumqin, Qiaoke,           149,158 biallelic insertions/deletions (Supplemental Table S5;
Yunnan, Waggir, and Kazakh), one Middle Eastern (Kermani),               Supplemental Data) and abundant complex variations including
and one African (White Dorper) sheep (Fig. 1A). SNP analysis             6531 divergent alleles (Supplemental Table S6) and 14,707 multi-
showed that the 15 individuals encompass ∼87.1% of the com-              allelic variations (Supplemental Table S7; Fig. 2A). In particular,

2    Genome Research
       www.genome.org
Downloaded from genome.cshlp.org on December 31, 2023 - Published by Cold Spring Harbor Laboratory Press

                                                                                                                           Ovine pangenome study

   A                                                       B

                                                                                                                             ce
                                                                                                                           en
                                                                                                                         er
                                                                                                                        ef
   C

                                                                                                                       R
                                                                                                                D

    E                                                     F

Figure 1. Quality assessment of 15 de novo assemblies produced by HiFi sequencing. (A) PCA plot showing the representation of the genetic diversity of
domestic sheep by the 15 samples used for HiFi sequencing. The African Dorper sheep cluster with the European breeds as this breed is developed by cross-
ing European Dorset Horn with the African Blackhead Persian sheep, resulting in its close genetic relationship with European breeds. (B) Repeat content of
the 15 de novo assemblies. (C) The difference in chromosome length between the 15 new assemblies and the reference genome (REF, ARS-UI_Ram_v2.0).
(D) Number of filled gaps by the different assemblies. (E) Cumulative length of contigs (Nx). In the x-axis, 50% measures the N50 across the new assemblies.
HiFi sequencing depth for each assembly is shown with the dashed line referring to the reference genome. Assemblies with higher Nx values are more
contiguous. (F) BUSCO completeness for the 15 new assemblies.

the complex variations are inferred only from the genome graph                  cluster (Fig. 2C). The IFN gene clusters are key modulators of innate
constructed by the graph constructor minigraph (see Methods),                   and adaptive immunity (Wittling et al. 2021).
which is efficient in detecting complex variations (Leonard et al.                   As there is no “truth-set” to benchmark SV calls in sheep, we
2022). Despite the lower contig N50 of WDU1, we did not find                    manually inspected 250 randomly selected SVs of different lengths
clear differences in the number or length distribution of detected              to estimate the validation rate of detected SVs (see Methods). The
SVs between WDU1 and other individuals (Supplemental Fig.                       overall validation rate was 94% (Supplemental Table S8). The accu-
S3). The SVs contributed 130.3 Mb of nonreference sequences in                  racy of detected SVs was also estimated by measuring the
total that were dominated by TE repeats (72.5%). The insertion se-              Mendelian inheritance errors, which represent genotypes that
quences were predicted to harbor 588 genes, whereas the deletions               are found in the offspring but could not be inherited from either
potentially affected the exons of 1920 genes. The nonreference se-              parent. The biallelic SVs were genotyped in 11 trios of 29 individ-
quences of the divergent alleles contain 31 genes. Among the                    uals (average ∼18.9× of Illumina short reads) using Paragraph
divergent alleles, we revealed the full sequence of one divergent lo-           (Chen et al. 2019), by which 95.4% (1,609,529) of all the SVs
cus containing myeloid-associated differentiation marker                        can be genotyped. The average Mendelian error rate of 3.8% indi-
(MYADM) for the first time (Fig. 2B). The MYADM locus was previ-                cates a reasonable FDR based on Mendelian consistency for our SV
ously reported to be associated with mean corpuscular hemoglo-                  detection and genotyping approach.
bin concentration and weight of lamb weaned but the sequence                         On average, 56,668 biallelic SVs were detected in each indi-
was unknown (Gonzalez et al. 2013). Among the multiallelic var-                 vidual (Fig. 2D). The shared (present in all samples) or major (pre-
iations, we identified one region affecting interferon (IFN) gene               sent in ≥50% of samples but not all) accounted for 63.7%,

                                                                                                                              Genome Research             3
                                                                                                                                  www.genome.org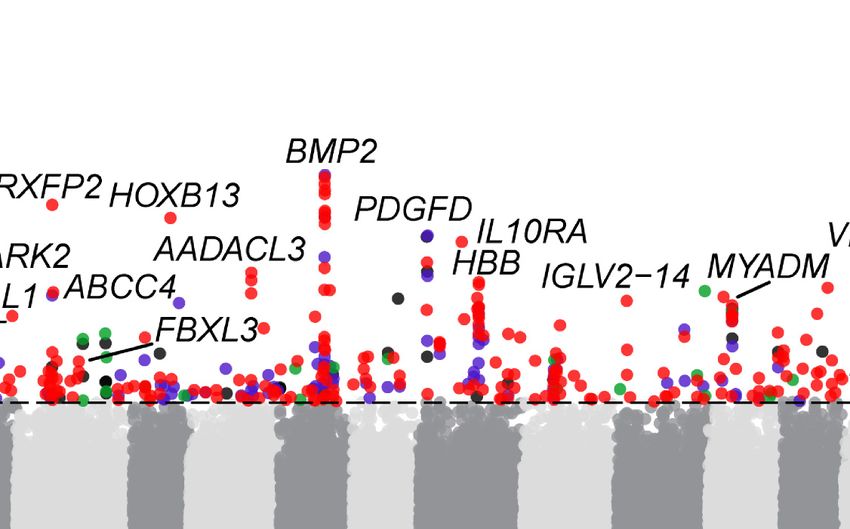
Downloaded from genome.cshlp.org on December 31, 2023 - Published by Cold Spring Harbor Laboratory Press

Li et al.

Table 1. Quality assessments of the primary de novo assemblies for each individual and the reference genome (ARS-UI_Ramb_v2.0)

                                     Assembly      Assembly length      Contig N50        HiFi sequencing        BUSCO        Base accuracy
Abbr.                 Breeds           type             (Gb)              (Mb)               depth (×)            (%)             (QV)

FRI1               East Friesian   Primary             2.90             85.1                    28.0            94.4             48.2
                                   hap1/hap2           2.77/2.75        62.9/53.2                               91.3/92.8        48.4/48.5
DOR1               Polled Dorset   Primary             2.91             92.4                    25.0            94.3             45.5
                                   hap1/hap2           2.86/2.83        32.8/39.5                               93.4/92.7        45.6/45.6
CHA1               Charollais      Primary             2.86             71.5                    19.2            94.1             44.1
                                   hap1/hap2           2.82/2.80         6.4/5.1                                91.7/92.1        44.3/44.3
ROM1               Romney          Primary             2.86             68.3                    19.3            94.4             43.2
                                   hap1/hap2           2.81/2.82         6.3/5.7                                92.1/92.4        43.3/43.1
SFK1               Suffolk         Primary             2.88             65.3                    18.8            94.3             43.4
                                   hap1/hap2           2.86/2.80         5.7/4.9                                92.4/92.5        43.2/43.3
TEX1               Texel           Primary             2.82             47.6                    17.9            94.4             44.6
                                   hap1/hap2           2.76/2.75         4.52/4.49                              91.4/90.2        44.8/44.8
WDU1               White Dorper    Primary             2.81             17.8                    15.4            93.8             41.7
                                   hap1/hap2           2.82/2.77         1.58/1.26                              90.2/89.8        41.9/41.8
MER1               Chinese         Primary             2.84             60.0                    18.7            94.2             43.3
                     Merino        hap1/hap2           2.82/2.83         3.7/4.8                                92.1/90.0        43.4/43.3
RMV1               Romanov         Primary             2.94             71.7                    20.2            94.3             49.3
                                   hap1/hap2           2.83/2.92         6.6/5.2                                93.0/93.2        48.6/48.8
KER1               Kermani         Primary             2.82             80.3                    21.7            93.8             45.2
                                   hap1/hap2           2.77/2.75        15.4/15.2                               90.7/92.2        45.4/45.6
WAG1               Waggir          Primary             2.94             73.6                    22.3            94.4             47.3
                                   hap1/hap2           2.83/2.92        11.8/16.9                               93.9/93.7        47.1/47.0
KAZ1               Kazak           Primary             2.87             73.4                    22.4            93.4             46.3
                                   hap1/hap2           2.85/2.84        10.7/13.9                               92.3/91.9        46.6/46.4
UJM1               Ujimqin         Primary             2.87             75.6                    21.3            94.4             44.4
                                   hap1/hap2           2.86/2.84        11.5/11.7                               93.9/93.5        44.5/44.6
QK1                Qiaoke          Primary             2.87             75.0                    21.5            94.0             47.1
                                   hap1/hap2           2.83/2.84        13.6/9.9                                92.6/93.4        47.6/47.2
YUN1               Yunnan          Primary             2.91             73.9                    22.0            94.1             46.9
                                   hap1/hap2           2.89/2.85        18.7/13.1                               93.6/93.4        46.7/46.6
ARS-               Rambouillet     Primary             2.63             43.2                     –              93.9             42.5
  UI_Ramb_v2.0

indicating that the current reference genome either carries a minor     average) and 9815 (95.1%) of them were entirely within SD regions,
allele or an assembly error at these loci. In contrast, the polymor-    suggesting that SDs are a major driver of SVs in sheep as has been
phic SVs and singletons account for 32.5% and 3.8%, respectively.       observed in other species (Bretani et al. 2020; Ebert et al. 2021).
The growth of the nonredundant set declined quickly at first and
flattened when ∼10 individuals are added (Fig. 2E), which implied
that a large proportion of common variants were captured by our         Inference and characterization of SVs representing a derived state
subset of 15 sheep. The number of SVs rapidly decreases with            in sheep
length, consistent with reports in humans using long-read se-           The ancestral state of a variant is critical in population genetic
quencing (Audano et al. 2019; Ebert et al. 2021; Quan et al.            studies as it reflects the direction of change in an evolutionary con-
2021). Noticeable peaks at 150 bp corresponded to short inter-          text. The takin and goat genomes were used as outgroups for
spersed elements (SINEs), at 1300 bp to long terminal repeats           whole-genome alignments. The ancestral state of each SV was de-
(LTRs), and at 7750 bp to long interspersed nuclear elements            termined by estimating the size of the region in outgroups that was
(LINEs) (Fig. 2F; Supplemental Fig. S4). The median lengths of          homologous to the region that encompassed the ovine SV (Fig.
divergent alleles (726 bp) and multiallelic loci (575 bp) were longer   3A). The variant state that was the same as the two outgroups
than that of biallelic variations (230 bp).                             was assigned as ancestral state whereas the derived-state SVs were
      As expected, the SVs are underrepresented in untranslated re-     referred to as “dSVs” as proposed by a previous study (Qin et al.
gions (UTRs), coding sequences (CDSs), and regulatory elements          2021). The ratio of SVs’ aligned length in takin or goat to length
(H3K4me3, H3K27ac), suggesting the effect of negative selection         in sheep displayed two clear peaks at 0 and 1 (Supplemental Fig.
(Supplemental Fig. S5). We also found 201 SV hotspots covering          S9), corresponding to derived insertions and deletions,
182 Mb of the autosomes with enrichment in repetitive sequences         respectively.
(Supplemental Fig. S6). The SVs were 4.1-fold overrepresented (per-           The inferred dSVs included 94,422 insertions, 33,571 dele-
mutation test, P-value < 0.01) at the terminal 5 Mb region of each      tions, and 8208 putative ancestral polymorphisms (Fig. 3A). The
chromosome (Supplemental Fig. S7), which agrees with a previous         ratio of insertions/deletions was 2.81, suggesting that insertion
study in humans (Audano et al. 2019). Furthermore, we found a           events likely represent the major contributor to the ovine SV spec-
2.19-fold overrepresentation (permutation test, P-value < 0.01) of      trum. To ensure that this is not due to reference bias, we used one
SVs in a total of 80.9 Mb (∼3.09% of the whole genome) segmental        of our most continuous assemblies FRI1 as reference and called SVs
duplications (SDs), which contain 10,322 accounting for 11.4 Mb         from HiFi reads of SFK1 and still obtained much greater number of
of structurally variant bases in SDs (Supplemental Fig. S8;             insertions than deletions (insertions/deletions: 2.46), indicating
Supplemental Tables S9, S10). The overlapped SVs (1356 bp on av-        that the ovine genome indeed retained more insertions than dele-
erage) were generally shorter than the overlapped SDs (11,693 bp on     tions. The insertions were dominated by LINE-1 which only

4      Genome Research
        www.genome.org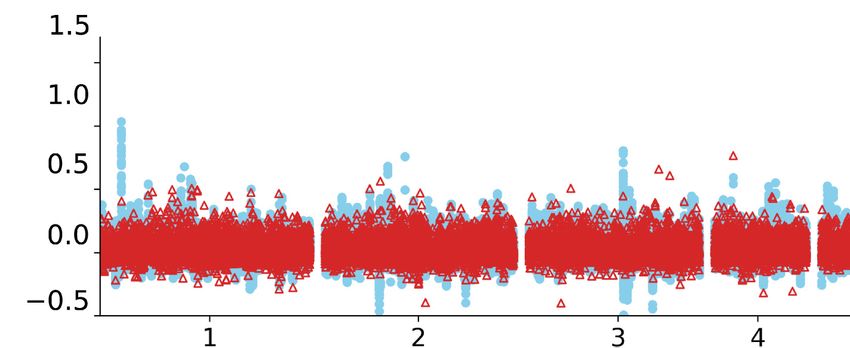
Downloaded from genome.cshlp.org on December 31, 2023 - Published by Cold Spring Harbor Laboratory Press

                                                                                                                          Ovine pangenome study

  A                                                              B                                           C

   D                                                 E                                                F

Figure 2. Structural variation discovery in sheep. (A) Illustration and number of different SV types. The red lines indicate the reference sequence and the
blue lines represent the nonreference sequence. (B) An example of a divergent allele of 50,757 bp containing a MYADM gene. (C) An example of a multi-
allelic variation. (D) The number of SVs per sample. (E) Pangenome growth curve generated by integrating SVs from each individual. Variants were merged
starting with FRI1 followed by iteratively adding unique calls from additional samples. (F) Length distribution of different types of SVs.

occupied 12.8% of the whole sheep genome but accounted                          from the widely used ovine 50K SNP chip, suggesting that most
for 78% of the insertions (Fig. 3B), indicating a recent LINE                   of the SVs could not be tagged by the SNP chip.
expansion in sheep. We further analyzed the sequence divergence                       We found that when MAF was low (0.5 in domestic sheep, im-               (VNTR, STR, and Satellite) decreased from 16.0% to 1.0%, whereas
plying that they are favored by adaptation or artificial selection              the proportion of LINE increased from 51.9% to 76.0%.
(Supplemental Table S12). However, it should be noted that
domestication-associated SVs could also be due to genetic drift in
domestication.                                                                  Selection signatures of SVs in domestic sheep on the basis
      We further investigated how frequently the SVs were linked                of a variant-integrated ovine pangenome
to nearby SNPs, seeking to estimate the extent of previously un-                To expand our knowledge of SVs to the population scale, we ex-
covered genetic variations. When using genome-wide SNP data,                    plored selection signatures of SVs among 45 breeds or popula-
59.4% of SVs showed a high linkage disequilibrium (LD) with near-               tions based on their SV frequency (Supplemental Table S13).
by SNPs (r 2 > 0.8) whereas the rest were of moderate or low LD with            The studied breeds/populations included 649 individual domes-
nearby SNPs (Fig. 3F), suggesting the presence of hidden genetic                tic sheep from Europe, East Asia, Middle East, and Africa, 33
variations that cannot be captured by SNPs. Furthermore, 77.6%                  Asiatic mouflons and 8 argali with an average coverage of 18.1×
of the SVs displayed very low LD (r 2 < 0.2) with the SNP probes                (Fig. 5A, see Methods for the assignment of the breeds and

                                                                                                                            Genome Research              5
                                                                                                                               www.genome.org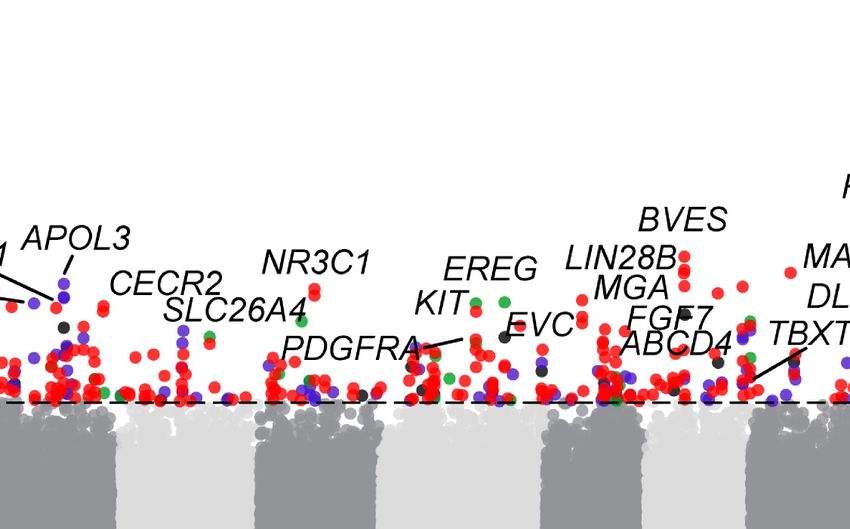
Downloaded from genome.cshlp.org on December 31, 2023 - Published by Cold Spring Harbor Laboratory Press

Li et al.

                  A                                                              B

                  C                                                              D

                  E                                                               F

Figure 3. Inference of derived state for SVs using takin and goat as outgroups. (A) Each SV is assigned to a derived state of either derived insertion, derived
deletion, ancestral polymorphism, or indeterminate based on their presence (“1”) and absence (“0”) status in outgroup. (B) Repeat annotation in three
types of dSVs. (C) Sequence divergence rate (%) of TE repeats within SV sequences. (D) Sequence divergence rate (%) of TE repeats in non-SV genomic
regions. (E) dSV allele frequency spectrum. (F) Linkage analysis between SVs and nearby SNPs of whole genome (±50 kb) and ovine 50K SNP chip (±500
kb). Those SVs with MAF > 0.01 were used for linkage analysis.

populations). PCA using SVs shows a clear separation of the same                  the most differentiated SVs between wild and domestic popula-
clusters as defined by SNPs (Supplemental Fig. S13), suggesting                   tions to reduce false positives. In this way, we identified 622 SVs
that the SV catalog reproduces the genetic diversity of the studied               putatively under selection during domestication (Supplemental
populations.                                                                      Table S14). A KEGG analysis of the 459 genes within 100 kb of
      To detect SVs that are differentiated between domestics and                 SVs showed significant enrichment in pathways related to immu-
Asiatic mouflons, we applied at each locus two differentiation in-                nity (hepatitis B, human cytomegalovirus infection, Chagas dis-
dexes: DISV, which reflects the difference in derived allele frequen-             ease, etc.) and nervous system functions (long-term depression,
cies between populations (Cumer et al. 2021) and FST (FST-SV). The                dopaminergic synapse, neuroactive ligand-receptor interaction,
FST-SV can identify differentiated locus, but cannot indicate the di-             etc.) (Supplemental Table S15).
rection of selection. The DISV between domestics and wild mou-                          We further evaluated whether SNPs surrounding differentiat-
flons was calculated based on derived allele frequency, allowing                  ed SVs were also differentiated using FST by SNPs (FST-SNP) in 5-kb
us to infer SVs that were under selection in domestic sheep. The in-              window. The mean FST-SNPs around SVs were significantly higher
tersection of 1% signals of both DISV and FST-SV were considered as               than neutral SVs (Wilcoxon rank-sum test, P-value < 1 × 10⁻¹⁰).

6    Genome Research
        www.genome.org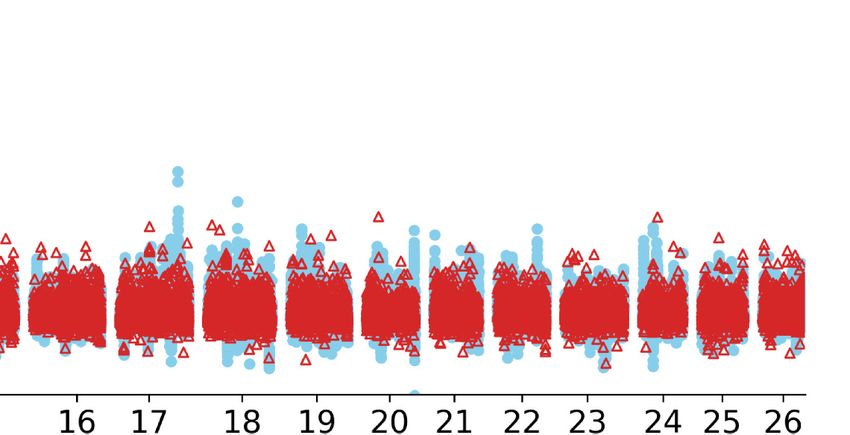
Downloaded from genome.cshlp.org on December 31, 2023 - Published by Cold Spring Harbor Laboratory Press

                                                                                                                         Ovine pangenome study

      A

      B

Figure 4. The distribution of LD (r 2) between SVs and nearby SNPs in domestic sheep, with different MAF ranges for SVs. (A) Density distribution of LD
between SVs and nearby SNPs. (B) Contour density plots of LD between SVs and nearby SNPs. For each SV, the maximum r 2 with nearby SNPs (±50 kb) on
either side together with their physical distance is recorded. The Mann–Whitney U test was used to determine the difference in SV density between standing
SVs and domestication-associated (Dom-associated) SVs. Blue lines: standing SVs that are present in mouflons; red lines: domestication-associated SVs.

However, the surrounding FST-SNPs of most differentiated SVs                   parasitic disease (African trypanosomiasis, amoebiasis) (Supple-
(612, 98.39%) were below the 90th quantile (0.58) of the FST-                  mental Fig. S15).
SNP distributions (Fig. 5B), indicating that these SVs would prob-                   Of the population-stratified SVs, 122 were domestication de-
ably be missed by traditional SNP-based studies. One of the plausi-            rived including 73 insertions and 49 deletions which could be key
ble SVs associated with domestication is a 1.4-kb insertion in the             candidate variations affecting domestication and breed improve-
downstream from GRIA2, of which the surrounding FST-SNPs is                    ment. The highest signals are associated with five genes
0.27 (Supplemental Fig. S14). GRIA2 is a neurotransmitter in the               (IRF2BP2, BMP2, RXFP2, HOXB13, and PDGFD) (Fig. 5E) with roles
vertebrate central nervous system and has been implicated in ani-              in sheep morphology. The stratified dSV of IRF2BP2 is a 1.4-kb
mal domestication (O’Rourke and Boeckx 2020).                                  domestication-associated insertion downstream from this gene
      After the initial domestication event at the Fertile Crescent,           (Fig. 5F), which is reported to affect fleece variation (Demars
domestic sheep dispersed worldwide and adapted to a wide range                 et al. 2017). For RXFP2, the dSV is a 1.8-kb domestication-associat-
of natural and artificial selection conditions. In this context, we            ed insertion associated with polledness (Fig. 5G; Wiedemar and
detected putative selection signals by searching for population-               Drögemüller 2015). BMP2 and PDGFD are reported to be associated
stratified SVs among the 45 sheep populations using a modified                 with tail fat deposition in sheep (Pan et al. 2019; Li et al. 2020b;
global FST differentiation coefficient (Fig. 5C, see Methods).                 Kalds et al. 2021), whereas HOXB13 is critical in regulating verte-
Because this strategy tends to discover common selection signals               brate tail bud development (Denans et al. 2015). However, SVs as-
present in multiple breeds, this preferentially detected the popula-           sociated with tail morphology have not been reported.
tion-stratified SVs differentiating the overrepresented European
and East Asian breeds. We identified 929 population-stratified
SVs with the top 1% global FST values (Fig. 5D; Supplemental Table             SVs as strong candidates for affecting sheep tail morphology
S16), of which 352 intersect with genic regions and another 342                Tail morphology of sheep is a key genetic trait that is relevant for
are within the 100-kb flanking regions of genes. The majority                  domestication, adaptation, productivity, and animal welfare
(725, 78.0%) were confirmed by the Ohana approach (Cheng                       (Kalds et al. 2021). The Asiatic mouflon has a short thin tail, where-
et al. 2022), which is based on differences in allele frequencies be-          as four domestic sheep tail types include, in addition to the prim-
tween inferred ancestral components. The genes of the stratified               itive type, the long thin-tailed, the short fat-tailed (including fat-
SVs are associated with diverse phenotypic traits, including wool              rumped), and the long fat-tailed types. Although several genes
type (IRF2BP2, FGF7) (Zhu et al. 2014; Demars et al. 2017), horn               have been associated with these traits (Moioli et al. 2015; Xu
type (RXFP2) (Kardos et al. 2015), fat deposition (BMP2, PDGFD,                et al. 2017; Li et al. 2020b), the underlying causative mutations
PDGFA) (Pan et al. 2019; Li et al. 2020b), and coat color (KIT,                are still unknown.
MITF) (Nishikawa et al. 1991), etc. Functional annotation of the                     We compared SVs in the long (Asian long fat-tailed and
top FST signals reveals enrichment in several KEGG pathways,                   European long thin-tailed) with those in short-tailed (Asian short
such as those involved in signaling pathways (Rap1, MAPK) and                  fat-tailed and North European short thin-tailed) breeds within the

                                                                                                                            Genome Research             7
                                                                                                                              www.genome.org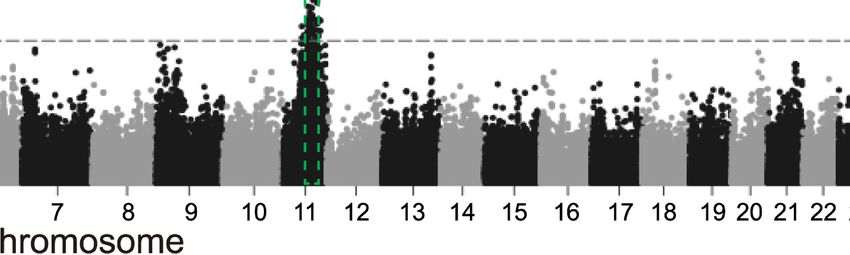
Downloaded from genome.cshlp.org on December 31, 2023 - Published by Cold Spring Harbor Laboratory Press
Li et al.
A B
DISV
C E
D
F G
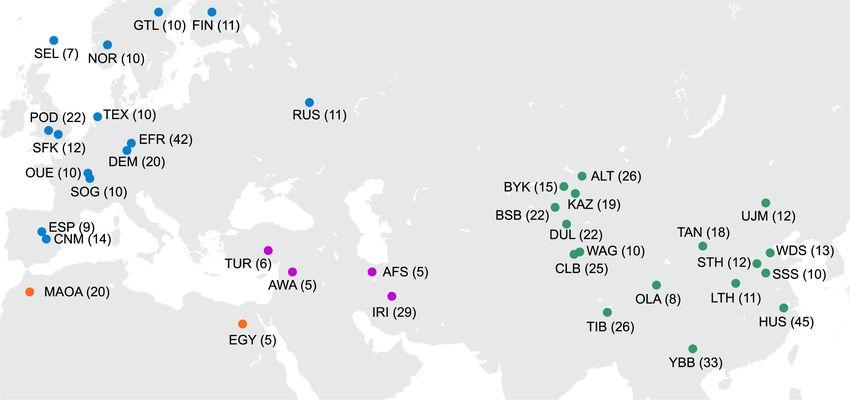
Figure 5. Selection signatures of SVs in domestic sheep. (A) DISV variations along the sheep genome. DISV is calculated as the derived allele frequency
difference between domestic sheep and Asiatic mouflons. The top selected SVs belong to the top 1% signals from both DISV and FST-SV. (B)
Distribution of the mean FST of the SNPs (FST-SNP) surrounding selected SVs as compared with all SVs in 5-kb window. The dotted line indicates the
top 1% cutoff of FST-SNP distributions. (C) Geographical distribution of the 45 breeds/populations (for the breed codes, see Supplemental Table S1).
The Dorper sheep from South Africa and the white Suffolk from Australia are not shown. (D) Genome-wide distribution of global FST for each SV across
assigned breeds/populations. (E) The most stratified dSVs correspond to five genes associated with sheep morphology. (F ) A 1.4-kb domestication-asso-
ciated insertion downstream from IRF2BP2. (G) A 1.8-kb domestication-associated insertion downstream from RXFP2.
649 domestic sheep (Supplemental Table S1) using the population poly(A) sequence at the 3′ end (Supplemental Fig. S16). HOXB13
branch statistic (PBS), which is an FST-based three-population test is a key regulator of caudal vertebra development. Its overexpres-
(Yi et al. 2010) with wild mouflons as an outgroup. The most sig- sion correlates with reduced elongation velocity in tail buds
nificant variation pointed to an ∼168-bp insertion (Chr 11: (Denans et al. 2015), whereas its repression causes extension of
37,525,005) adjacent to the annotated 5′ UTR of HOXB13 (Fig. caudal vertebra (Economides et al. 2003; Aires et al. 2019). We
6A). The insertion is annotated as a SINE element with varying measured the tail length of 201 individuals from an East Friesian
8 Genome Research
www.genome.org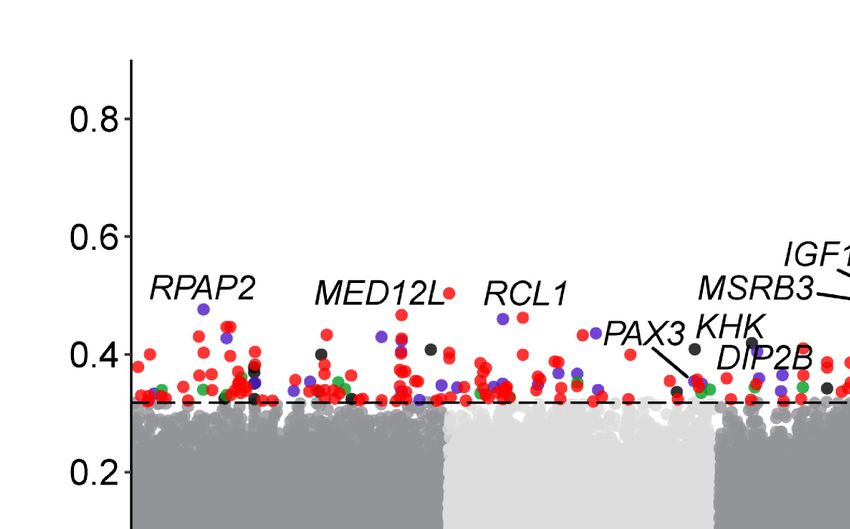
Downloaded from genome.cshlp.org on December 31, 2023 - Published by Cold Spring Harbor Laboratory Press

                                                                                                                               Ovine pangenome study

          A

          B

          C                                                                                  D

           E                               F                                                     G                        H

Figure 6. Selective SVs associated with the long-tail trait. (A) Population branch statistic (PBS) values of long fat-tailed versus short fat-tailed sheep breeds
based on dSVs and SNPs. The PBS value was calculated for SNPs using a 10-kb window size and a 5-kb step size. (B) GWAS of tail length in an East Friesian ×
(Hu sheep × East Friesian) hybrid population (n = 201) using a 40K SNP chip. The dotted line indicates the threshold of genome-wide significance. (C) The
frequency of insertion in each breed is shown as orange in the pie chart. For the breed codes, see Supplemental Table S1. (D) The regions surrounding the
insertion are highly conserved in ruminants except in sheep. (E) The carriers and noncarriers of the insertion differ in tail length. (F ) RNA-seq data show the
expression of the insertion in long-tailed individuals. The sequencing coverage from two RNA-seq data sets of ovine colons are shown. (G) A dual luciferase
assay and a quantitative luciferase assay were used to measure the luciferase protein accumulation. The luciferase activity was measured by dual luciferase
reporter assay and presented as relative LUC (firefly/Renilla luciferase). (H) Real-time PCR was used to measure the relative mRNA expression of firefly lu-
ciferase. Each experiment was repeated at least three times. Student’s t-test was used to determine significance in E, G, and H. (∗∗∗∗ ) P < 0.0001.

× (Hu sheep × East Friesian) hybrid population and performed a ge-                 taining cytomegalovirus (CMV) promoter followed by the 168-
nome-wide association study (GWAS) using a 40K SNP chip (see                       bp insertion sequence and firefly luciferase. A dual luciferase assay
Methods) and found that the regions surrounding the 168-bp in-                     and a quantitative luciferase assay indicated that the insertion led
sertion are clearly associated with tail length (Fig. 6B). The inser-              to a 215-fold decrease in the luciferase protein accumulation (Fig.
tion is prevalent in long-tailed breeds worldwide but rare in                      6G), whereas the mRNA transcription expression decreased 29-
short-tailed breeds (Fig. 6C). Meanwhile, the region surrounding                   fold (Fig. 6H). The reduction rate of transcription was not sufficient
the insertion is highly conserved in ruminants except in sheep                     to account for the decreased luciferase expression, implying that
(Fig. 6D). This observation agrees with the short-tail status of the               the insertion greatly hinders protein translation.
Caprini species. The tails of individuals homozygous for the inser-                      To identify candidate SVs related to the fat-tail trait, we com-
tion were found to be significantly longer than tails of the hetero-               pared the genomes of eight fat-tail breeds (SFK, KAZ, HUS, UJM,
zygotes by 2.77 cm on average (Mann–Whitney U test, P-value <                      LTH, TAN, BSB, and SSS) and ten thin-tail breeds (FIN, DEM,
0.0001) (Fig. 6E). Furthermore, the insertion was found to be ex-                  EFR, GTL, SEL, SFK, SOG, POD, TIB, and YBB) using PBS to identify
pressed in RNA-seq data of colons (Clark et al. 2017), suggesting                  positive selection in fat-tail sheep with Asiatic mouflon as an out-
that it belongs to the 5′ UTR (Fig. 6F; Supplemental Fig. S17). To                 group. Two regions with the highest differentiation of either dSVs
evaluate the translational efficiency, we designed plasmids con-                   or SNPs (Fig. 7A,B) have been reported as candidate selective

                                                                                                                                 Genome Research               9
                                                                                                                                    www.genome.org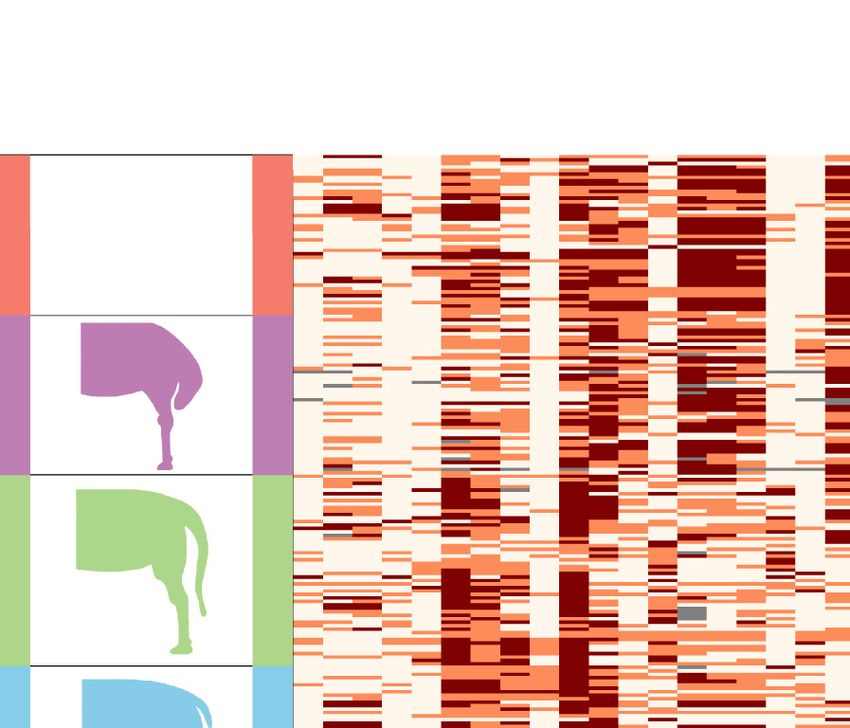
Downloaded from genome.cshlp.org on December 31, 2023 - Published by Cold Spring Harbor Laboratory Press

Li et al.

  A

  B

  C

Figure 7. Selective SVs associated with the fat-tail trait. (A) Population branch statistic (PBS) values across the whole genome by comparing fat-tailed
sheep to thin-tailed sheep using the mouflon sheep as an outgroup. The PBS value was calculated for SNPs using a 10-kb window size and 5-kb step
size. (B) The two most differentiated regions between fat-tailed sheep and thin-tailed sheep. The left panel shows the IBH region (intergenic region between
BMP2 and HAO1) and the right panel corresponds to the region surrounding PDGFD. SVs with PBS > 0.8 are highlighted by the blue dotted lines. (C ) The
haplotypes of mouflons and domestic sheep for the two most selective regions. Each column represents one SV and each row represents one individual. The
black reverted triangles represent domestication-associated SVs exclusively found in domestic sheep but absent in wild species.

regions for the fat-tail trait and contain the PDGFD gene and the               haplotype-collapsed assembly and a pair of partially phased assem-
IBH region located between BMP2 and HAO1 (Pan et al. 2019;                      blies for each breed. These assemblies provide a valuable genomic
Baazaoui et al. 2021). We identified six highly differentiated                  resource for in-depth functional genomic studies and captured a
dSVs including one domestication-associated SV in the IBH region                substantial part of the variation in Eurasian sheep. Incorporation
(Fig. 7C), the largest of which is a 7728-bp insertion. PDGFD is rec-           of more individuals/breeds from Africa and America in the pange-
ognized as the most plausible candidate gene for the fat-tail pheno-            nome will enable elucidation of a more complete global variation
type in recent studies (Dong et al. 2020; Li et al. 2020b). We found            of the sheep genome. On the other hand, our pangenome analysis
three highly differentiated SVs residing in the selective region of             is based on the reference genome. With the gradual improvement
PDGFD, the largest of which is a 867-bp insertion. The three selec-             of the pangenome model (Liao et al. 2022; Wang et al. 2022b), a
tive variants are all domestication-associated SVs. Therefore, our              graph-based sheep pangenome reference will eventually be
results suggest that both regions are associated with the fat-tail              available.
phenotype and the SVs identified within these regions are plausi-                     Despite advances and application of third-generation se-
ble candidate causative mutations.                                              quencing technologies in human genome research (Audano
                                                                                et al. 2019; Almarri et al. 2020; Ebert et al. 2021; Wang et al.
                                                                                2022b), long-read sequencing at the population scale is still rare
Discussion                                                                      for most mammalian species including sheep, which is partially
                                                                                due to their large genome size and limited funding of agricultural
The genome-wide analysis of genomic structural variations in                    research. Therefore, the SV catalog developed in this study is the
diverse breeds is critical to understanding the full repertoire of ge-          most comprehensive SV call set in mammalian species other
netic diversity and their associations with phenotypic traits.                  than human and thus will deepen our knowledge of genetic diver-
However, previous resequencing studies mainly relied on mapping                 sity in sheep and other livestock species. Furthermore, we recov-
short sequence reads to a linear reference genome, which preclud-               ered a considerable number of divergent alleles and multiallelic
ed the discovery of regions with pronounced structural variations               variations by a graph-based approach using de novo assemblies,
(Ho et al. 2020). We performed PacBio HiFi sequencing on 15 indi-               most of which are not accessible via short-read alignments.
viduals from genetically diverse breeds to generate one primary                 Although there is still no efficient tool to accurately genotype

10     Genome Research
            www.genome.org
Downloaded from genome.cshlp.org on December 31, 2023 - Published by Cold Spring Harbor Laboratory Press
Ovine pangenome study
complex variations at the population scale, we resolved the se- Methods
quences of many large variants, such as the SVs in MYADM that af-
fects sheep erythrocyte traits (Gonzalez et al. 2013). It will be Sample collection and PacBio sequencing
interesting to investigate the roles of other complex SVs reported Samples were selected to form an optimal representation of the
in this study. diversity of European and Asian sheep breeds. The sampling infor-
We compared the ovine SV spectrum with that of humans mation is provided in Supplemental Tables S2 and S17. High-qual-
also generated by long-read sequencing (Ebert et al. 2021). The ity genomic DNA (gDNA) was extracted from fresh blood samples
sheep genome harbors an average of 56,668 biallelic SVs per indi- from 15 individual sheep as previously described (Li et al. 2021)
vidual, which is more than twice the number reported (24,596 SVs and assessed for purity and quantity using NanoDrop 1000
per individual) in humans. We further found that the contribution (Thermo Fisher Scientific) and Qubit (Thermo Fisher Scientific) as-
of SINEs and LINEs to the SV spectrum differed between humans says. Libraries with an average insert size of ∼15 kb were generated
and sheep. The human SVs displayed a sharp peak at 300 bp for using the SMRTbell Express Template Prep Kit 2.0 (PacBio) and
Alu, suggesting a critical role of SINEs in shaping the human SV fractionated on the SageELF (Sage Science) into narrow library frac-
spectrum. In contrast, the sheep genome displayed a relatively tions. Libraries were then sequenced on 2-3 SMRT Cells 8M on a
low peak at 150 bp corresponding to SINE insertions. For LINEs, Sequel II instrument (PacBio) using 30-h movie times at
sheep displayed a pronounced peak at 7.7 kb corresponding to Annoroad Gene Technology Co., Ltd. Raw data were processed us-
ing the CCS algorithm (version 6.0.0, parameters: ‐‐minPasses 3 ‐‐
LINE-1 insertions, and responsible for a large proportion of ovine
minPredictedAccuracy 0.99 ‐‐maxLength 21,000) to generate
SVs. In human, although there is a notable peak at 6.1 kb, the con-
highly accurate HiFi reads.
tribution of LINEs to human SVs is not so profound as in sheep.
The 15 sheep were additionally sequenced to an average
The longer length of LINE-1 in ruminants is likely due to their ex-
depth of 24× using Illumina short-read sequencing, which was
tended 5′ UTR (Boissinot and Sookdeo 2016). A marked peak at ∼8 used to estimate the base accuracy of de novo assemblies.
kb for LINE-1 polymorphic insertion has also been reported in gi-
raffe (Petersen et al. 2021), which is closer to the 7.7-kb length de-
tected for sheep in our study. Furthermore, by inferring the De novo assembly using HiFi reads and quality assessment
ancestral state through whole-genome alignments with outgroup Hifiasm v0.15.3-r339 was used to generate the assembly from HiFi
species, we were able to identify a larger number of derived inser- CCS reads using default parameters (Cheng et al. 2021). Hifiasm
tions than deletions (94,422 vs. 33,571), of which LINE-1 account- yields one primary contig assembly and a pair of partially phased
ed for 78% of the insertions, indicating that LINE-1 mediated contig assemblies. The primary contig assembly for each breed
insertions largely shaped the ovine SV spectrum. Considering was scaffolded to chromosome level using RagTag v2.0.1 (Alonge
that recent human studies mainly focused on revealing the com- et al. 2019) with the sheep reference genome assembly (ARS-
plete SV catalog (Audano et al. 2019; Almarri et al. 2020; Ebert UI_Ramb_v2.0, GCF_016772045.1).
et al. 2021), inference of the ancestral state is warranted to provide The genome completeness was assessed using the BUSCO
novel insights into the origin and evolution of human SVs. program v.3.0.2 containing the Mammalia odb9 set of 4104 genes
(Manni et al. 2021). The single plus duplicated complete BUSCO
We also demonstrated how SVs could be linked to pheno-
gene counts are reported. The base accuracy was measured by as-
types by genotyping and assessing the SV landscape in a large co-
sembly QV using yak (https://github.com/lh3/yak), which com-
hort of data generated by short-read sequencing. We genotyped
pares the 31-mers found in short reads and the assembly
SVs using the graph-based Paragraph (Chen et al. 2019) and
sequences.
showed that the graph-based approach achieves high SV genotyp-
ing accuracy, which allowed us to trace natural and artificial selec-
tion responses in the studied populations. We identified a Structural variant calling
plausible causative mutation in HOXB13 for the long-tail trait, We integrated the results from long-read-based and graph-based
which was recently confirmed by a linkage analysis in pangenome SV calling approach to generate high-confidence SV
Merinolandschaf breed (Lagler et al. 2022). Other latest research calls. The SVs were detected for each individual using a combina-
pinpointed a missense mutation in TBXT gene that could also tion of four methods including pbsv v2.6.2 (https://github.com/
affect tail length (Li et al. 2022). Taken together, these results sug- PacificBiosciences/pbsv), cuteSV v1.0.13 (Jiang et al. 2020) and
gest that sheep is a great model to study the tail development and Sniffles v1.0.12a (Sedlazeck et al. 2018) for HiFi reads, and mini-
evolution in vertebrates. Knowledge of the location of putative graph v0.15-r426 (Li et al. 2020a) for the partially phased
causative variants will enable informed precise breeding for short- assemblies.
er tails with the consequences of enhanced animal production per- For pbsv v2.6.2, the HiFi reads were aligned to the reference
genome using pbmm2 to generate the alignment BAM file. Then
formance and welfare. Therefore, SV-based association studies in
the pbsv discover module was used to identify signatures of struc-
larger populations accompanied with phenotypic data may very
tural variation within each aligned BAM and call module to call
well become a powerful tool for trait discovery and application
SVs. The tandem repeat annotation file was provided to increase
in improvement management.
the sensitivity and recall of this step. For cuteSV v1.0.13, the pa-
In conclusion, we reported a reference panel of high-quality
rameters “‐‐max_cluster_bias_INS 1000 ‐‐diff_ratio_merging_INS
genome assemblies for 15 diverse sheep breeds and presented a 0.9 ‐‐max_cluster_bias_DEL 1000 ‐‐diff_ratio_merging_DEL 0.5”
comprehensive catalog of the SV call set. Our study is a proof-of- were used for the HiFi data. For Sniffles v1.0.12a, parameters “‐‐
principle of extending the ovine pangenome to larger cohorts in min_support 4 ‐‐report-seq ‐‐report_str ‐‐ccs_reads ‐‐genotype”
order to associate SVs with more traits. The results suggest that were used.
population-scale long-read sequencing will give a new dimension Minigraph v0.15-r426 with option -xggs was used to integrate
to our understanding of SV prevalence and their impact on pheno- all partially phased contig assemblies into a graph genome (Li et al.
types. Logically, it may allow an effective implementation of pre- 2020a). The sheep reference genome (ARS-UI_Ramb_v2.0) was
cise genomic selection on the basis of SVs. used as the backbone of the multiassembly graph and the 30
Genome Research 11
www.genome.orgDownloaded from genome.cshlp.org on December 31, 2023 - Published by Cold Spring Harbor Laboratory Press
Li et al.
partially phased contig assemblies were added successively accord- cent study on allelic specific expression analysis (Wang et al.
ing to genetic groups and ancestry (European, Middle Eastern, East 2022a). For each trio, the Mendelian error rate is the proportion
Asian, African) and also by the SV numbers per individual general- of SVs from the children that deviate from Mendelian inherence.
ly in ascending order. We did not add the assemblies based on
mash distance as we found the phylogenetic relationship of the
Inferring the derived state of SV in sheep
two haplotypes per individual was not always consistent by the
mash-based tree, potentially due to the high heterozygosity for We used high-quality genomes of takin (GCA_023091745.1) and
sheep. A recent study showed that pangenomes are generally ro- goat (GCA_001704415.1) as an outgroup to infer the derived state
bust to different input assemblies and the order of the assemblies of each SV based on the methods used in a previous study (Yalcin
have little effect on the resulting pangenome (Leonard et al. et al. 2011). First, we performed whole-genome alignment using
2022). Only autosomal sequences of the reference genome LAST v1257 (Kiełbasa et al. 2011) to get the one-to-one pairwise
were used in the multigraph genome, because the X and Y alignment between genomes of sheep and two outgroup species.
Chromosomes of males are underrepresented. The SVs were called We used SV’s flanking sequences to determine their homologous
from the multiassembly graph genome using gfatools v0.5-r234. coordinates in both outgroup genomes using the command-line
The SVs that were identified by at least two methods were re- version of the liftOver tool (-minMatch = 0.8) from UCSC (The
tained. We consider an insertion found by two methods if the in- UCSC Genome Browser Database: update 2021). We further used
sertion positions from the two call sets was found within 50 bp and BLASTN v2.10.0+ (-dust no -soft_masking false) to check the
a deletion found by two methods if they overlapped reciprocally matched sequence length and similarity of the SV sequence. The
by at least 50% using SURVIVOR v1.0.6 merge command (https presence/absence of the SV insertion in outgroup was denoted as
://github.com/fritzsedlazeck/SURVIVOR) and BEDTools v2.29.0 “0” when absent in that outgroup species, “1” when present in
(Quinlan and Hall 2010). If there was any discrepancy between outgroup, and “−1” when the homologous sequence could not
the results of SV's breakpoints among the applied approaches, be determined due to poor genome alignment.
the breakpoints were chosen based on the preference of pbsv, According to the presence/absence status of SV sequence in
cuteSV, and Sniffles. outgroups, we determined the derived state of each SV (dSVs) as de-
rived insertion (DI) if the SV was absent in two outgroups, derived
deletion (DD) if present in two outgroups, ancestral polymor-
Identification of divergent alleles and multiallelic alleles using a phism (AP) if present in one outgroup and absent in another,
graph-based approach and indeterminate if the presence/absence could not be deter-
The divergent alleles and multiallelic alleles were identified from mined for at least one outgroup species.
the graph genome using a previously reported workflow
(Crysnanto et al. 2021) with minor modifications. The graph gen- SV hotspot analysis
erated by minigraph is composed of chains of bubbles with the ref-
SVs are often discovered in clusters in some specific genomic re-
erence (ARS-UI_Ramb_v2.0) as the backbone. We first used
gions, which are identified as SV hotspots (Ebert et al. 2021). SV
gfatools v0.5-r234, which is a bubble popping algorithm to extract
hotspot regions were determined using primatR package “hotspot-
bubbles from the graph (https://github.com/lh3/gfatools). Each
ter” section (bw = 200,000, num.trial = 1000, pval < 1 × 10⁻⁸)
bubble represents a structural variation, encompassing the start
(Bakker et al. 2016). SVs were significantly clustered at the terminal
and end nodes of reference sequences as well as path traversing
5-Mb region of each chromosome (P-value < 0.01, permutation
the start and end nodes.
test, random shuffling of 1000 times). The random shuffling of
Depending on the number of paths in a bubble, the structural
SV intervals was performed using BEDTools v2.29.0 with the shuf-
variations were classified into three categories: (1) biallelic varia-
fle command (Quinlan and Hall 2010).
tions (insertions/deletions): either the reference path is longer (de-
letions) or the nonreference path is longer (insertions) and the
shorter path is required to be below 100 bp. (2) Divergent alleles: Enrichment of SVs in the genome
the reference nodes and the nonreference nodes were both >100 The H3K4me3 and H3K27ac peak regions were retrieved from our
bp. (3) Multiallelic alleles: one reference path and more than one Ruminant genome database (Fu et al. 2022). We only used inser-
nonreference path were present. Nonreference paths shorter tions and deletions for enrichment and 739 SVs overlapping
than 100 bp were excluded. with centromeric or telomeric repeats were excluded. For inser-
tions, the end position is the start position plus the insertion
SV validation by manual inspection and Mendelian inheritance length. We first recorded the observed number of overlaps between
SVs and UTR, exon, intron, H3K4me3, and H3K27ac peak regions,
error rate estimation
respectively. Then we counted the average number of overlaps be-
We randomly selected 250 SVs of different length with 50 SVs per tween randomly shuffled SVs (1000 times) and each genomic
length range, including 50–100 bp, 100–500 bp, 500–1000 bp, region.
1000–5000 bp, and >5000 bp. The SVs were manually inspected
within the 15 alignment files (BAM format) from PacBio HiFi reads.
Samplot (Belyeu et al. 2021) was used to check deletions and SV genotyping in whole-genome sequencing data
Integrative Genomics Viewer (IGV) (Thorvaldsdóttir et al. 2013) We collected whole-genome sequencing data of 649 domestic
was used to identify insertions. We did not use assembly versus as- sheep, from four geographic regions (Europe, East Asia, Middle
sembly mapping approach for SV validation, as we found that East, and Africa) as well as wild sheep including 33 Asiatic mou-
minigraph represented the variations by bubbles, which might flons (Ovis aries musimon) and eight argali sheep (Ovis ammon)
lack precise breakpoints due to imprecise alignments in repetitive mainly from the NCBI Sequence Read Archive (SRA; https://
regions (Crysnanto et al. 2021). www.ncbi.nlm.nih.gov/sra) (see Supplemental Table S1 for de-
A Mendelian inheritance error represents a genotype in the tailed information). For the domestic sheep, we selected breeds
offspring that cannot be inherited from either of their parents. with at least five individuals and defined populations by combin-
The whole-genome sequencing data of 11 trios were from our re- ing breeds from the same country with less than five individuals.
12 Genome Research
www.genome.orgDownloaded from genome.cshlp.org on December 31, 2023 - Published by Cold Spring Harbor Laboratory Press
Ovine pangenome study
In this way, all the domestic sheep were assigned to 45 breeds or similar age (6 mo old) were used. The tail length (cm) of each indi-
populations. We genotyped SVs in these samples using vidual was measured and DNA samples were collected. Whole ge-
Paragraph v2.4a (Chen et al. 2019). The maximum permitted nomes were sequenced by Shijiazhuang Boruidi Biotechnology
read count for each variant was set to 20 times the average sample Co., Ltd. using a 40K SNP chip generated by genotyping by target
depth in order to reduce runtime for repetitive regions. The result- sequencing (Guo et al. 2022). GWAS was conducted using
ing genotype files in VCF format from all samples were then com- GEMMA v0.98.3 with a mixed linear model (Zhou and Stephens
bined using BCFtools v1.9 (Narasimhan et al. 2016). 2012). The threshold of genome-wide significance was determined
To ensure a high-quality set of autosomal SVs for population by the false discovery rate of 0.01.
genetics analysis, we excluded SVs that either failed to be geno- The 168-bp insertion was genotyped by PCR amplification us-
typed in >90% of the samples and displayed an excess of heterozy- ing primers binding to the flanking region of the insertion (for-
gotes deviated from Hardy–Weinberg equilibrium (P-value < 1 × ward: TTTATGAGCTTCTCTCCGCCA; reverse: AAGTGGTATAA
10−5) using VCFtools (Danecek et al. 2011). TTGCCGGGCT), denaturation of 94°C for 2 min followed by 28
The impact of sequencing coverage on genotyping efficacy cycles of 94°C for 30 sec, 62°C for 30 sec, and 72°C for 30 sec, an
was evaluated using the 15 individuals where we have both extension of 72°C for 2 min, and a hold at 4°C. PCR products
PacBio HiFi reads and Illumina reads (>20×) available. The were detected by agarose gel electrophoresis. As expected, the F2
Illumina reads were down-sampled to 2×, 5×, 10×, 15×, 20× for population East Friesian × (Hu sheep × East Friesian) only possessed
Paragraph genotyping to estimate the genotyping accuracy, recall, two genotypes (II and ID) due to the upgrading mating scheme.
and F1 score by comparing with the genotypes from PacBio HiFi
reads. In this way, the recall, accuracy, and F1 score at 5× were
0.94, 0.85, and 0.89, respectively, and with minimal increase at Transfection and luciferase assays
higher coverage (Supplemental Fig. S18). One day before transfection, 293T cells were seeded at a density of
1 × 10⁵ cells per well of a 24-well plate for assaying the activity of
168-bp insertion. 1.0 μg of plasmids (0.9 μg for luciferase reporter
Detecting selection signals
plasmid and 0.1 μg for pRL-TK) was cotransfected according to
To detect SVs under the process of domestication, we calculated the protocol of FuGENE HD Transfection Reagent (Promega).
the DISV and the fixation index (FST) between wilds and domestics. The pRL-SV40 plasmid vector was used as an internal reference
The frequencies of SVs of wilds and domestics were counted using vector for standardizing transfection efficiency. Cell lysates were
VCFtools. The FST value was calculated using the Python scikit-allel collected 48 h posttransfection and prepared for luciferase activity
package v1.3.2 (https://github.com/cggh/scikit-allel). The FST-SNP analysis using the Double-Luciferase Reporter Assay Kit (TransGen
value was calculated using the same populations and methods Biotec) following the manufacturer’s instructions. Relative lucifer-
above. The Wilcoxon rank-sum test was carried using the Python ase activities were expressed as the ratio of the luciferase value to
Statistical functions in SciPy package v 0.13.0 (Virtanen et al. the Renilla value.
2020). The 90th quantile was calculated using the Python
NumPy package v 1.18.5 (Harris et al. 2020).
To detect population-stratified SVs, we employed two strate- RT-PCR and qPCR
gies, the global FST and the Ohana method (Cheng et al. 2022), Positive clones were seeded at a density of 1 × 10⁵ cells per well of a
which identifies extreme allele frequency differences by modeling 24-well plate. 1.0 μg of plasmids (0.9 μg for luciferase reporter plas-
ancestral admixture components. The global FST was calculated mid and 0.1 μg for pRL-TK) was cotransfected according to the pro-
following a previously described approach with modifications tocol of FuGENE HD Transfection Reagent (Promega). Total RNA
(Kijas et al. 2012). For each SV site, we calculated the FST values be- was collected using TRIzol reagent (Invitrogen) at 48 h. Purified
tween all populations. Instead of using the average of all FST values, RNA was reverse-transcribed using a HiScript II 1st Strand cDNA
we took the average of the top 50% FST values as the global FST val- Synthesis Kit (+gDNA wiper) (Vazyme Biotech). qPCR was per-
ue for each SV. The top 1% of the highest global FST value by this formed with an ABI StepOnePlus real-time PCR system (Applied
method were considered as putative selective signals. For the Biosystems) using ChamQ SYBR qPCR Master Mix (Vazyme
Ohana method, we first modeled the data set with the provided Biotech). The comparative Ct method was used to calculate the rel-
workflow using the SNPs (Yan et al. 2021). The resulting covari- ative quantity of the target gene mRNA, normalized to luciferase,
ance was used as the neutral input for scans of selection. For and was expressed as the fold change = 2-ΔΔCt. Primer sequences
each specific ancestry component, Ohana reported a likelihood ra- used for qPCR: qLuc-F: 5′ -GGTGGACATTACCTACGCCGAGTA-
tio statistic (LRS) to quantify the likelihood of selection for each 3′ ; qLuc-R: CCACAGCCACACCGATGAACAG.
variant. We varied the number of ancestral admixture components
from K = 2 to K = 5 to find selection signals.
In order to reveal selection signals in fat-tailed sheep, we used
the method of PBS (Yi et al. 2010) to calculate and compare the FST Data access
between the fat-tailed sheep, thin-tailed sheep, and Asiatic mou- The data sets supporting the conclusions of this article are includ-
flon, using the Asiatic mouflon as a distantly related population. ed within the article and its Supplemental Files. The de novo as-
The FST value between populations with different traits was calcu- semblies, HiFi data, and WGS data generated in this study have
lated using the Python scikit-allel package v1.3.2 on the basis been submitted to the NCBI BioProject database (https://www
of both SNP and SVs. FST values for SNPs were calculated with a .ncbi.nlm.nih.gov/bioproject/) under accession number
10-kb sliding window with a 5-kb step. PRJNA945429. The details are provided in Supplemental Table
S17.
GWAS of the tail length and PCR validation
GWAS of the tail length was conducted in an F2 population that Competing interest statement
was generated by backcrossing East Friesian sheep (♂) with the fe-
male Hu (♀) × East Friesian sheep (♂). A total of 201 individuals of The authors declare no competing interests.
Genome Research 13
www.genome.orgYou can also read