A multi phase deep CNN based mitosis detection framework for breast cancer histopathological images
←
→
Page content transcription
If your browser does not render page correctly, please read the page content below
www.nature.com/scientificreports
OPEN A multi‑phase deep CNN based
mitosis detection framework
for breast cancer histopathological
images
Anabia Sohail1, Asifullah Khan1,2*, Noorul Wahab3, Aneela Zameer1 & Saranjam Khan4
The mitotic activity index is a key prognostic measure in tumour grading. Microscopy based detection
of mitotic nuclei is a significant overhead and necessitates automation. This work proposes deep
CNN based multi-phase mitosis detection framework “MP-MitDet” for mitotic nuclei identification
in breast cancer histopathological images. The workflow constitutes: (1) label-refiner, (2) tissue-level
mitotic region selection, (3) blob analysis, and (4) cell-level refinement. We developed an automatic
label-refiner to represent weak labels with semi-sematic information for training of deep CNNs. A
deep instance-based detection and segmentation model is used to explore probable mitotic regions
on tissue patches. More probable regions are screened based on blob area and then analysed at cell-
level by developing a custom CNN classifier “MitosRes-CNN” to filter false mitoses. The performance
of the proposed “MitosRes-CNN” is compared with the state-of-the-art CNNs that are adapted to
cell-level discrimination through cross-domain transfer learning and by adding task-specific layers. The
performance of the proposed framework shows good discrimination ability in terms of F-score (0.75),
recall (0.76), precision (0.71) and area under the precision-recall curve (0.78) on challenging TUPAC16
dataset. Promising results suggest good generalization of the proposed framework that can learn
characteristic features from heterogenous mitotic nuclei.
Breast cancer is the second most commonly diagnosed cancer, which has affected women’s lives g lobally1. It
most commonly occurs due to irregular cell division of breast tissue such as milk duct or lobules, resulting in
the formation of tumour. Mitotic activity index (number of dividing cells under 2 m m2 tissue area) is the key
factor for determining tumour size, proliferation rate, and a ggressiveness2. Due to the imperative importance
of mitosis count, it is considered as a prognostic measure in Bloom-Richardson’s grading system3. In a routine
histopathology workflow, a pathologist analyses the biopsy sample of the affected region under a microscope and
counts the number of mitotic nuclei in 10 High Power Field (HPF) areas. However, manual analysis is tiresome
and time-consuming as there are, low density of mitotic nuclei per HPF surrounded by an overwhelming number
of other cellular c omponents4. Moreover, it is highly dependent upon the experience of a pathologist and may
suffer from inter- and intra-observer variability due to the element of human subjectivity5. The development of
an automated mitosis detection system is thus required to reduce the burden on pathologists and to improve the
objectivity of their decisions by providing an additional opinion.
With the advent of digital pathology, many computational algorithms have been developed for the automation
of pathological workflow. Recent advances in deep convolutional neural networks (CNNs) and their commend-
able performance on image classification, detection, and segmentation have accelerated their use in medical
imaging problems6–8. Deep CNNs are a type of representative learning algorithms that automatically extract the
relevant information from raw images without putting effort into manual designing of feature descriptors9. CNN
based models have been successfully applied in several histopathology problems with success, for instance: cat-
egorization of breast t issue10 into normal, benign, in situ and invasive carcinoma, detection of cancer m
etastasis11,
quantification of l ymphocytes12, demarcation of tumour r egion13, segmentation of cell nuclei and many o thers14.
1
Pattern Recognition Lab, DCIS, Pakistan Institute of Engineering and Applied Sciences (PIEAS), Nilore,
Islamabad 45650, Pakistan. 2Deep Learning Lab, Centre for Mathematical Sciences, Pakistan Institute of
Engineering and Applied Sciences, (PIEAS), Nilore, Islamabad 45650, Pakistan. 3Department of Computer Science,
Tissue Image Analytics (TIA) Lab, University of Warwick, Coventry, UK. 4Department of Physics, Islamia College
Peshawar, Peshawar, Pakistan. *email: asif@pieas.edu.pk
Scientific Reports | (2021) 11:6215 | https://doi.org/10.1038/s41598-021-85652-1 1
Vol.:(0123456789)
www.nature.com/scientificreports/
Figure 1. Histopathology patches from TUPAC16 dataset showing heterogeneity in mitosis appearance and
their close similarity with non-mitosis, panels (a, b) showing mitotic and non-mitotic nuclei, respectively.
Figure 2. Complete workflow of the proposed multi-phase mitosis detection framework (MP-MitDet).
Similarly, several CNN based approaches have been proposed to detect mitosis; however, these algorithms
still have a margin of improvement due to the challenging nature of the p roblem15–17. Automated detection of
mitotic nuclei is challenging due to their atypical configuration and difference in the texture of cells in different
morphological phases (shown in Fig. 1). Mitotic cell division is characterized by four different stages: prophase,
metaphase, anaphase, and t elophase18. For instance, telophase is distinct, as, in this phase, the nucleus is divided
into two distinct parts and is still considered as a single cell. Besides, mitotic nuclei resemble many other hyper-
chromatic cellular bodies such as necrotic, apoptotic and non-dividing dense nuclei, making detection of mitosis
atch19 (shown in Fig. 1). Moreover, tissue slides vary in appearance due to acquisition from
difficult on tissue p
different pathology labs and their preparation protocols.
To address all of the above mentioned challenges, in this study we have proposed a new learning framework
for weakly labelled dataset. In this regard, a deep CNN based multi-phase mitosis detection framework “MP-
MitDet” is developed that analyses the Haematoxylin and Eosin (H&E) stained breast cancer histopathology
images (work flow is shown in Fig. 2). Initially, a weakly labelled mitosis dataset, with centroid labels only, is
refined by adding pixel-level semantic information. The resulting dataset with refined labels is assigned to a deep
detection module for mitotic nuclei identification. A deep instance-based detection and segmentation CNN is
employed on tissue level to localize the probable mitotic regions, thus neglecting numerous non-mitotic nuclei.
Blob analysis is performed on the selected region to filter fragmentary probable mitotic nuclei. Enhancement
of the preceding phase is performed on cell level via a proposed deep custom “MitosRes-CNN” to remove the
false-mitoses. Different augmentation and colour variation strategies are applied during training to address the
class imbalance problem and to make the classifier robust towards unseen patient examples. The contributions
of the proposed framework are the following:
Scientific Reports | (2021) 11:6215 | https://doi.org/10.1038/s41598-021-85652-1 2
Vol:.(1234567890)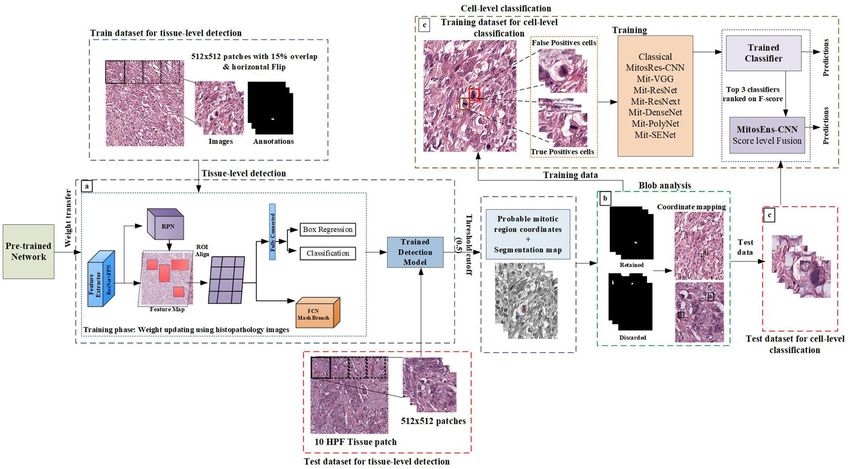
www.nature.com/scientificreports/
(i) Exploitation of deep segmentation model using transfer learning (TL) to improve the labels of weakly
annotated mitoses by learning morphological information from small patient dataset.
(ii) Exploitation of instance-based detection and segmentation model using multi-objective loss to reduce the
class imbalance with minimum loss of mitosis.
(iii) Concept of weight transfer and cross-domain TL are exploited to adapt the deep architectures on small
dataset.
(iv) Custom-made deep CNN “MitosRes-CNN” is proposed that is robust against the mitotic appearance vari-
ability.
(v) Comparative analysis of the proposed “MitosRes-CNN” is provided with diverse categories of state-of-the-
art CNN architectures for mitosis detection problem.
Related work
Several competitions held by ICPR12, AMIDA13, ICPR14, and TUPAC16 have provided the benchmarked data-
set for the automation of mitosis detection problem19–22. The proposed detection approaches can be broadly cat-
egorized into classical and CNN based data-driven approaches. Classical approaches reported in literature often
exploit quantitative features, for instance, morphology, colour, texture and statistical features to represent the
mitosis and assign these representations to the classifier for discrimination23,24. Contrary to classical approaches,
CNN based approaches are superior in performance as they eliminate the reliance on the handcrafted features.
Currently, exiting CNN based approaches can be categorized as pixel-level classification or fine-grained detec-
tion approaches where initially candidate mitotic regions are identified that are assigned to another classifier to
improve the detection.
There are a few techniques that have used end-to-end pixel-wise classification scheme for mitosis detection.
In earlier studies, Ciresan et al. (2013) developed a max-pooling based Fully Convolutional Net (FCN) that
performed pixel-wise classification. The developed model was applied to the unseen data in a sliding window
manner to locate the mitoses25. The proposed approach stood at the top place in the ICPR12 challenge with an
F-score of 0.78. However, this approach is slow and computationally intensive. Zerhouni et al. (2017) proposed
use of state-of-the-art Wide Residual Networks for pixel-wise classification of mitosis on breast histology images.
Post-processing was applied to the output to remove the noise and less probable mitoses, whereas the final deci-
sion was taken by combining the output of several networks using the majority v ote26.
Due to the intricate nature of mitosis detection problem, most of the techniques address it by employing
multiple detection and classification models. ICPR14 dataset, instead of providing the morphological informa-
tion of the mitosis, only provided centroid annotation, thus increasing the difficulty level of detection. Chen
et al. (2016) overcame the challenging nature of the dataset by adopting a deep cascaded CNN based approach
and this technique won the ICPR14 c hallenge27. In the first phase of Chen et al.’s technique, an FCN was used to
locate the candidate mitoses. In contrast, in the second phase, a fine discrimination model was developed that
utilized the cross-domain knowledge to remove false positives. Wahab et al. (2017) proposed a two-phase clas-
sification approach to deal with the class imbalance problem. Initially, the dataset for classification was created by
performing global binary thresholding on blue ratio i mages28. In the first stage of the proposed technique, CNN
was trained on the original dataset to identify the hard examples. Whereas in the second stage, the dataset was
improved by performing the under-sampling of the negative examples using histogram-based k-means clustering
on blue ratio images and augmented the dataset by including hard negative examples. In another study, Wahab
et al. (2019) proposed TL based efficient mitosis c lassifier29. They initially used customized pre-trained FCN for
the mitosis detection, whereas in the second phase, predictions of the first phase were refined by assigning the
output to another CNN that was hybrid of AlexNet and custom layers. The mitosis detection technique that got
first place in the TUPAC16 challenge also adopted a two-stage detection approach to get an improved F-score30.
Region based CNNs (R-CNNs)31 have shown good performance for object detection problems in computer
vision. Therefore, Li et al. (2018) exploited the region information of the mitosis using VGG16 backboned faster
R-CNN to filter out the probable mitotic regions that are further refined by assigning the predictions to another
deep network to remove false positives32. Likewise, MitosisNet proposed by Alom et al. (2020) also consisted of
multiple deep learning models, including segmentation, detection, and classification models for the final decision
of the mitosis r egions33. Similarly, Mehmood et al. handle the complex nature of mitosis by initially identifying
probable mitotic regions through R-CNN. They isolated non-mitotic regions from the selected regions by assign-
ing the initial phase results to the ensemble of R esNet5034 and D enseNet20135. The proposed approach achieved
0.858 and 0.691 F-score for the ICPR 2012 and ICPR 2014 dataset, respectively.
Mitosis labelling is tedious, and it is not easy to rigorously annotate them on the Whole Slide Images (WSIs).
To overcome this limitation, Akram et al., proposed a semi-supervised learning model for WSIs that shows
promising results on the TUPAC16 d ataset36. Initially, the detection model was trained on a small size labelled
dataset. This trained model was further used to filter out the mitosis samples from unlabelled WSIs. In this way,
a large dataset was built, used for the final training of the detection model.
Training of a deep learning model with a weakly annotated dataset is challenging. This problem is addressed
by Li et al. (2019), who introduced a new learning scheme to identify the mitotic nuclei using semantic segmenta-
tion based FCN. Their approach achieved state-of-the-art results on the MITOS14 dataset, AMIDA13 dataset, and
TUPAC16 dataset with an F-score of 0.562, 0.673, and 0.669, respectively15. The defined scheme uses concentric
circular labels to represent the mitotic region and proposed a concentric loss function that only considers the
region inside the circle whereby it excludes the chance of non-mitotic region overlap with the mitotic region.
Similarly, Sebai et al. (2020) adapted the semantic segmentation model for the mitosis detection p roblem16,54,53.
They handled the issue of weak labels by integrating two deep networks in an end to end manner. They separately
trained both networks on weak and pixel-level labels in a simultaneous way. The final decision was made by
Scientific Reports | (2021) 11:6215 | https://doi.org/10.1038/s41598-021-85652-1 3
Vol.:(0123456789)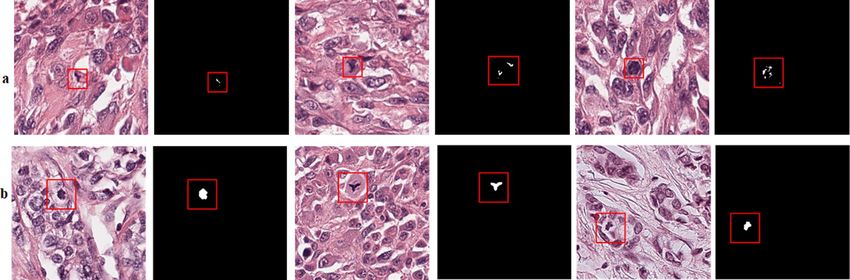
www.nature.com/scientificreports/
Dataset Scanner Resolution (μm/pixel) Spatial Dimension Patients Mitosis
Aperio ScanScope 0.25 2000 × 2000 23
TUPAC16 914
Leica SCN400 0.25 5657 × 5657 50
Leica SCN400 0.2456 2084 × 2084 5
MITOS12 226
Hamamatsu 0.2275 2252 × 2250 5
Leica SCN400 0.2456 1539 × 1376 11
MITOS14 749
Hamamatsu 0.2275 1663 × 1485 11
Table 1. Details of the datasets.
Dataset Patient Number
TUPAC16 patients: 01, 02, 03, 05, 07, 08, 10, 11, 12, 13, 14, 15, 16, 17, 18, 19, 20, 22, 23, 24, 25, 28, 33, 34, 35, 37, 38, 40, 42, 44,
Train 47, 49, 51, 52, 54, 59, 61, 64, 68, 69, 70, 72
All patients from training dataset of MITOS12 and MITOS14
Validation 04, 06, 09, 21, 26, 29, 31, 39, 46, 48, 56, 65, 67, 73
Test 27, 30, 32, 36, 41, 43, 45, 50, 53, 55, 57, 58, 60, 62, 63, 66, 71
Table 2. Cross-validation scheme for detection and classification models.
combining the prediction of both the models. Most of the techniques discussed above are based on state-of-the-
art pre-trained CNN models without custom modifications that were previously reported in literature.
Methods
This work suggests a multi-phase deep CNN based mitosis detection framework (MP-MitDet) for H&E stained
breast cancer histopathological images. The workflow is decomposed into 4 phases: (1) refinement of weakly
labelled mitosis dataset, (2) mitotic region selection at tissue-level, (3) blob analysis, and (4) enhancement of
mitosis detection results at cell-level. The overall workflow of the proposed detection model is shown in Fig. 2.
Datasets. TUPAC16 challenge provided a publicly accessible dataset for mitosis detection problem named
TUPAC16 auxiliary d ataset21. This dataset consisted of specified regions of breast biopsies corresponding to 10
HPF selected by the pathologists from WSIs. The provided images were collected from three different centres
of Netherlands and were scanned by two different scanners under 40 × magnification. The dataset consisted of
656 images collected from 73 patients. This challenge provided a maximum number of patient samples to date
for mitosis detection problem, whereby it provided 50 new patients and included 23 patients’ samples from the
AMIDA13 challenge. This dataset is challenging as it provided only centroid labels of the mitoses. Provided
mitoses were annotated rigorously by two pathologists. In addition to the TUPAC16 dataset, patient samples
from two other previous challenges: MITOS12 and MITOS14 were also included in the training to augment the
small number of patient samples and to improve the learning of deep CNN models (details of the dataset are
mentioned in Table 1)20,22. All three different datasets were H&E stained and taken from breast tissue biopsies.
Cross‑validation scheme. The dataset was divided into train, validation, and test sets, whereas the patient
samples in the test were kept the same as mentioned in Wahab et al.’s (2019)37 study to make the results compa-
rable. Data was divided in such a way that the patient samples were kept disjointed in train, validation, and test
to emulate the real-world scenario. The data division is mentioned in Table 2. Cross validation scheme is kept
the same for deep instance based detection and segmentation model employed for tissue level detection as well
as for classical and deep classification models used for cell-level classification. All the models were trained with
the training dataset and hyperparameters and architectural configurations were selected based on model perfor-
mance on validation dataset. However, test dataset was kept separate from the training and validation set, and it
was used for the final evaluation of the selected models.
Preprocessing and normalization of images. Histopathological images were stain normalized initially
using Macenko et al.’s38 technique to mitigate the variations in staining colours. It is expressed in Eq. (1–3).
Histopathological images were collected from different pathological laboratories. Each laboratory has its stain-
ing protocols, and samples were digitalized using the different scanner, resulting in noise and non-uniformity
in colour appearance (shown in Fig. 3). All the images were mean normalized and standardized (Eq. 4) before
assigning them to the machine learning models.
OD = − log10 (H) (1)
OD = VS (2)
Scientific Reports | (2021) 11:6215 | https://doi.org/10.1038/s41598-021-85652-1 4
Vol:.(1234567890)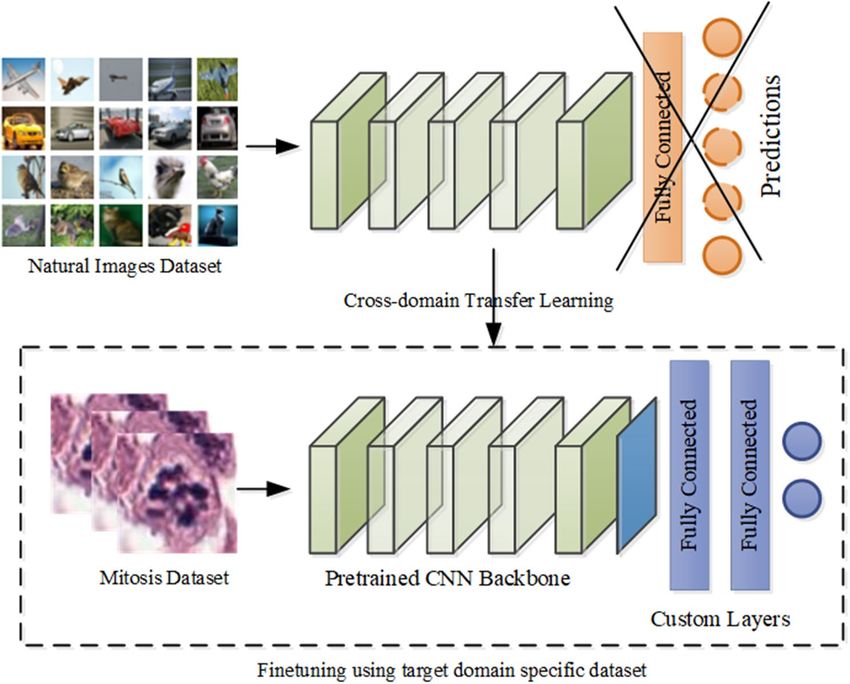
www.nature.com/scientificreports/

                                  Figure 3.  (a) Actual vs. stain normalized images; (b) histopathological images from different scanners.

                                  Figure 4.  (a) Pixel-level annotations; (b) weak labels (centroid labels).

                                                                                      S = V −1 OD                                                    (3)

                                                                                            Hsnorm − µ
                                                                                  Hnorm =                                                            (4)
                                                                                                 σ

                                     In Eq. (1), H represents histopathological image whose RGB values are transformed to optical density values
                                 (OD). Whereas, in Eq. (2), V represents the stain vectors for H&E, and S shows their saturation value. Equa-
                                 tion (3) is used to express the stain values in a standard quantitative way. In Eq. (4), Hsnorm and Hnorm are the
                                 stain normalized input and mean-standard deviation normalized pixel values, respectively, whereas µ and σ are
                                 used to represent the mean and standard deviation for RGB values of the dataset.

                                  Refinement of weakly labelled mitosis dataset. Annotations for the MITOS14 and TUPAC16 data-
                                  sets are provided as weak labels (Ycentroid = Mx,y=c ). The labels are represented by centroid pixel ( Mx,y=c ) of the
                                  mitoses, as shown in Fig. 4b. In practice, it is extremely time-consuming for pathologists to annotate a large num-
                                  ber of patient samples manually and assign pixel-level labels. Therefore, an automated labelling approach named
                                  as label-refiner is developed to assign the pixel-level labels. Mask R-CNN39 is used to develop the fine masks
                                  for mitoses and it is trained with MITOS12 dataset (Fig. 4a) having pixel-level annotations (Ypolygon = Mx,y=1 s     ).
                                  MITOS12 dataset consists of only 5 patients (Table 1), therefore pretrained Mask R-CNN is used and fine-tuned
                                  on 338 samples from 5 patients. Strongly labelled dataset helps the Mask R-CNN to learn the morphology of
                                  the mitoses. Mask R-CNN architecture is shown in Fig. 5. The learning stages of Mask R-CNN are divided into
                                  (i) Feature Extraction Network (ResNet + Feature Pyramid Network), (ii) Region Proposal Network (RPN), (iii)
                                  Region of Interest (ROI) alignment, (iv) Detection and Segmentation.

Scientific Reports |   (2021) 11:6215 |                https://doi.org/10.1038/s41598-021-85652-1                                                      5

                                                                                                                                                  Vol.:(0123456789)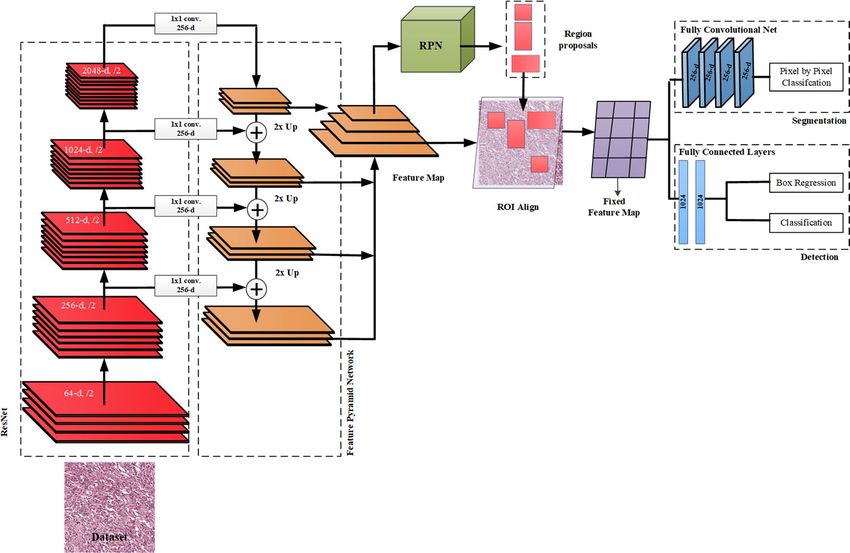
www.nature.com/scientificreports/

                                            Figure 5.  Architectural details of the Mask R-CNN.

                                            Figure 6.  Label refinement module (label-refiner) for the weakly annotated dataset.

                                                 The trained Mask R-CNN is used to generate the pixel by pixel masks for the training set (Table 2) of mitosis
                                           detection module. Generated masks are used as labels for further analysis of the mitosis dataset, whereas seg-
                                           mented blobs that do not correspond to true mitoses are discarded. During the refinement phase, some labels
                                           are missed by the detection model for which pseudo labels ( Ycircular ) are developed. Pseudo labels ( Ycircular )
                                           are generated based on the idea proposed by Li et al. (2019)15 and represented each mitosis in the form of a
                                           circle. Circular annotation is drawn randomly with a radius of 10–16 pixels. So, the developed label-refiner
                                            frefiner (Hnorm , Ycentroid ) (expressed in Eq. (5)) works by taking input images (Hnorm ) and their weak labels
                                           ( Ycentroid ) and returns the semi-semantically labelled dataset (Ysemi−semantic ), consisting of true morphology
                                           and pseudo representation. The complete workflow of the label refinement phase is shown in Fig. 6.
                                                                               Ysemi−semantic = frefiner (Hnorm , Ycentroid )                             (5)

          Scientific Reports |   (2021) 11:6215 |               https://doi.org/10.1038/s41598-021-85652-1                                                  6

Vol:.(1234567890)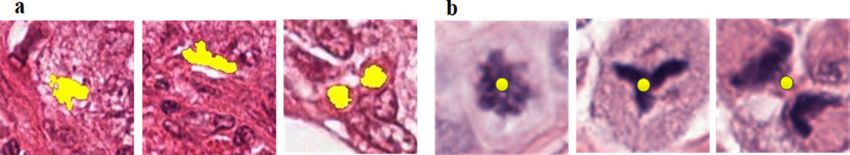
www.nature.com/scientificreports/
Figure 7. Work flow diagram, (a) mitotic region selection at tissue-level using multi-objective deep instance
based detection and segmentation model, (b) blob analysis, (c), enhancement using cell-level classification.
Mitotic region selection at tissue level. We exploited multi-objective loss function of Mask R-CNN for
mitosis region selection from histopathology tissue patches using weight space TL and hyper-parameter optimi-
zation. Workflow of mitotic region selection at tissue-level using multi-objective deep instance based detection
and segmentation model is shown Fig. 7a. The use of multi-objective loss function ( Lmulti−obj ) expressed in
Eq. (6) helps to improve the mitosis detection task by incorporating the morphology information (Eq. (9)) from
segmentation branch along with region information from detection branch that performs bounding box regres-
sion and classification (Eq. (7 & 8)).
Lmulti−obj = lclas + lreg + lmask (6)
lclas = − log P(Cj∗ |Cj ) (7)
lreg = smooth L1 (Bj − Bj∗ ) (8)
R C
1
∗
lmask (C ∗ , C) = ∗
(9)
Cr,c . log Cr,c + (1 − Cr,c ). log(1 − Cr,c )
R×H
r=1 c=1
Equation (7 & 8) represent the classification (lclas ), and box regression (lreg ) loss, respectively, whereas Cj and
Bj denote the predicted class label and estimated bounding box coordinates, respectively, for jth anchor. Likewise,
Cj∗ and Bj∗ are used to represent the ground-truth values for jth anchor. Bounding box regression branch returns
the real values therefore the difference between ground-truth spatial coordinates and predicted coordinates is
minimized by computing smooth L1 loss (Eq. (8)). The segmentation loss function (lmask ) is estimated by using
Eq. (9), whereas spatial dimensions of the input region proposal are represented via (R × H). In this equation,
(.) operator denotes the multiplication sign, whereas Cr,c ∗ indicates the ground-truth class for (r, c) coordinates
and Cr,c shows predicted class probability at (r, c) coordinates of the image.
In this study, mitotic region selection is considered as a binary class detection problem. For the training of
detection module (Mask R-CNN), histopathological images are labelled in a COCO f ormat40 by defining mitosis
as an object of interest, whereas all other cellular/nuclear components and stroma are labelled as background.
The backbone of Mask R-CNN was built on Feature Pyramid Network based ResNet10134,41 shown in Figs. 5
and 7 for the learning of enriched deep feature hierarchies. The advantage of using this network is that it learns
strong semantic information while retaining spatial information at different scales. Mitoses are small in size
and are expressed via few pixels in the later layers of deep architecture however, this information is not enough
for object detection. Feature Pyramid Network (FPN) alleviates this problem by extracting the feature repre-
sentation of the object at different s cales41. Feature representation learned from FPN is assigned to the RPN to
Scientific Reports | (2021) 11:6215 | https://doi.org/10.1038/s41598-021-85652-1 7
Vol.:(0123456789)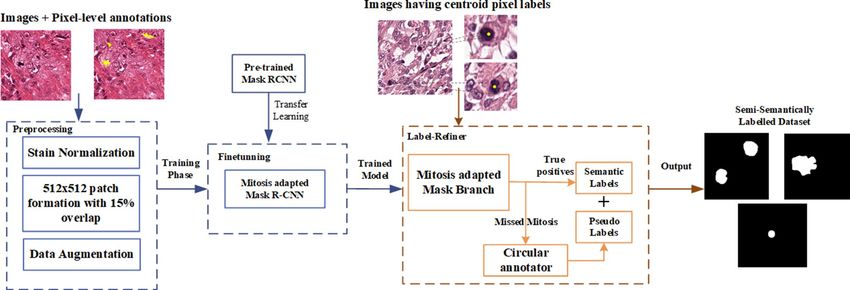
www.nature.com/scientificreports/
extract the probable regions. In RPN, region proposals are searched by using 12 anchors by setting aspect ratios
as {1:2, 1:1, 2:1} on four different scales {32 × 32, 64 × 64, 128 × 128, 256 × 256}. RPN selects the region proposals
by computing Intersection over Union (IoU) of each region proposal with ground truth and retains only those
regions that overlap by at least 70%. These region proposals are mapped to the feature map using ROI align that
resizes them using bi-linear interpolation and assigns them to the detection and segmentation head for the clas-
sification of the selected regions.
Training of detection model using weight space transfer learning. Mask R-CNN is trained on
3904 images of train dataset (Table 2) by exploiting the idea of weight transfer of pre-trained architecture to
adapt the deep architecture on a small mitosis dataset consisting of 61 patients42. Deep NNs usually require a
massive amount of data for training and suffer from overfitting on insufficient data. TL addresses this problem
by allowing to reuse the knowledge of the pre-trained network to a new task and has shown remarkable results
when labelled data is insufficient in the target domain. TL can be employed by using pre-trained architecture as
a fixed feature extractor, freezing lower layers and fine-tuning higher layers, or leveraging parameter space of
pre-trained architecture to the target domain43.
In this work, the backbone architecture of Mask R-CNN is pre-trained on 1 million natural images from Ima-
geNet, whereas the detection and segmentation head is pre-trained on the COCO d ataset40,44. So, we define the
source domain as D(S) = {IN , P(IN )} where IN represents the natural images and P(IN ) represents its marginal
distribution. The knowledge domain of a pre-trained network NS = fS (θS , {IN , YN }) constitutes the images (IN ),
labels (YN ), and parameter space (θS ). During training, we adapted the parameter space (θS ) by finetuning the
network end to end by assigning histopathological images (IH ) from the target domain D(T) = {IH , P(IH )}. This
finetuned architecture is defined by NT = fT (θT , {IH , YH }) and is used for mitotic region selection.
Blob analysis. In this phase, Mask R-CNN predictions are filtered out at threshold cut-off of 0.5 and all
regions that are predicted with more than 50% confidence as mitotic regions are regressed to patient’s tissue
patches (Fig. 7b). Candidate mitotic nuclei that are selected are considered as blobs. On the selected regions,
blob analysis is performed to retain blobs with an area more than 600 pixels and fragmentary blobs are removed.
Bounding boxes for training dataset are analysed and the false positives are separated from the true positives
based on their centroid distance from ground truth (Fig. 7c). Predicted bounding boxes that do not lie within
the 30-pixel distance of ground truth are considered as false positives, whereas other predictions are kept as true
mitosis.
Enhancement of mitosis detection results at cell‑level. In the last phase, refinement of the selected
mitotic regions is performed to reduce the false positives (Fig. 7c). Therefore, custom made deep CNN “Mitos-
Res-CNN” is proposed for the analysis of selected cells to discriminate hard negative examples from true
mitoses. Network topology including depth and width are selected based on validation dataset. The performance
of the proposed architecture is compared with the state-of-the-art deep CNN architectures and classical machine
learning models. Details of this section are mentioned below.
Augmentation and oversampling of the mitotic nuclei. Histopathological images exhibit colour
appearance multiplicity due to variation in staining protocols across labs and image acquisition under differ-
ent scanners. Different image variations are applied on-the-fly during the classifier’s training to make it robust
towards unseen patient examples. Augmentation strategies include horizontal and vertical flip, rotation, and
colour jitters. Mitotic examples are augmented by extracting patches at various positions to avoid the overfitting.
Furthermore, during training, the effect of imbalance is reduced by controlling the proportion of minority and
majority class by fetching more positive examples based on the ratio of negative and positive examples. Valida-
tion and test sets are drawn from patients without augmentation to emulate the real-world scenarios.
Proposed MitosRes‑CNN for mitosis classification. In this work, we proposed a new custom CNN “MitosRes-
CNN” for the discrimination of false positives from the true mitotic nuclei. The proposed architectural scheme
is shown in Fig. 8. The proposed MitosRes-CNN is formulated of three custom residual blocks with shortcut
links. Residual learning34 [Eq. (10–12)] is implemented to tackle the problem of vanishing gradient. Moreover, it
performs reference-based optimization of weights by comparing transformed feature-maps with input feature-
maps, [as shown in Eq. (10–12)] thus it encourages each block to learn useful features.
Within each custom residual block, set of transformations are implemented to better approximate the data
eld45 is exploited by convolving the feature-maps
representation, whereas the concept of the effective receptive fi
with the same size of filters. The transformations are comprised of 3 × 3 convolution operation (Eq. (10)) in
combination with batch normalization to smoothen the gradient-based learning46. Leaky ReLU (Eq. (12)) is
used as a activation function to incorporate the non-linearity and to add the sparsity47. Leaky ReLU addresses
the problem of dead neurons by permitting the positive activation (a) values as such, whereby assigning a small
gradient to negative activations (a).
P,Q
C
l+1 l
Ox,y = ki,j Mp+i,q+j +b (10)
c p,q
Scientific Reports | (2021) 11:6215 | https://doi.org/10.1038/s41598-021-85652-1 8
Vol:.(1234567890)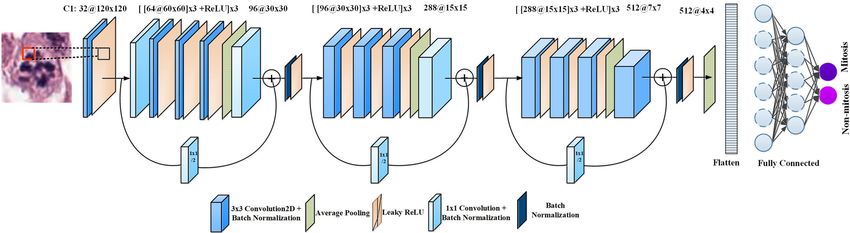
www.nature.com/scientificreports/
Figure 8. Block diagram of the proposed MitosRes-CNN.
l+1 l+1 l
Mx,y = Ox,y + Mx,y (11)
l l+1 l+1
Mx,y = Mx,y − Ox,y (12)
a if a > 0
f (a) =
0.01a otherwise (13)
Equation (10) expresses convolution operation performed by convolution layer, whereas Mp,q l represents
the input feature map of spatial size (P × Q pixels) for lth layer, k denotes the kth convolution kernel and b is
for bias. Whereas, c shows the feature map depth, (i, j) represents spatial coordinates of kernel and (p + i, q + j)
shows the receptive field occupied by kernel. In Eq. (11), Mx,yl is the input assigned to residual block, whereas
l+1 is a transformed (convolved) feature-map that is output from lth layer. Equation (12) shows the residual
Ox,y
output ( Mx,yl+1 − Ol+1).
x,y
l+1 l+1
Ax,y = favg (Mx,y ) (14)
At the end of each residual block, downsampling of the feature-map is performed using average pooling
(Eq. (14)) to incorporate both low and high-level responses. In Eq. (14) average pooling operation is denoted via
x,y represents its outputs for l layer. Pooling operation helps in reducing the overfitting and to learn
th
favg (.) and Al+1
the invariant features. Average pooling operation is followed by a 1 × 1 convolution to increase the number of
feature-maps9. The number of feature-maps is increased three times at the end of each block. Each block assigns
its output to the next block in a feed-forward manner as well as connected via shortcut link (Eq. (11 & 12)) to
provide direct access to the gradient.
Dropout with a 50% probability is used for fully connected layers to limit the overfitting. SoftMax is used at
the end of a fully connected layer to compute the probability of each sample belonging to mitosis or non-mitosis.
Details of the proposed architecture are mentioned in Table 3. Weights (W) of the proposed network are ini-
tialized using Glorot uniform random weight initialization strategy (Eq. (15)) and bias (b) is initialized with 0.
1 1
W ∼ U − , , U[−n, n] (15)
z z
In the above Eq. (15), W specifies the weight vector of network, U represents the uniform distribution that
is drawn from range (-n, n) and z is the size of the previous layer.
Cross‑domain adaptation of deep CNNs for mitosis classification. Deep CNNs have shown exemplary perfor-
mance in diverse image classification tasks9. Deep networks learn features in a hierarchical manner, includ-
ing generic and high-level features specific to the problem. This distinct characteristic allows us to reuse the
pre-trained architectures for diverse tasks. Domain adaptation is a type of TL that allows reusing the already
pre-trained architecture to a new problem. In this special type of TL, both target and source domains belong to
different data distribution but are assigned to the same task. The advantage of this TL is gaining many low and
intermediate level features that are shared among the diverse categories of images.
In this study, we have exploited the concept of supervised cross-domain feature space adaptation and lever-
aged the knowledge of state-of-the-art deep CNNs models that are pre-trained on the ImageNet dataset for
mitosis recognition problem. In this case, source D(S) = {IN , P(IN )} and target D(T) = {IH , P(IH )} domains
share the low and intermediate level features ( IN = IH ) and both are assigned to the classification task but they
follow different marginal distribution P(IN ) = P(IH ). Well-known deep CNN models: VGG, ResNet, DenseNet,
ResNext, SENet and PolyNet with diverse architectural designs are modified by keeping feature extraction layers
as such and adding average pooling layer in alliance with additional fully connected layers to align the network
towards the mitosis specific features (shown in Fig. 9). The number of filters in task specific fully connected
layers and filter size for adaptive average pooling are set based on the validation dataset (Table 2). Details of the
Scientific Reports | (2021) 11:6215 | https://doi.org/10.1038/s41598-021-85652-1 9
Vol.:(0123456789)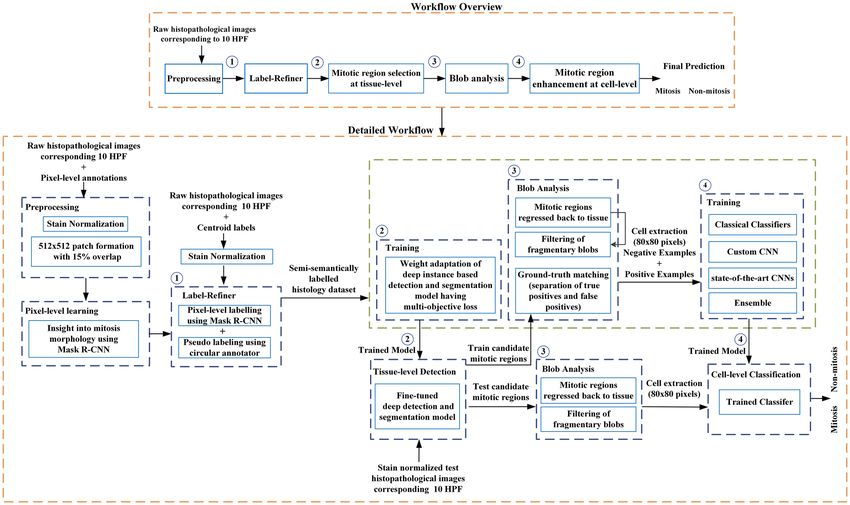
www.nature.com/scientificreports/
Layer number Processing unit Input Output Filters Filter size Stride Zero padding
Conv2D + Batch-
Input layer Norm2D + Leaky 3 × 120 × 120 32 × 60 × 60 32 3×3 2 1
ReLU
Conv2D + Batch-
32 × 60 × 60 64 × 60 × 60 64 1×1 1 1
Norm2D
Conv2D + Batch- [[64 × 60 × 60] × 3 + Leaky
64 × 60 × 60 64 3×3 1 1
Norm2D ReLU] × 3
Block 1
AvgPool2D 64 × 60 × 60 64 × 30 × 30 64 3×3 2 1
Conv2D + Batch-
Norm2D + Leaky 64 × 30 × 30 96 × 30 × 30 96 1×1 1 0
ReLU
Block 1 skip con- Conv2D + Batch-
32 × 60 × 60 96 × 30x × 30 96 1×1 2 0
nection Norm2D
Conv2D + Batch- [[96 × 30 × 30] × 3 + Leaky
96 × 30 × 30 96 3×3 1 1
Norm2D ReLU] × 3
AvgPool2D 96 × 30 × 30 96 × 15 × 15 96 3×3 2 1
Block 2
Conv2D + Batch-
Norm2D + Leaky 96 × 15 × 15 288 × 15 × 15 96 1×1 1 0
ReLU
Block 2 skip con- Conv2D + Batch-
96 × 30 × 30 288 × 15 × 15 288 1×1 2 0
nection Norm2D
Conv2D + Batch- [[288 × 15 × 15] × 3 + Leaky
288 × 15 × 15 288 3×3 1 1
Norm2D ReLU] × 2
Conv2D + Batch- [288 × 15 × 15] × 2 + Leaky
288 × 15 × 15 288 3×3 1 1
Norm2D ReLU
Block 3
AvgPool2D 288 × 15 × 15 288 × 7 × 7 288 3×3 2 1
Conv2D + Batch-
Norm2D + Leaky 288 × 7 × 7 512 × 7 × 7 512 3×3 1 1
ReLU
Block 3 skip con- Conv2D + Batch-
288 × 15 × 15 512 × 7 × 7 512 1×1 2 0
nection Norm2D
Average pooling AdaptiveAvgPool2D (4 × 4)
Dropout (p = 0.5)
Dense Fully Connected 8192 150 150 1 – –
Dropout (p = 0.5)
Batch normalization Batch normalization 1D
Dense Fully Connected 150 2 2 1 – –
Softmax
Table 3. Architectural details of the proposed MitosRes-CNN.
architectures are mentioned in Table 4. The entire network is fine-tuned via the back-propagation algorithm on
the mitosis dataset to obtain target domain specific semantically meaningful features.
Mitosis classification using classical classifiers. Classical classification algorithms, including Naive Bayes, Logis-
tic regression, SVM, Decision tree, Random Forest, and XGBoost, are also evaluated for mitosis detection prob-
lem. These classifiers were trained on the original feature space as well as on the HOG and LBP extracted feature
space.
Performance metrics. The performance of the proposed Mitosis detection framework is evaluated using
F-score, Recall, Precision, and Precision-Recall (PR) curve (Eqs. 16–18). Mitosis detection is a class imbalance
problem, where under-representation of mitoses biases the performance measure that assigns equal weightage
to each class. F-score evaluates the classifier’s correctness by computing the weighted average of precision and
recall (Eq. 18). A recall is computed based on the criterion specified for automated mitosis detection modules48.
According to it, mitosis in the telophase phase is under duplication; therefore, it is counted once, and all the
mitoses that lie within 30 pixels of ground truth are counted as true mitoses.
Truely Predicted Mitoses
Recall = (16)
Total Mitoses
Truely Predicted Mitoses
Precision = (17)
Truely Predicted Mitoses + Falsely Predicted Mitoses
Scientific Reports | (2021) 11:6215 | https://doi.org/10.1038/s41598-021-85652-1 10
Vol:.(1234567890)www.nature.com/scientificreports/
Figure 9. Cross-domain TL of the state-of-the-art CNN architectures.
CNN backbone Adaptive average pooling Fully connect layers
[4 × 4 × 2048, 950]
SE-ResNet50 4×4
[950, 2]
PolyNet-152 1×1 [2048, 2]
[4 × 4 × 2048, 750]
ResNext50 4×4
[750, 2]
[7 × 7 × 1920, 750]
DenseNet201 7×7
[750, 2]
[4 × 4 × 512, 750]
VGG16 4×4
[750, 2]
[4 × 4 × 512, 750]
ResNet18 4×4
[750, 2]
Table 4. Cross domain adaptation of the state-of-the-art CNNs.
Recall × Precison
F - Score = 2 × (18)
Recall + Precison
In the above equation, recall suggests the detection rate, whereas precision shows the closeness of the predicted
classes to the ground truth.
Data preparation for detection and classification models. Patches of size 512 × 512 pixels with 15% overlap
were extracted for label refinement and mitosis detection at tissue-level stage for the training of Mask R-CNN.
Whereas patches of 80 × 80 pixels were generated for the training of classification models. Input images for clas-
sification were resized to 120 × 120 and 224 × 224 pixels for custom and state-of-the-art CNN, respectively, using
bilinear interpolation.
Parameter settings. Custom and pre-trained CNN architectures were fine-tuned using cross-entropy loss func-
tion by setting batch size equal to 16 and 6, respectively, assigning a learning rate of 1e−3, and weight decay of
1e−5 for 250 epochs. During training the model with best weight state was saved based on the validation data-
set. Mask R-CNN was trained for 30,000 epochs using batch size 2, and the learning rate equal to 0.00025. The
number of region proposals was set to be 128 for assigning mitosis and non-mitosis examples to ROI head for
Scientific Reports | (2021) 11:6215 | https://doi.org/10.1038/s41598-021-85652-1 11
Vol.:(0123456789)www.nature.com/scientificreports/
Figure 10. (a) Annotation results from blue-ratio binary thresholding (threshold value = 0.0075), panel (b)
results of the proposed label-refiner that generates the pixel level image labels.
classification. Mask R-CNN and classification based CNN were optimized using SGD with warmuprestart and
cosine annealing optimization strategy, respectively.
Results
This study aims to develop a mitosis detection framework that can effectively learn the mitosis representation
from the weakly labelled (centroid annotation) histopathological images. In this study, 61, 14, and 17 patients’
datasets (Table 2) were used for training, validation, and test, respectively. Mitosis detection is difficult due to
its small size and close resemblance with non-mitotic nuclei. Therefore, we proposed a multi-phase detection
approach, “MP-MitDet,” for mitotic nuclei discrimination. Multi-phase detection approach is split as: label-
refiner and mitosis detection module. Mitosis detection module (Fig. 7) is further divided into: (1) mitotic
region selection at tissue-level via deep instance-based detection and segmentation model, (2) blob analysis, and
(3) mitotic region enhancement at cell-level via deep CNN classifier to establish the balance between detection
rate and precision. Blob analysis is used as a post-processing step of detection module to prepare the input for
cell-level classification phase.
The performance of the proposed detection module is evaluated for the maximum number of true mitoses
against the small fraction of false positives (non-mitosis). Discrimination power is assessed on an independent
test set, which was kept separate during the training and validation (Table 2). The generalization capacity is
assessed by evaluating the proposed model on the test set with colour, contrast, and position variations.
Label‑refiner results. TUPAC16 dataset is provided only with centroid information of the mitotic nuclei,
which is not sufficient for the training of supervised machine learning models, therefore, we used label-refiner to
automatically annotate mitoses on tissue patches corresponding to 10 HFP area (results are shown in Fig. 10a).
Mitosis annotation using blue-ratio binary thresholding produces imprecise annotation (Fig. 10b) because of
shape irregularity and different configurations of mitosis in different phases of cell division (shown in Fig. 1).
These labels are not sufficient for the effective training of the deep supervised detection model. Besides, manual
annotation is not possible because of time-constraint. The performance of the supervised machine learning
algorithms is dependent on the quality of the labels therefore, in label-refiner, we used Mask R-CNN to precisely
define the morphology of the mitoses. We tried to avoid the loss of information by assigning semantic meaning
via. circular annotator for those mitosis that were not segmented by the Mask R-CNN.
Results of mitosis detection at tissue‑level. Mitosis detection is quite challenging due to small size,
heterogeneous morphology, overlapping appearance, and their sparse representation. Relative abundance of
non-mitotic nuclei undermines the performance of the detection model and makes it bias towards the class with
large number of instances. The main challenge is to accurately identify the true mitotic nuclei with a minimum
number of false positives. Therefore, initially, probable mitotic regions were isolated to reduce non-mitoses. For
this purpose, detection module based on Mask R-CNN was fine-tuned on the training dataset with refined labels
so that the maximum number of mitoses were retained with a minimum false positive rate. The results of the
detection model on the test dataset are shown in Fig. 11. The distinct feature of Mask R-CNN is that it initially
screens the candidate regions; subsequently, detection and segmentation algorithm is applied only to selected
regions to distinguish the mitosis from other cellular components. The advantage of detection of candidate
mitotic regions at tissue level is to reduce the class imbalance between mitosis vs. non-mitosis examples while
persisting hard examples that mimic the mitosis representation. This results in relatively balanced dataset with
loss of only two mitoses on test set (results are shown in Table 5).
Results of mitosis classification at cell‑level. In the proposed detection technique, after getting prob-
able mitotic regions from the detection model, the output is assigned to a classifier to enhance the final detection
Scientific Reports | (2021) 11:6215 | https://doi.org/10.1038/s41598-021-85652-1 12
Vol:.(1234567890)www.nature.com/scientificreports/
Figure 11. Results of the mitosis detection module at tissue-level, orange box highlights the true predictions
whereas red box shows the false positive predictions (non-mitosis).
Detection model Precision Recall
Proposed Mitosis detection module 0.1 0.98
Wahab et al.*37 0.07 0.92
Table 5. Results of mitosis detection at tissue-level.
by reducing the false positives. For the refinement of detection results, different classifiers are evaluated that are
discussed below. The classifier’s performance is assessed using an F-score, which is a criterion suggested by all
mitosis detection challenges because of the imbalanced nature of the dataset. Moreover, true positive detection
rate and precision are also considered to evaluate the overall performance. The PR curve is used for the evalua-
tion of the discrimination power of the model at different threshold values.
Mitosis classification using conventional classifiers. Initially, the potential of conventional machine
learning algorithms such as SVM, Logistic Regression, Decision Tree, Naïve Bayes, Random Forest, and XGboost
were evaluated for the discrimination of mitotic nuclei. These classifiers were trained and validated on prob-
able mitotic cells of train and validation sets (Table 2), respectively that were generated from detection model
(Fig. 7b). The performance analysis on test images in terms of F-score suggests that conventional classifiers do
not have enough representation ability to discriminate between two classes (results are shown in Table 6). The
probable reason for poor performance was the complex nature of data; moreover, such classifiers’ performance
is highly dependent upon the feature space of training data.
Mitosis classification using state‑of‑the‑art deep CNNs. In literature, several state-of-the-art
deep CNN architectures are proposed that have shown convincing performance on a very large image dataset,
ImageNet34,35,45,49,50. In this work, we have evaluated the potential of these architectures by adding additional
Scientific Reports | (2021) 11:6215 | https://doi.org/10.1038/s41598-021-85652-1 13
Vol.:(0123456789)www.nature.com/scientificreports/
F-score ± S.E Precision Recall F-score ± S.E Precision Recall F-score ± S.E Precision Recall
Classification model RGB LBP HOG
SVM 0.21 ± 0.023 0.14 0.37 0.26 ± 0.025 0.35 0.20 0.18 ± 0.022 0.13 0.28
Logistic Regression 0.15 ± 0.020 0.10 0.33 0.1 ± 0.017 0.1 0.12 0.17 ± 0.021 0.39 0.10
Naïve bayes 0.12 ± 0.018 0.09 0.23 0.18 ± 0.022 0.44 0.11 0.14 ± 0.020 0.38 0.087
Decision Tree 0.19 ± 0.022 0.13 0.40 0.16 ± 0.021 0.42 0.10 0.14 ± 0.020 0.379 0.09
Random Forest 0.18 ± 0.022 0.25 0.14 0.19 ± 0.022 0.15 0.25 0.05 ± 0.012 0.03 0.11
XGBoost 0.34 ± 0.027 0.29 0.40 0.22 ± 0.024 0.15 0.39 0.10 ± 0.017 0.08 0.12
Table 6. Performance analysis of classical classifiers on test dataset.
Classification model F-score ± S.E Precision Recall
Mit-VGG 0.67 ± 0.027 0.61 0.74
Mit-ResNet 0.71 ± 0.026 0.66 0.77
Mit-DenseNet 0.72 ± 0.026 0.65 0.82
Mit-ResNext 0.72 ± 0.026 0.68 0.75
Mit-SeNet 0.66 ± 0.027 0.64 0.69
Mit-PolyNet 0.65 ± 0.027 0.58 0.74
Table 7. Performance of the state-of-the-art CNN adapted via cross-domain TL on test dataset.
Classification Model Model type F-score ± S.E Precision Recall
Proposed MitosEns-CNN* CNN based ensemble 0.75 ± 0.025 0.734 0.768
Proposed MitosRes-CNN* CNN 0.73 ± 0.025 0.70 0.76
Existing Techniques Model Type F-score Precision Recall
Wahab et al.*37 CNN based ensemble 0.713 0.77 0.66
Li et al.15 CNN 0.717 – –
Paeng et al.30 CNN based ensemble 0.73 – –
Akram et al.36 – 0.65 0.68 0.62
Mahmood et al.51 CNN based ensemble 0.64 – –
Table 8. Performance comparison of the proposed model with existing techniques on test dataset of
TUPAC16 auxiliary dataset, whereas (*) shows same patient distribution in the test set.
layers and fine-tuned them on the mitosis dataset using the backpropagation algorithm. The results of state-of-
the-art deep CNNs: VGG, ResNet, DenseNet, ResNext, SENet and PolyNet are mentioned in Table 7.
Mitosis classification using the proposed deep MitosRes‑CNN. Proposed deep “MitosRes-CNN”
is trained from scratch on the mitosis dataset using the backpropagation algorithm, and it was evaluated on test
images (Table 2). The results of deep CNN are shown in Table 8 and Fig. 12. The performance comparison of the
proposed “MitosRes-CNN” with state-of-the-art CNNs (Tables 7 & 8) suggests that the proposed model is good
in discrimination (F-score: 0.73) of mitoses with significant precision (0.70), recall (0.76), and AUC of PR curve
(0.78). The primary objective is that the proposed model “MitosRes-CNN” shows good generalization when
applied to different variations of datasets. Therefore, generalization of the proposed detection model is evaluated
by assigning a dataset generated through semantic s egmentation29 that was not made part of the training set.
Moreover, the performance of the proposed classifier is evaluated on position variant, colour, and contrast vari-
ant examples (Table 9). The significant detection rate with adequate precision (Table 9) on various datasets sug-
gests that proposed deep “MitosRes-CNN” has invariant feature learning ability and is robust against variations.
Mitosis classification via consensus of multiple classifiers. For reliable analysis of histopathological
images, usually, a decision is taken from more than one pathologist. Moreover, most of the proposed mitosis
detection models in the literature are ensemble-based. To emulate the pathological process, we proposed score
level fusion from multiple classifiers. Therefore, each sample is assigned a class by taking a confidence score
from three different classifiers: MitosRes-CNN, Mit-DenseNet, and Mit-ResNext and a final decision is made
based on the highest confidence score. The proposed ensemble of CNNs “MitosEns-CNN” results in improved
Scientific Reports | (2021) 11:6215 | https://doi.org/10.1038/s41598-021-85652-1 14
Vol:.(1234567890)www.nature.com/scientificreports/
Figure 12. Discrimination analysis via PR curve.
Variation type Detection rate Precision
Position variation 0.83 0.66
Contrast variation 0.70 0.69
Brightness variation 0.70 0.66
Saturation variation 0.72 0.67
Dataset from Wahab et al.29 0.73 0.62
Table 9. Robustness of the proposed MitosRes-CNN on various datasets.
performance (Table 8) in terms of F-score (0.75), precision (0.73), recall (0.768), and discrimination ability
(AUC: 0.78).
Discussion
In this work, we have developed a deep CNN based multi-phase mitosis detection framework “MP-MitDet” for
Breast cancer histopathological images. The automation of histopathology based analysis of mitotic nuclei can
lessen the workload of pathologists and time cost of manual count.
In this work, we have proposed a new labelling scheme to generate pixel-level annotations for centroid
annotated images. The proposed label-refiner combines precise morphological information with semi-semantic
information. This annotation scheme overcomes the downsides of thresholding based technique used by different
researchers37, which resulted in many disconnected false-positive blobs and overlooked true positives. Likewise,
circular labelling s cheme15,16,53 is unable to provide complete morphological information. In our work, the label-
refiner improves the labels by exploiting the prediction maps generated by deep instance based segmentation
model Mask R-CNN. Whereas, the mitoses that are missed by the Mask R-CNN are represented via pseudo
labels to assign them semantic meaning in the form of circular annotations. This thus results in a combination
of both fine-grained information gathered from exact morphology learned via Mask R-CNN and coarse-level
information incorporated from circular labels. The addition of pseudo-labels in alliance with explicit mitotic
representation adds randomness, which improves the generalization of a deep learning model by preventing
them from memorizing specific shape.
We have performed the mitosis detection on histopathological images by discriminating both on tis-
sue and cell-level. The main bottleneck in the development of an automated detection system is intra-class
heterogeneity4,54 and class imbalance. The analysis at two different levels addresses the challenge of accurately
identifying mitoses with minimum number of false negatives while reducing class imbalance. The first stage that
determines the probable mitotic regions by analysing the 10 HPF tissue region excludes the undesired tissue
stoma and a large proportion of non-mitotic nuclei and other organelles similar to mitosis5.
The significance of employing Mask-RCNN at firsts stage is that it is an instance based segmentation and
detection approach, which marks each mitosis separately from the others. The instance level analysis makes
Mask R-CNN more appropriate for this problem compared to semantic segmentation. Semantic segmentation
performs pixel-wise classification and treats each mitosis as a group of objects. Moreover, the output of semantic
segmentation requires post-processing to categorize set of clustered objects as single mitosis and distinguish
each mitosis from one another.
In the second stage of detection, a classifier is used to categorize the selected cells as either mitosis or non-
mitosis. The advantage of this stage is that it reduces the false positives and improves the precision by learning
Scientific Reports | (2021) 11:6215 | https://doi.org/10.1038/s41598-021-85652-1 15
Vol.:(0123456789)www.nature.com/scientificreports/
the characteristic features of mitosis and hard-to-classify negative examples. We have proposed a simple yet deep
CNN “MitosRes-CNN” for the classification. As selected cells are small in size (80 × 80 pixels) and complex in
the pattern, therefore, a complex architecture with a large number of filters can lead to overfitting on the training
dataset. The exploitation of multiple transformation in a simple way with the idea of the effective receptive field
and residual learning in the proposed CNN helps in learning abstractions at different levels while maintain-
ing good generalization. Additionally, the comparison of the proposed MitosRes-CNN with state-of-the-art
CNN architectures (Tables 7 and 8) suggests that it was possible to positively train the custom deep CNN on a
moderately-sized training set of 61 patients without transfer learning.
This study also demonstrated that the state-of-the-art CNN architectures designed for non-medical tasks
could be effectively adapted for mitosis detection by adding task-specific layers, selecting appropriate hyperpa-
rameters, and finetuning them via cross-domain TL. We have further shown that the exploitation of the learn-
ing experiences of different deep CNN architectures through decision score based ensemble can result in the
significant gain in F-score, precision, and recall.
The multi-phase detection framework proposed in this work is simple in design and different from approaches
reported in literature28,30 who also performed detection at two levels. The aforementioned approaches passed the
segmented output to the classifier in the first phase to identify the hard negative examples. In the second step,
easy-to-classify negatives examples are undersampled in the training data, while hard examples are augmented.
Contrary to this, in our proposed “MP-MitDet” approach, we have performed cell-level classification for output
of the detection phase without additionally mining the hard instances. The promising performance of the pro-
posed “MP-MitDet” approach on the TUPAC16 dataset in terms of F-score, recall, and precision compared with
the existing techniques (Table 8) and on various combinations of datasets (Table 9) suggests good generalization
ability. The proposed approach has still a margin of improvement. In this study, a simple score fusion-based
ensemble approach is targeted; however, the potential of advance ensemble learning techniques will be explored
in the future. Moreover, the learning capacity of different CNNs can be exploited by combining feature spaces of
diverse CNN architectures and assigning their output to meta-classifier for final decision.
Conclusions
According to the Nottingham grading scheme, the mitosis count is the fundamental prerequisite of breast cancer
tumour grading and proliferation rate. In this work, we proposed a deep multi-phase mitosis detection frame-
work, “MP-MitDet,” for mitosis discrimination on H&E stained breast tissue histology images. The promising
performance of “MP-MitDet” in terms of F-score of 0.73 and 0.75 for custom and ensemble-based CNNs, respec-
tively suggests the effectiveness of solving complex problem at multiple levels. We have shown that the refinement
of weakly annotated labels with semantic level labels and segregation of numerous non-mitotic nuclei at tissue
level with Mask R-CNN helps in attaining high mitosis detection rate (0.98) with low density of false mitosis
examples. The challenges of heterogeneous mitotic morphologies and inter-class resemblance are resolved by
developing custom CNN “MitosRes-CNN” that enhance the results by significantly reducing mitosis-like-hard
example with a significant precision (0.70 for custom, 0.73 for ensemble based CNN) on the test dataset. Promis-
ing performance of the proposed “MP-MitDet” on different variations of dataset and its comparison with existing
techniques suggests its good generalization and potential to learn characteristic features of mitosis. In future,
it can be adapted to reduce the decision space of the pathologist by suggesting the probable mitotic regions.
Data availability
All the datasets used in this work are publicly available, whereas datasets that are generated or analysed during
labeling, detection and classification are available from the corresponding author on reasonable request.
Received: 14 July 2020; Accepted: 16 February 2021
References
1. Bray, F. et al. Global cancer statistics 2018: GLOBOCAN estimates of incidence and mortality worldwide for 36 cancers in 185
countries. CA. Cancer J. Clin. 68, 394–424 (2018).
2. Veta, M., Van Diest, P. J., Jiwa, M., Al-Janabi, S. & Pluim, J. P. W. Mitosis counting in breast cancer: Object-level interobserver
agreement and comparison to an automatic method. PLoS ONE https://doi.org/10.1371/journal.pone.0161286 (2016).
3. Elston, C. W. & Ellis, I. O. Pathological prognostic factors in breast cancer. I. The value of histological grade in breast cancer:
experience from a large study with long-term follow-up. Histopathology 19, 403–410 (1991).
4. Das, A., Nair, M. S. & Peter, S. D. Computer-aided histopathological image analysis techniques for automated Nuclear atypia scor-
ing of breast cancer: a review. J. Digi. Imaging https://doi.org/10.1007/s10278-019-00295-z (2020).
5. Elmore, J. G. et al. Diagnostic concordance among pathologists interpreting breast biopsy specimens. J. Am. Med. Assoc. (JAMA)
313, 1122–1132 (2015).
6. Janowczyk, A. & Madabhushi, A. Deep learning for digital pathology image analysis: A comprehensive tutorial with selected use
cases. J. Pathol. Inform. https://doi.org/10.4103/2153-3539.186902 (2016).
7. Hägele, M. et al. Resolving challenges in deep learning-based analyses of histopathological images using explanation methods.
Sci. Rep. 10, 1–12 (2020).
8. Bychkov, D. et al. Deep learning based tissue analysis predicts outcome in colorectal cancer. Sci. Rep. 8, 1–11 (2018).
9. Khan, A., Sohail, A., Zahoora, U. & Qureshi, A. S. A survey of the recent architectures of deep convolutional neural networks.
Artif. Intell. Rev. https://doi.org/10.1007/s10462-020-09825-6 (2020).
10. Araujo, T. et al. Classification of breast cancer histology images using convolutional neural networks. PLoS ONE https://doi.
org/10.1371/journal.pone.0177544 (2017).
11. Esteva, A. et al. Dermatologist-level classification of skin cancer with deep neural networks. Nature https://doi.org/10.1038/natur
e21056 (2017).
Scientific Reports | (2021) 11:6215 | https://doi.org/10.1038/s41598-021-85652-1 16
Vol:.(1234567890)You can also read