A Morphological and Size-Based Study of the Changes of Iron Sulfides in the Caples and Torlesse Terranes (Otago Schist, New Zealand) during ...
←
→
Page content transcription
If your browser does not render page correctly, please read the page content below
minerals
Article
A Morphological and Size-Based Study of the
Changes of Iron Sulfides in the Caples and Torlesse
Terranes (Otago Schist, New Zealand) during
Prograde Metamorphic Evolution
Victor Cardenes 1,2, * , Raúl Merinero 3 , Álvaro Rubio-Ordoñez 1 , Veerle Cnudde 2 ,
Javier García-Guinea 4 and Iain K. Pitcairn 5
 1   Geology Department, Oviedo University, C/Jesús Arias de Velasco s/n, Oviedo, 33005 Asturias, Spain;
     rubioalvaro@uniovi.es
 2   Pore-scale Processes in Geomaterials Research Team (PProGRess), Ghent University, Krijgslaan 281 (S8),
     9000 Ghent, Belgium; Veerle.Cnudde@UGent.be
 3   Mineralogy and Petrology Department, Complutense University of Madrid, Avda. Complutense s/n,
     28040 Madrid, Spain; rmeriner@ucm.es
 4   National Museum of Natural History, Jose Gutierrez Abascal 2, 28006 Madrid, Spain; guinea@mncn.es
 5   Department of Geological Sciences, Stockholm University, SE-10691 Stockholm, Sweden;
     iain.pitcairn@geo.su.se
 *   Correspondence: cardenesvictor@uniovi.es

 Received: 6 April 2020; Accepted: 14 May 2020; Published: 19 May 2020

 Abstract: It is widely accepted that metamorphism induces a remobilization of iron sulfides, sweeping
 away original ones while creating new ones. This paper analyzes size distributions of iron sulfides in
 several samples from the Caples and Torlesse terranes from the Otago Schist (New Zealand) using
 high-resolution X-ray computed tomography, which allows all iron sulfides larger than the resolution
 at which X-ray scans were performed to be characterized. Framboids and clusters of framboids are
 common in unmetamorphosed samples, but disappear in greenschist/amphibolite facies samples,
 where iron sulfides have anhedral habits. By contrast, the size and standard deviation of the new
 iron sulfides both remain within the same range. The results illuminate the evolution of iron sulfides
 throughout metamorphism, proposing boundaries for the metamorphic processes based on the shape
 of these iron sulfides.

 Keywords: micro-pyrite; framboids; micro-tomography; size distribution; morphological evolution

1. Introduction
     Microscopic iron sulfides (mainly pyrite and pyrrhotite, together with marcasite and greigite) can
be found in many geological environments under a wide range of morphologies, from framboids to
anhedral and euhedral crystals. Almost ubiquitous in sedimentary and metamorphic environments,
iron sulfides can provide an accurate record of the many geological processes that affected the rock
during its geological history. Moreover, iron sulfides are known to be efficient scavengers of trace
elements that, in many cases, have a significant economic value. Many papers have studied the genesis,
geochemical evolution, geological meaning and occurrence of iron sulfides. However, the turning
points in this line of research are two studies by Wilkin and co-workers [1,2] who proposed a feasible
model for framboidal pyrite formation. They also proposed a method to infer paleo-redox conditions
using the size distributions of framboids. In the years since, other authors have continued working with
populations of framboidal pyrite [1–7] applied to the determination of paleo-conditions. Of the diverse

Minerals 2020, 10, 459; doi:10.3390/min10050459                                 www.mdpi.com/journal/minerals
Minerals 2020, 10, 459                                                                                2 of 9

factors controlling framboid growth and morphology, the most important are reactant concentration,
temperature and time [1–9].
      There are three main approaches to the study of iron sulfides: isotope analysis, trace element
analysis, and the previously mentioned size distribution characterization. Isotope analysis generally
focuses on the relationships between sulfur isotopes, as well as other isotopes found in the host rock.
Trace element analysis is useful for charting the remobilization of elements throughout diagenesis
and metamorphism. Finally, size distribution techniques are based on the study of the size and
abundance of the micro-pyrites (MPy). Isotope and trace element analysis provides information
about geochemistry, while size distribution is useful in order to infer the paleo-conditions. This latter
method, size distribution analysis, mainly uses SEM to characterize the MPy populations. However,
there are two issues related to this technique: the representativeness of the volume scanned and the
underestimation of the true diameter, as it involves measuring a 3D object via a 2D surface. Recently,
high-resolution X-ray computed tomography (MCT) [10], together with statistical analysis based on
Gaussian finite mixture models, have been used to characterize the size and abundance of iron sulfide
populations [11–14]. This method allows the populations of iron sulfides to be measured in 3D, in a
fast and accurate way, preventing possible errors due to the 2D observation of sections as performed in
SEM studies. Although for some authors this difference amounts to less than 10% [15], the truth is that
comparing SEM versus MCT for MPy determination [12] yielded 1513 objects determined by SEM and
14,170 objects determined by MCT, which in fact amounts the difference up to 90%.
      Iron sulfides are suggested to undergo a change in size, shape and distribution as one passes from
diagenesis to metamorphism, together with changes in mineralogy and isotopic relationships [16–20].
This size increase can be the result of the growth of new iron sulfides, or of the aggregation of the
existing iron sulfides. In a recent paper [13] we have shown that low-grade metamorphism prompts
the development of new populations of framboids in pelitic rocks as metamorphic conditions change.
The transition from diagenetic to metamorphic conditions creates new populations of framboids [12],
which have the same morphology as sedimentary framboids [21] and therefore cannot be distinguished
from them. A proper statistical analysis would highlight these new populations and mark the transition
between diagenesis and metamorphism. However, these studies involve a certain degree of uncertainty
regarding the samples’ composition, as the rocks used are from different formations, which could
influence the results.
      The present study uses selected samples from the previous research of Pitcairn et al. 2010 [22],
in the Caples and Torlesse terranes from the Otago and Alpine Schists in New Zealand, which are a
metasedimentary pelitic sequence exhibiting unmetamorphosed greywackes up to rocks equilibrated
under amphibolite facies [23]. These terranes have different provenance. Caples terrane is located
to the south and west of the Otago Schist, and it is composed mainly of volcanoclastic greywacke,
while Torlesse terrane, located to the north and east, is formed by quarzofeldespathic greywacke and
argillite [24]. This sequence constitutes an exceptional test bench for metamorphic petrologists, since it
makes it possible to observe the effects of prograde metamorphism on a single lithology. The Otago
Schist is part of a Mesozoic metasedimentary belt that formed during the collisions of the Torlesse and
Caples terranes in the Mesozoic. The schists comprise dominantly meta-greywackes and metapelites.
The metamorphic grade increases from unmetamorphosed rocks of the Torlesse and Caples terranes on
the flanks of the belt, to greenschist facies rocks in the central part. In [22], samples were analyzed for
their geochemical compositions using low detection limit techniques and results show that a specific
suite of elements including Au, As, and Sb are progressively mobilized from the rock during prograde
metamorphism from unmetamorphosed graywacke to amphibolite facies condition. Driving forces for
element mobility are temperature and progressive change from trace element-rich diagenetic pyrite that
dominates in low metamorphic grade conditions to trace element poor pyrrhotite that is the dominant
sulfide in upper greenschist and amphibolite facies. These sulfide minerals undergo systematic changes
in size and texture during metamorphism that are similar to those recorded in other areas [17,20,25,26].
However, to our knowledge, these changes have not been quantified previously. Our work takes as its
original size distributions. The applied methodology can discriminate between these sub-
  populations depending on geometrical parameters. The sphericity parameter was determined in
  order to differentiate between sub-populations based on their morphology, using the program
  ImageJ v.1.52i with the plugins 3D Fast filters and RoiManager3D v.3.92. The 3D Fast filters obtain
  descriptive statistical data in 3D (3D average, median, minimum, maximum, etc.), while
Minerals 2020, 10, 459                                                                                    3 of 9
  RoiManager3D can determine the geometrical parameters (volume, sphericity, ellipsoid fitting, etc.)
  used to segregate the MPy subpopulations. More details about this process can be found in [11–14].
  According
starting       to [27],
           point        an average
                   the textural     sample volume
                                observations        scanned samples
                                               and selected  by MCT is  much
                                                                      from     larger
                                                                            [22]      than thethe
                                                                                 to evaluate   representative
                                                                                                  evolution of
  elementary
the             volumeof(REV).
     size and texture             This REV
                            iron sulfides   depends
                                          over       on the
                                               the course of occurrence and size of the using
                                                             prograde metamorphism       measured   property.
                                                                                               high-resolution
X-ray computed tomography with statistical analysis of log-normal populations, complementedofby
  For  MPy,   previous    works   [12–14] have  concluded  that the REV  is  achieved   when  the number
  objects
SEM        is above 600–1000. The size and distribution of the MPy can be adjusted to a log-normal
       observations.
  distribution, according to the Crystal Size Distribution (CSD) and the law of proportionate effect [28],
2.which
   Materials    andhow
          explains     Methods
                          a crystal population tends to grow in proportion to its size. Several authors have
  demonstrated that MPy populations follow log-normal distributions [1,29].
      High-resolution X-ray computed tomography makes it possible to distinguish rock-forming minerals
        In order to complement the size population analyses, SEM observations were carried out using
depending on their attenuation coefficient to X-radiation. Each mineral has a different attenuation
  a Hitachi TM3000 Tabletop Microstructure, with an EDS Bruker Quantax 70 analyzer. The
coefficient (Figure 1), which can be represented in a greyscale image of the sample. Representative
  observations were carried out on thin polished sections of the samples. This equipment is located at
samples for each metamorphic stage (Table 1) from the Torlesse and Caples terranes were selected.
  Gea Asesoría Geológica (www.geaasesoriageologica.com) in Asturias, Spain.

      Figure1.1.Linear
     Figure      Linearattenuation
                        attenuationcoefficients
                                    coefficientsofofthe
                                                     theminerals
                                                         mineralsfound
                                                                  foundininthe
                                                                            thesamples.
                                                                                samples.The
                                                                                         Thevoltage
                                                                                             voltageofofthe
                                                                                                          theX-ray
                                                                                                              X-
      ray tube  was 130
     tube was 130 kV.    kV.

               Samples
     Table 1.and
 3. Results            selected from [22]. GW: Greywacke; Psa: Psammite; Pel: Pelite; QFS: Feldspar
                 Discussion
     quartzite; un-met: unmetamorphosed; GS: Greenschist grade. The population analysis shows the
      As pointed out above, MCT distinguishes objects based on the difference of their attenuation
     following data for the sub-populations: mean, standard deviation (SD), percentage of objects (%n) and
 coefficient,  which depends in turn on their mineralogical composition. The greater this difference,
     percentage of volume (V) from the total population. Bottom rows show total volume and number of
 the objects
     higher for
              theeach
                  contrast will be. Our samples exhibit a great deal of mineralogical diversity, making
                      sample.
 them more difficult to study. The main minerals [22] are silicates (quartz, plagioclase, K-feldspar and
    Sample
 phyllosilicates), A6
                   with some A4            A5
                                accessory minerals      C46ilmenite,A1
                                                      like           zircon andA3titanite. The
                                                                                             C56 sulfidesC72
                                                                                                           are
 pyrite  (up to 0.1%)
    Terrane      Caplesand pyrrhotite
                            Caples     (up  to 0.4%), Torlesse
                                         Caples        with smallTorlesse
                                                                  percentages   of chalcopyrite,
                                                                              Torlesse     Torlesse sphalerite,
                                                                                                       Torlesse
 galena   and cobaltite.
   Lithology   GW un-mt ThePelabundance
                               sb-GS    Pelof these GW
                                           sb-GS    minerals
                                                         un-mt depends
                                                                Psa sb-GSon the   specific QFS
                                                                             Pel sb-GS     composition
                                                                                                GS     QFSand
                                                                                                            GS
                                                 Population Analysis
 P1(mean,SD)      9.6(1.7)     9.7(1.8)      9.8(1.8)   11.5(3.2)      10.2(2.1)    12.5(3.6)     9.9(1.9)     7.7(0.5)
    (%n,V)        31.6,2.5     22.3,0.5     20.2,0.5    43.9,96.7       24.1,0.6     36.3,5.1     33.4,1.8     12.5,0.7
 P2(mean,SD)     15.3(4.6)    13.7(2.8)    13.9(2.2)    25.4(14.3)     18.7(6.3)    23.3(6.6)    15.2(4.6)     9.8(0.6)
    (%n,V)       45.1,15.4     22.7,1.4     20.0,1.2    56.1,97.7       34.4,5.7    52.1,40.1     34.4,7.0     20.7,1.8
 P3(mean,SD)     27.7(14.7)    23.8(6.2)    19.5(2.9)       –          40.3(21.5)   44.7(12.7)   30.2(16.6)   11.7(1.1)
    (%n,V)       23.4,82.1     25.4,6.4     17.2,2.7        –          41.5,93.7    11.7,54.7    32.2,91.3     14.5,1.9
 P4(mean,SD)         –        33.5(24.8)    27.7(6.4)       –              –            –            –        13.3(1.7)
    (%n,V)           –        29.6,91.6     18.2,8.3        –              –            –            –         14.1,2.8
 P5(mean,SD)         –             –       25.7(14.4)       –              –            –            –        20.0(6.8)
    (%n,V)           –             –       24.4,87.3        –              –            –            –        25.9,22.3
 P6(mean,SD)         –             –            –           –              –            –            –        32.0(18.1)
    (%n,V)           –             –            –           –              –            –            –        12.2,70.5
 Tot.(mean,SD)   27.7(14.7)    21.9(0.6)   24.3(18.9)   19.5(14.5)                  21.9(12.0)   18.3(13.5)   15.7(10.1)
    (%n,V)       (100,100)    (100,100)    (100,100)    (100,100)      (100,100)    (100,100)    (100,100)    (100,100)
  Vol. (mm3 )       43.1        152.8         204.0       114.2          190.2         41.1         45.8        194.1
    Objects        4358          4219         5036        5623           4871         2568         2744         12611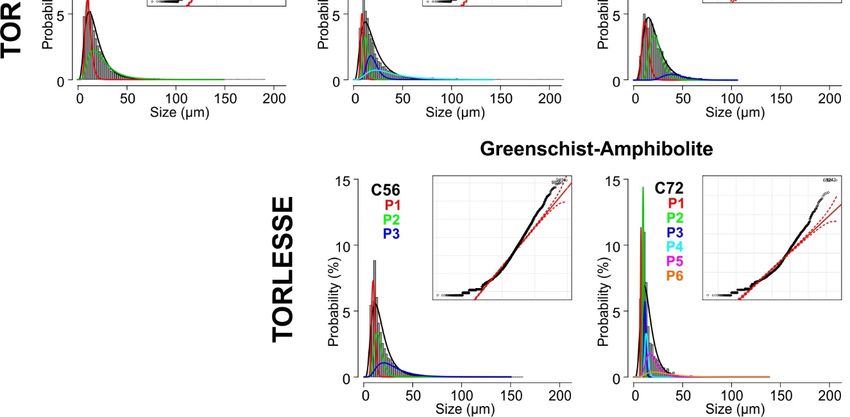
Minerals 2020, 10, 459                                                                                4 of 9

      For each sample, cylinders of 4 mm diameter × 8–10 mm length were taken. These cylinders
were scanned at the HECTOR facility, a versatile research tomograph instrument located at the Centre
for X-ray Tomography (UGCT) at Ghent University (Ghent, Belgium). Tube power was set to 10 W,
with a high voltage of 130 kV. For each cylinder, over eighteen hundred projections were taken during a
complete rotation along the vertical axis. The resolution achieved was 3 µm. Projections were rendered
into a 3D volume using the program Octopus Reconstruction v.8.8.2. The resulting images were analyzed
with the software ImageJ, obtaining datasheets corresponding to the size distributions. Using the
methodology detailed in [14], these datasheets were then analyzed using the statistical software R v.3.4.3.
and the mclust package v.5.4.1. The total size distribution is then separated into sub-populations that
follow thereby locating the mixtures of sub-populations in the original size distributions. The applied
methodology can discriminate between these sub-populations depending on geometrical parameters.
The sphericity parameter was determined in order to differentiate between sub-populations based on
their morphology, using the program ImageJ v.1.52i with the plugins 3D Fast filters and RoiManager3D
v.3.92. The 3D Fast filters obtain descriptive statistical data in 3D (3D average, median, minimum,
maximum, etc.), while RoiManager3D can determine the geometrical parameters (volume, sphericity,
ellipsoid fitting, etc.) used to segregate the MPy subpopulations. More details about this process can be
found in [11–14]. According to [27], an average sample volume scanned by MCT is much larger than the
representative elementary volume (REV). This REV depends on the occurrence and size of the measured
property. For MPy, previous works [12–14] have concluded that the REV is achieved when the number
of objects is above 600–1000. The size and distribution of the MPy can be adjusted to a log-normal
distribution, according to the Crystal Size Distribution (CSD) and the law of proportionate effect [28],
which explains how a crystal population tends to grow in proportion to its size. Several authors have
demonstrated that MPy populations follow log-normal distributions [1,29].
      In order to complement the size population analyses, SEM observations were carried out using a
Hitachi TM3000 Tabletop Microstructure, with an EDS Bruker Quantax 70 analyzer. The observations
were carried out on thin polished sections of the samples. This equipment is located at Gea Asesoría
Geológica (www.geaasesoriageologica.com) in Asturias, Spain.

3. Results and Discussion
     As pointed out above, MCT distinguishes objects based on the difference of their attenuation
coefficient, which depends in turn on their mineralogical composition. The greater this difference,
the higher the contrast will be. Our samples exhibit a great deal of mineralogical diversity, making
them more difficult to study. The main minerals [22] are silicates (quartz, plagioclase, K-feldspar and
phyllosilicates), with some accessory minerals like ilmenite, zircon and titanite. The sulfides are pyrite
(up to 0.1%) and pyrrhotite (up to 0.4%), with small percentages of chalcopyrite, sphalerite, galena and
cobaltite. The abundance of these minerals depends on the specific composition and metamorphic
grade of each sample. While the overall mineralogy allows for effective differentiation between the
main minerals and iron sulfides, the occurrence of accessory minerals with similar sizes to the iron
sulfides could introduce a miscalculation in the MCT results. However, the filtering method used is
capable of segregating objects by shape, removing minerals with morphologies that do not match the
target objects. The only mineral that could induce this error is ilmenite, if shape analysis does not
allow its differentiation from iron sulfides, because it has a rather similar attenuation coefficient to
iron sulfides (Figure 1). However, ilmenite is only found in unmetamorphosed greywackes, being
replaced by titanite during further metamorphism, and therefore its abundance was considered not
to be significant enough to alter the results. The morphological and statistical analyses showed no
notable evidence in this respect.
     Following the methodology of [14], a general population of spherical and isomorphic objects
was obtained for each sample. Objects from the lower size intervals (2–16 µm) were filtered in order
to reduce noise and artifacts of the equipment. The Caples and Torlesse terranes did not show
significant differences in terms of lithology. Rather, differences are linked to the metamorphism.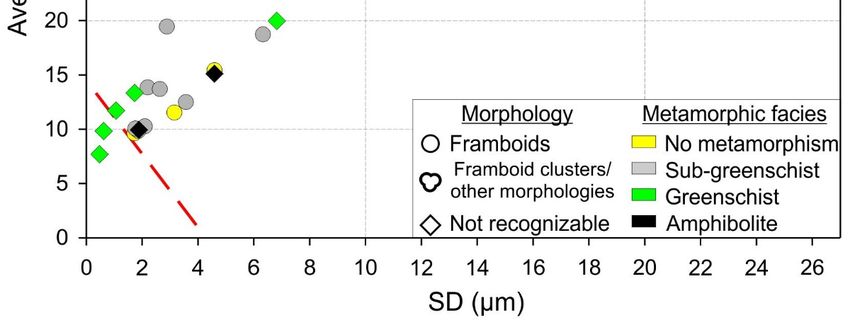
Minerals 2020, 10, 459 5 of 9
For the unmetamorphosed samples, this general population clearly corresponded to a log-normal
population for low and medium sizes (see QQ plots in Figure 2). In the sub-greenschist facies
samples, this correspondence is less accurate, and greenschist-amphibolite facies samples lack such
correspondence altogether. The analysis of the log-normal population mixtures (general populations)
conducted using the mclust package indicated that the number of log-normal populations increases with
increasing metamorphism (Figure 2). This is to be expected, according to the mineralogical composition
of each sample as described in [22]. Pyrite is the most abundant sulfide in unmetamorphosed samples
(C46 and A6). In sub-greenschist samples (A1, A3, A4 and A5) the abundance of pyrrhotite, and to a
lesser extent chalcopyrite and sphalerite, increases. In samples from greenschist (C72) and amphibolite
facies (C56), there is essentially no pyrite, sphalerite and galena. Only pyrrhotite and chalcopyrite
are present, and therefore a higher number of log-normal populations of idiomorphic objects is to be
expected in the mixture of the general population. These mineralogical changes are therefore the result
of metamorphic recrystallization where new mineralogical phases form from the previous ones.
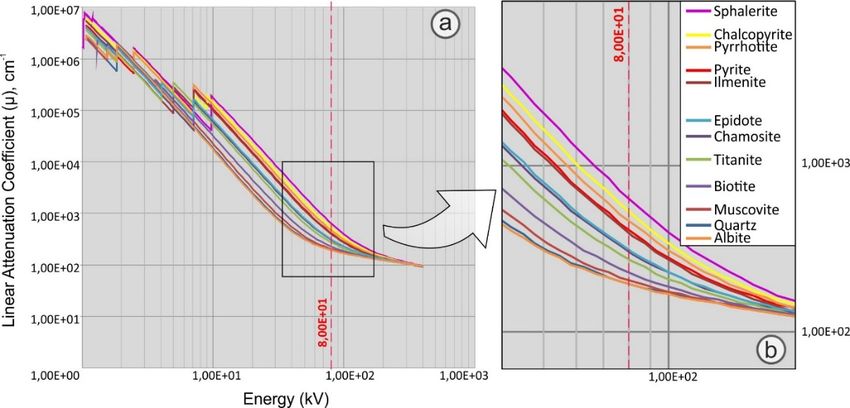
The correspondence between the log-normal populations detected with the mclust package and
the spherical or idiomorphic objects can be achieved using SEM observations of each sample, and 3D
reconstruction based on MCT images [14]. Figure 3 shows the main shapes detected with SEM and
several 3D reconstructions of individual objects. In unmetamorphosed samples, only framboids and
clusters of framboids were observed. Moreover, 3D reconstructions show individual framboids in
smaller Minerals 2020,
spherical 10, x FOR PEER REVIEW
objects. 6 of 10
Figure 2. Population size distributions and QQ plots. For the population graphics, the black curve is
Figure 2. Population size distributions and QQ plots. For the population graphics, the black curve is
obtained by high-resolution X-ray computed tomography (MCT), while color curves are the
obtained by high-resolution X-ray computed tomography (MCT), while color curves are the estimated
estimated with the statistical approach. QQ plots reflect the goodness of the fit of the calculated
with the statistical approach. QQ plots reflect the goodness of the fit of the calculated distribution
distribution (black curve) to the theoretical distribution (red curve).
(black curve) to the theoretical distribution (red curve).
Figure 2. Population size distributions and QQ plots. For the population graphics, the black curve is
       obtained by high-resolution X-ray computed tomography (MCT), while color curves are the
Minerals 2020, 10, 459                                                                                       6 of 9
       estimated with the statistical approach. QQ plots reflect the goodness of the fit of the calculated
       distribution (black curve) to the theoretical distribution (red curve).

      Figure 3. SEM and MCT images of selected samples. (a) Pyrite framboids, sample A6. (b) Pyrite
     Figure 3. SEM and MCT images of selected samples. (a) Pyrite framboids, sample A6. (b) Pyrite
      framboid partially dissolved and then surrounded by recrystallization of pyrite. (c) Two iron sulfides
     framboid partially dissolved and then surrounded by recrystallization of pyrite. (c) Two iron
      differentiated from the rest of the sample during the threshold stage of the image analysis. (d)
     sulfides differentiated from the rest of the sample during the threshold stage of the image analysis.
      Reconstructions of two objects: left, a euhedral-like object, and right, a framboid-like object.
     (d) Reconstructions of two objects: left, a euhedral-like object, and right, a framboid-like object.

     Therefore, log-normal populations, which make up the general population in unmetamorphosed
samples, were interpreted as framboids and clusters. In sample A6, the second log-normal population
interpreted as framboids, as well as the first population, probably grew out of previous framboids as
metamorphism progrades. Similar interpretations can be made in samples from the sub-greenschist
facies, where two populations of framboids corresponding to the lowest sizes are detected and
log-normal populations of clusters are also present. The progradation of metamorphism promotes
changes in the framboids’ morphologies and can even bring about their outright destruction. In samples
from the greenschist facies, the sulfides exhibit regular and rotated synkinematic textures in which the
outer zones of the grains truncate the foliation, which explains why log-normal populations with other
spherical shapes (euhedral) were detected.
     The graphic representation of average size against the standard deviation of the populations
of framboids constitutes a practical visual tool commonly used in paleoenvironmental studies
in order to characterize the environment [3]. This representation is used here to compare the
log-normal populations of iron sulfides detected in the analyzed metamorphic samples (Figure 4).
In unmetamorphosed samples and samples from the sub-greenschist facies, framboids and clusters
are dominant. Samples from the sub-greenschist facies show a slightly higher mean size for clusters,
probably because during metamorphism, dissolution and recrystallization phenomena might involve
the creation of new pore system with higher sizes. For samples from the greenschist and amphibolite
facies, there is not a describable morphology and no framboids were detected. Based on the mean and
standard deviation of the sizes plotting in the range of the detected framboids for unmetamorphosed
and sub-greenschist facies samples, we may conclude that these unrecognizable morphologies were
the consequence of the dissolution and/or transformation of earlier framboids. Framboids are always
formed under oxic conditions during metamorphism, and probably other spherical shapes as euhedral
crystals of pyrite were formed under anoxic conditions previous to the metamorphism, but no evidence
of this can be established with the study of morphologies of sulphides with MCT. Finally, there is not a
clear distinction between samples from the two terranes regarding subpopulations.
morphologies were the consequence of the dissolution and/or transformation of earlier framboids.
Framboids are always formed under oxic conditions during metamorphism, and probably other
spherical shapes as euhedral crystals of pyrite were formed under anoxic conditions previous to the
metamorphism, but no evidence of this can be established with the study of morphologies of
sulphides
Minerals with
2020, 10, 459MCT. Finally, there is not a clear distinction between samples from the two terranes
7 of 9
regarding subpopulations.
Figure4.4.Graph
Figure Graphofofaverage
averagesize
sizevs.
vs. standard
standard deviation.
deviation. The
The red
red dashed
dashedlinelineseparates
separatesthe
theanoxic
anoxic
(bottom)and
(bottom) andoxic
oxic(top)
(top)fields.
fields.This
This line
line is
is plotted
plotted as
as a
a reference,
reference, in
in order
order to
to compare
comparethis
thisgraph
graphwith
with
others used in sedimentology and paleoenvironmental studies. The small graphic in the upperleft
others used in sedimentology and paleoenvironmental studies. The small graphic in the upper left
cornershows
corner showssamples
samplesfrom
fromthe
theCaples
CaplesandandTorlesse
Torlesseterranes.
terranes.
4. Conclusions
Framboids and framboid clusters can be found in unmetamorphosed and sub-greenschist facies
samples, but as metamorphism increases (greenschist and amphibolite facies) there is a transformation
of the iron sulfides that leads to the erasure of these framboidal textures. Previous work has shown
that the prograde transition from diagenetic to metamorphic conditions creates new populations of
framboids [13]. This fact is confirmed here, where two log-normal populations of framboids were
detected in samples belonging to the sub-greenschist facies. A step further in low-degree metamorphic
conditions would create new iron sulfides formed without a defined morphology, but with an average size
and standard deviation within the same range as framboids and clusters. Therefore, this transformation
of framboids would specifically mark the transition between very low and low metamorphic conditions.
It is important to remark that these results have been found in a pelitic sequence. For other type of
rocks, these processes might be different. To clarify this point, further research is needed.
Author Contributions: Conceptualization, V.C. (Victor Cardenes), R.M. and I.K.P.; methodology, V.C.
(Victor Cardenes), R.M. and V.C. (Veerle Cnudde); software, R.M. and Á.R.-O.; validation, R.M., J.G.-G. and A.R.;
formal analysis, V.C. (Victor Cardenes) and Á.R.-O.; investigation, V.C. (Victor Cardenes); resources, A.R. and
J.G.-G.; data curation, I.K.P.; writing—original draft preparation, V.C. (Victor Cardenes); writing—review and
editing, V.C. (Victor Cardenes), R.M.; visualization, V.C. (Victor Cardenes); supervision, V.C. (Victor Cardenes);
funding acquisition, Á.R.-O. All authors have read and agreed to the published version of the manuscript.
Funding: This work has been funded by the project Marie Curie IEF 623082 TOMOSLATE, granted by the
European Research Council, and partially funded by the project PA-18-ACB17-11, from the Program Marie-Curie
COFUND funded by the European Union, Government of Asturias (Spain) and the Spanish FICYT.
Conflicts of Interest: The authors declare no conflict of interest. The funders had no role in the design of the
study; in the collection, analyses, or interpretation of data; in the writing of the manuscript, or in the decision to
publish the results.
References
1. Wilkin, R.T.; Barnes, H.L. Pyrite formation by reactions of iron monosulfides with dissolved inorganic and
organic sulfur species. Geochim. Cosmochim. Acta 1996, 60, 4167–4179. [CrossRef]
2. Wilkin, R.T.; Barnes, H.L. Formation processes of framboidal pyrite. Geochim. Cosmochim. Acta 1997, 61,
323–339. [CrossRef]Minerals 2020, 10, 459 8 of 9
3. Wignall, P.B.; Newton, R. Pyrite framboid diameter as a measure of oxygen deficiency in ancient mudrocks.
Am. J. Sci. 1998, 298, 537–552. [CrossRef]
4. Li, G.; Wang, Y.; Shi, G.R.; Liao, W.; Yu, L. Fluctuations of redox conditions across the
Permian-Triassic boundary—New evidence from the GSSP section in Meishan of South China.
Palaeogeogr. Palaeoclimatol. Palaeoecol. 2016, 448, 48–58. [CrossRef]
5. Liao, W.; Bond, D.P.G.; Wang, Y.B.; He, L.; Yang, H.; Weng, Z.T.; Li, G.S. An extensive anoxic event in the
Triassic of the South China Block: A pyrite framboid study from Dajiang and its implications for the cause(s)
of oxygen depletion. Palaeogeogr. Palaeoclimatol. Palaeoecol. 2017, 486, 86–95. [CrossRef]
6. Wang, L.; Shi, X.; Jiang, G. Pyrite morphology and redox fluctuations recorded in the Ediacaran Doushantuo
Formation. Palaeogeogr. Palaeoclimatol. Palaeoecol. 2012, 333, 218–227. [CrossRef]
7. Zhang, Y.; Jia, D.; Yin, H.; Liu, M.; Xie, W.; Wei, G.; Li, Y. Remagnetization of lower Silurian black shale and
insights into shale gas in the Sichuan Basin, south China. J. Geophys. Res. Solid Earth 2016, 121, 491–505.
[CrossRef]
8. Huang, F.; Gao, W.; Gao, S.; Meng, L.; Zhang, Z.; Yan, Y.; Ren, Y.; Li, Y.; Liu, K.; Xing, M.; et al. Morphology
Evolution of Nano-Micron Pyrite: A Review. J. Nanosci. Nanotechnol. 2017, 17, 5980–5995. [CrossRef]
9. Merinero, R.; Cárdenes, V. Theoretical growth of framboidal and sunflower pyrite using the R-package
frambgrowth. Mineral. Petrol. 2018, 112, 577–589. [CrossRef]
10. Cnudde, V.; Boone, M.N. High-resolution X-ray computed tomography in geosciences: A review of the
current technology and applications. Earth Sci. Rev. 2013, 123, 1–17. [CrossRef]
11. Cardenes, V.; Cnudde, V.; Merinero, R.; Dewanckele, J.; de Boever, W.; Cnudde, J.P. Determination of
the REDOX paleoconditions: A High Resolution X-ray Tomography study of micro pyrite occurrence.
In Proceedings of the 2nd International Conference on Tomography of Materials and Structures, Quebec, QC,
Canada, 29 June–3 July 2015; Long, B., Francus, P., Eds.; INRS: Quebec, QC, Canada, 2015.
12. Cardenes, V.; Merinero, R.; De Boever, W.; Rubio-Ordóñez, Á.; Dewanckele, J.; Cnudde, J.P.; Boone, M.; Van
Hoorebeke, L.; Cnudde, V. Characterization of micropyrite populations in low-grade metamorphic slate:
A study using high-resolution X-ray tomography. Palaeogeogr. Palaeoclimatol. Palaeoecol. 2016, 441, 924–935.
[CrossRef]
13. Cardenes, V.; Merinero, R.; López-Munguira, A.; Rubio-Ordóñez, A.; Pitcairn, I.K.; Cnudde, V. Size evolution
of micropyrite from diagenesis to low-grade metamorphism. In Metamorphic Geology: Microscale to Mountain
Belts; Ferrero, S., Lanari, P., Goncalves, P., Grosch, E.G., Eds.; Geological Society of London Special Publications:
London, UK, 2019; Volume 478, pp. 137–144.
14. Merinero, R.; Cardenes, V.; Lunar, R.; Boone, M.N.; Cnudde, V. Representative size distributions of framboidal,
euhedral, and sunflower pyrite from high-resolution X-ray tomography and scanning electron microscopy
analyses. Am. Mineral. 2017, 102, 620–631. [CrossRef]
15. Wilkin, R.T.; Barnes, H.L.; Brantley, S.L. The size distribution of framboidal pyrite in modern sediments:
An indicator of redox conditions. Geochim. Cosmochim. Acta 1996, 60, 3897–3912. [CrossRef]
16. Craig, J.R.; Vokes, F.M.; Solberg, T.N. Pyrite: Physical and chemical textures. Miner. Depos. 1998, 34, 82–101.
[CrossRef]
17. England, B.M.; Ostwald, J. Framboid-derived structures in some Tasman fold belt base-metal sulphide
deposits, New South Wales, Australia. Ore Geol. Rev. 1993, 7, 381–412. [CrossRef]
18. Sawlowicz, Z. Pyrite framboids and their development: A new conceptual mechanism. Int. J. Earth Sci. 1993,
82, 148–156. [CrossRef]
19. Sawlowicz, Z. Framboids: From their origin to application. Prace Mineral. 2000, 88, 1–58.
20. Wacey, D.; Kilburn, M.R.; Saunders, M.; Cliff, J.B.; Kong, C.; Liu, A.G.; Matthews, J.J.; Brasier, M.D. Uncovering
framboidal pyrite biogenicity using nano-scale CNorg mapping. Geology 2015, 43, 27–30. [CrossRef]
21. Scott, R.J.; Meffre, S.; Woodhead, J.; Gilbert, S.E.; Berry, R.F.; Emsbo, P. Development of framboidal pyrite
during diagenesis, low-grade regional metamorphism, and hydrothermal alteration. Econ. Geol. 2009, 104,
1143–1168. [CrossRef]
22. Pitcairn, I.K.; Olivo, G.R.; Teagle, D.A.H.; Craw, D. Sulfide Evolution during Prograde Metamorphism of the
Otago and Alpine Schists, New Zealand. Can. Mineral. 2010, 48, 1267–1295. [CrossRef]
23. Bishop, D.G. Progressive Metamorphism from Prehnite-Pumpellyite to Greenschist Facies in the Dansey
Pass Area, Otago, New Zealand. Geol. Soc. Am. Bull. 1972, 83, 3177–3197. [CrossRef]Minerals 2020, 10, 459 9 of 9
24. Mortimer, N.; Roser, B.P. Gechemical evidence for the postion of the Caples Torlesse boundary in the
Otago Schist, New Zealand. J. Geol. Soc. 1992, 149, 967–977. [CrossRef]
25. Large, R.; Thomas, H.; Craw, D.; Henne, A.; Henderson, S. Diagenetic pyrite as a source for metals in orogenic
gold deposits, Otago Schist, New Zealand. N. Z. J. Geol. Geophys. 2012, 55, 137–149. [CrossRef]
26. Large, R.R.; Danyushevsky, L.; Hollit, C.; Maslennikov, V.; Meffre, S.; Gilbert, S.; Bull, S.; Scott, R.; Emsbo, P.;
Thomas, H.; et al. Gold and Trace Element Zonation in Pyrite Using a Laser Imaging Technique: Implications
for the Timing of Gold in Orogenic and Carlin-Style Sediment-Hosted Deposits. Econ. Geol. 2009, 104,
635–668. [CrossRef]
27. Rozenbaum, O.; du Roscoat, S.R. Representative elementary volume assessment of three-dimensional x-ray
microtomography images of heterogeneous materials: Application to limestones. Phys. Rev. E 2014, 89,
053304. [CrossRef] [PubMed]
28. Eberl, D.D.; Drits, V.A.; Srodon, J. Deducing growth mechanisms for minerals from the shapes of crystal size
distributions. Am. J. Sci. 1998, 298, 499–533. [CrossRef]
29. Merinero, R.; Lunar, R.; Somoza, L.; Díaz-Del-Río, V.; Martínez-Frías, J. Nucleation, growth and oxidation of
framboidal pyrite associated with hydrocarbon-derived submarine chimneys: Lessons learned from the Gulf
of Cadiz. Eur. J. Mineral. 2009, 21, 947–961. [CrossRef]
© 2020 by the authors. Licensee MDPI, Basel, Switzerland. This article is an open access
article distributed under the terms and conditions of the Creative Commons Attribution
(CC BY) license (http://creativecommons.org/licenses/by/4.0/).You can also read