A Hazard Multiple: Overlapping Tornado and Flash Flood Warnings in a National Weather Service Forecast Office in the Southeastern United States
←
→
Page content transcription
If your browser does not render page correctly, please read the page content below
AUGUST 2020                                             HENDERSON ET AL.                                                                  1459

       A Hazard Multiple: Overlapping Tornado and Flash Flood Warnings in a National
             Weather Service Forecast Office in the Southeastern United States

                                                             JEN HENDERSON
                    Cooperative Institute for Research in Environmental Sciences, University of Colorado Boulder, and
                                  NOAA/OAR/ESRL/Global Systems Laboratory, Boulder, Colorado

                       ERIK R. NIELSEN, GREGORY R. HERMAN,a AND RUSS S. SCHUMACHER
                          Department of Atmospheric Science, Colorado State University, Fort Collins, Colorado

                                     (Manuscript received 18 October 2019, in final form 6 May 2020)

                                                                 ABSTRACT

                  The U.S. weather warning system is designed to help operational forecasters identify hazards and issue
               alerts to assist people in taking life-saving actions. Assessing risks for separate hazards, such as flash flooding,
               can be challenging for individuals, depending on their contexts, resources, and abilities. When two or more
               hazards co-occur in time and space, such as tornadoes and flash floods, which we call TORFFs, risk assessment
               and available actions people can take to stay safe become increasingly complex and potentially dangerous.
               TORFF advice can suggest contradictory action—that people get low for a tornado and seek higher ground
               for a flash flood. The origin of risk information about such threats is the National Weather Service (NWS)
               Weather Forecast Office. This article contributes to an understanding of the warning and forecast system
               though a naturalistic study of the NWS during a TORFF event in the southeastern United States. Drawing on
               literature for the Social Amplification of Risk Framework, this article argues that during TORFFs, elements
               of the NWS warning operations can unintentionally amplify or attenuate one threat over the other. Our
               results reveal three ways this amplification or attenuation might occur: 1) underlying assumptions that
               forecasters understandably make about the danger of different threats; 2) threat terminology and coordi-
               nation with national offices that shape the communication of risks during a multihazard event; and 3) orga-
               nizational arrangements of space and forecaster expertise during operations. We conclude with suggestions
               for rethinking sites of amplification and attenuation and additional areas of future study.

1. Introduction                                                           public. Some TORFF warnings may include advice that
                                                                          can create confusion for people taking protective actions: a
   Weather hazards change and evolve over time. The
                                                                          tornado warning usually advises that people take cover in
same holds true for the way that individual vulnerabil-
                                                                          the interior most part of their home; a flash flood warning
ities emerge and recede as people assess and understand
                                                                          may suggest that individuals move to higher ground to
their risks (Morss et al. 2017). When hazards overlap and
                                                                          avoid rushing water. To identify how these issues emerge
co-occur, there is an additional layer of complex assess-
                                                                          and might be addressed, it is important to understand how
ment and adjudication of threats, both for forecasters and
                                                                          the warning system currently functions, why it functions
people in harm’s way. In the case of overlapping tornado
                                                                          that way, and where there are opportunities for change.
and flash flood warnings, or TORFFs (e.g., Nielsen et al.
                                                                             Based on naturalistic observations of NWS forecasters
2015), it is important to understand the operational context
                                                                          issuing warnings, our results reveal three ways these
for warning for them since this can affect potentially con-
                                                                          mismatches might originate: 1) underlying assumptions
tradictory risk information that gets disseminated to the
                                                                          that forecasters understandably make about the danger
                                                                          of different threats, both their own beliefs and the per-
  a
      Current affiliation: Amazon.com, Seattle, Washington.               ceptions they have of their public’s knowledge; 2) threat
                                                                          terminology and coordination with national offices that
  Corresponding author: Jen Henderson, jennifer.henderson-1@              shape the communication of risks during a multihazard
colorado.edu                                                              event; and 3) organizational arrangements of the office

DOI: 10.1175/WAF-D-19-0216.1
Ó 2020 American Meteorological Society. For information regarding reuse of this content and general copyright information, consult the AMS Copyright
Policy (www.ametsoc.org/PUBSReuseLicenses).
                                                                                                      Unauthenticated | Downloaded 01/15/22 07:17 PM UTC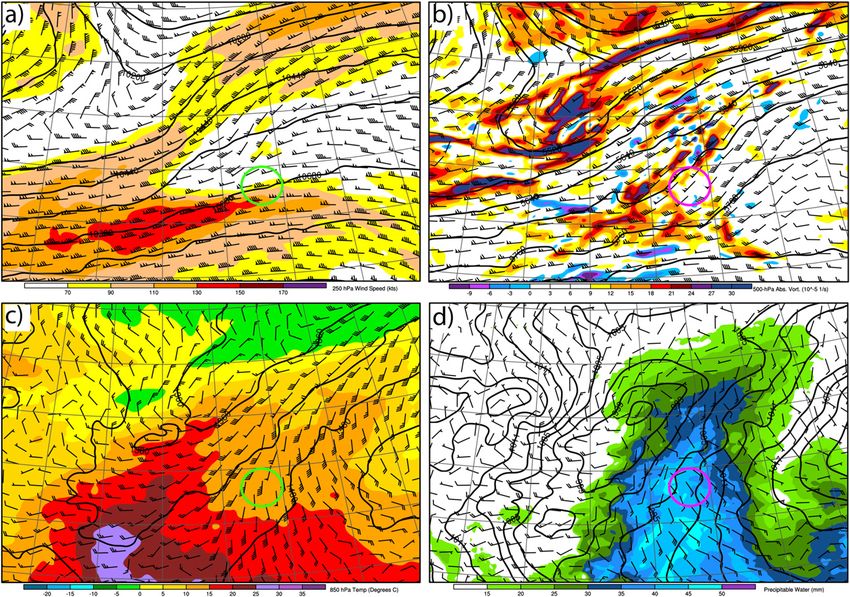
1460                                    WEATHER AND FORECASTING                                                    VOLUME 35

workspace and the expertise of forecasters during oper-        context before, during, and after warnings. These studies
ations. It is beyond the scope of this article to examine      tend to emphasize the individual hazards and issues that
how the public perceives these multiple threats, whether       emerge primarily in that singular context. In flash
or not they detect any amplification or attenuation of a       flooding, for example, studies focus on the warning
threat, and how attending messaging might affect their         processes for hydrology, problems with the public’s
actions. Such issues are an important future focus for         knowledge of the hazard and safety protocols, and
research, one that the authors have begun to investigate       the contextual factors affecting public decisions (e.g.,
in the context of landfalling tropical cyclones (Spinney       Gourley et al. 2013; Terti et al. 2015; Morss et al. 2015;
et al. 2020; Bica et al. 2020, manuscript submitted to Hum.    Lazrus et al. 2016). Those who seek to improve the
Comput. Interact.). This work is motivated by the possi-       creation of forecast information available to meteorol-
bility that when two pieces of warning advice are in           ogists focus on evaluating current forecast tools, im-
contradiction or when one risk is amplified or attenuated      proving products and processes, and suggesting future
in ways that may potentially confuse people who expe-          directions for predictive analysis and communication
rience them, the warnings themselves become a new kind         (e.g., Morss et al. 2005; Gourley et al. 2013; Clark et al.
of hazard that individuals must negotiate.                     2014). Similar investigations have been undertaken to
   In what follows, the authors first review relevant liter-   better understand the social, cultural and communica-
ature for this work, including an overview of the methods      tion aspects of tornadoes and their warnings (e.g.,
and background on this TORFF event and location, site          Donner 2007; Simmons and Sutter 2009; Schumacher
selection of the southeastern United States, and the sig-      et al. 2010; Hoekstra et al. 2011; Ash et al. 2014;
nificance of TORFFs in the region. Results are then pre-       Ripberger et al. 2015). In these cases, threats are largely
sented, followed by a discussion of the results and their      treated independent of one another, in part, because
significance to warning strategies deployed by members of      hazards themselves can occur in isolation and warning
the weather enterprise. The article concludes with sug-        systems reflect this fact. This study offers new insights into
gestions for additional future research directions.            the intersections and co-occurrence of hazards as they are
                                                               assessed by experts who issue warnings for them.
                                                                  Research within the social sciences community has
2. Literature review
                                                               examined a variety of issues related to expertise and
   For our purpose, we define TORFFs as either over-           decision-making. Some examine forecaster decision-
lapping and concurrent warnings or overlapping and             making, focusing on local expertise and information use
concurrent verified events involving tornadoes and flash       (e.g., Hoffman et al. 2000, 2001; Coffey and Hoffman
floods. We do so because from the perspective of the           2003; Joslyn et al. 2007; Demuth 2018), culture and
public, warnings for hazards that verify or fail to verify     communication of uncertainty (e.g., Lazo et al. 2010;
still circulate information about their risks to individ-      Anthony et al. 2014; Demuth et al. 2020), forecast
uals and trigger similar kinds of decision processes.          technologies that contribute to sense making and
However, other definitions of TORFFs exist. Nielsen            reasoning (e.g., Hoffman 1991; Hoffman et al. 2006;
et al. (2015) distinguish between ‘‘verified TORFFs,’’         Heinselman et al. 2012, 2015), partner decisions and
where tornado tracks and flash flood observations oc-          challenges (e.g., Baumgart et al. 2008; League et al.
curred within three hours of one another in the exact          2010), and forecaster, learning, judgement, and ex-
same location, and ‘‘potential TORFFs.’’ The latter are        pertise (e.g., Stewart et al. 1984; Lusk et al. 1990;
defined as those events for which there are collocated         Pliske et al. 2004; LaDue 2011; Morss et al. 2015).
and overlapping warning polygons within thirty minutes         Conceptual and ethical issues related to warnings are
of one another, without the verification of both hazards       explored by others (e.g., Barnes et al. 2007; Morss and
being necessary. While the authors note that potential         Wahl 2007; Morss et al. 2015; Lazrus et al. 2016;
TORFFs may overestimate the number of TORFF haz-               Henderson 2017) and raise important issues not only
ards that occur together, the presence of these overlapping    about the practices but the assumptions embedded in
polygons themselves can send conflicting messages to the       warning processes and products. Our work extends this
public (Evans et al. 2017). Potential problems can likewise    latter emphasis on assumptions to reveal those related to
occur with messaging for other types of overlapping haz-       beliefs about risks, division of labor, and terminology use.
ards at different scales, such as tornado watches and flash       Finally, our work builds on those who have conducted
flood watches, leading to a potential need to expand the       ethnographic work that involves naturalistic observations,
definition of TORFF (see section 5).                           which offer real-time data about forecaster operations.
   Our research is in conversation with literatures that fo-   This is an important method given that forecaster warning
cus on challenges NWS forecasters face in an operational       decisions are complex and can be affected by several

                                                                                     Unauthenticated | Downloaded 01/15/22 07:17 PM UTC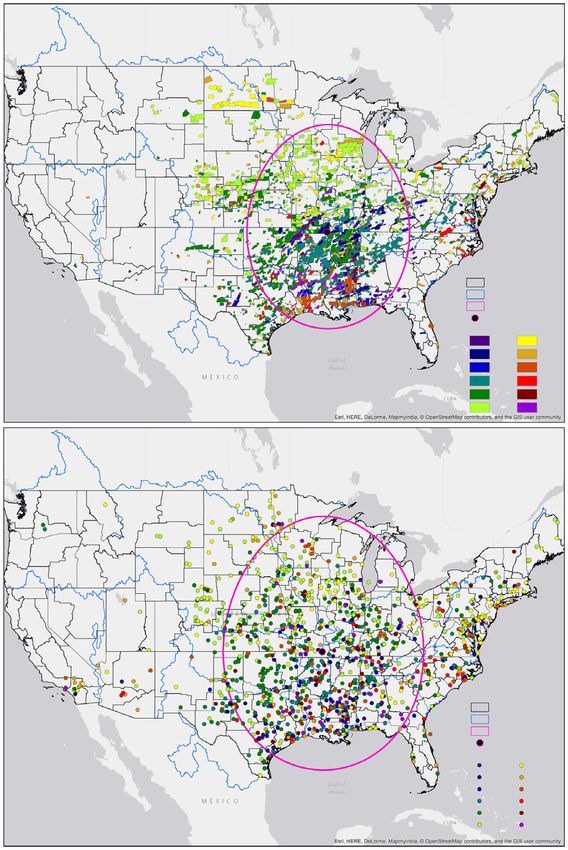
AUGUST 2020                                          HENDERSON ET AL.                                                               1461

contextual factors. For example, Fine (2007), documents               the geographic mean center of the geographic distribu-
the ways that forecasters operate within a culture of sci-            tion of TORFF warnings (Fig. 1; section 4b) and em-
entific production shaped by social, political, and organi-           ployed snowball sampling methods to contact other
zational elements. In part, this is a result of forecasters’          WFOs. The participating WFO and town affected by the
approach to data, which can be improvisational, drawing               TORFF is anonymized in accordance with Institutional
on multiple sources of information to create local pre-               Review Board protocols. The lead author conducted
dictive products (Daipha 2015). Importantly, forecasters              individual, semistructured interviews with nine staff
play a central role in interpreting information about                 members at the NWS WFO, including management,
threats for their users (Morss and Wahl 2007; Spinney                 forecasters, and hydrology experts; this comprised 75%
2019). Forecasters, then, negotiate their evolving identity           of staff since the office had six staff vacancies at the time.
as scientists and communicators through practices of ac-              Additionally, two emergency managers in the county
curacy and care (Henderson 2017). In particular, we draw              warning area (CWA) were interviewed about their un-
from the Social Amplification of Risk Framework (SARF;                derstanding of and concerns over threats from tornadoes
Kasperson et al. 1988) to apply symmetrically to fore-                and flash flooding in their geographic area. Interviews
casters those mechanisms for understanding how a risk                 averaged 70 min, with the longest at 115 min and the
might be magnified or lessened at a particular site through           shortest at 41 min. Interviews were audio recorded and
various social processes.                                             transcribed, in accordance with Institutional Review
   Theories of SARF tend to focus on the public un-                   Board protocols, and inductively coded in NVivo soft-
derstanding of risk, often assessing how minor risks can              ware by the lead author. Inductive coding followed
become magnified through various nontechnical pro-                    standard methods of qualitative data analysis (Creswell
cesses. In many cases, these risks are judged by experts              and Creswell 2017) to identify key themes that emerged
to be less concerning than they are viewed by the public              relative to TORFFs, which included nodes for forecaster
and can obscure attention to those risks experts feel are             beliefs about threats, challenges with communication of
much more pressing. SARF scholars examine the dy-                     threats, coordination with national center products, and
namic ways risk evolves and moves through society,                    sites of amplification of risk.
noting that ‘‘. . .hazards interact with psychological, so-              In addition to interviews, the author conducted natural-
cial, institutional, and cultural processes in ways that              istic observations of warning operations at the same WFO
may amplify or attenuate public responses to the risk or              during weather events for which forecasters forecasted and
risk event (Kasperson et al. 1988, p. 177).’’ While those             warned for tornadoes and flash floods. Observations (e.g.,
employing SARF seek to understand this process for the                see the appendix) totaled 88 h and included prewarning
public, our work focuses on sites of potential risk am-               activities (e.g., coordination with partners, discussions of
plification within an expert scientific community. We do              staffing, analysis of models), warning activities (e.g., crea-
so because these spaces are similarly complex and in-                 tion of warnings, calls to local emergency managers, col-
volve multiple types of social interactions between the               lection of storm reports), and postwarning activities (e.g.,
scientific and technical aspects of forecasting practice.             damage surveys, production of public damage survey re-
Rather than examine the amplification of minor tech-                  ports, debriefs with staff). Field notes collected during this
nical risks, we instead focus on time-sensitive and sub-              observational period were analyzed inductively and syn-
stantial risks to life for which appropriate amplification            thesized with insights gathered during interviews. Finally,
is expected and needed by members of different publics.               the authors collected products and communication mate-
                                                                      rials created by the office. The interview protocol is avail-
                                                                      able upon request.
3. Analysis and methodology
                                                                      a. Sociodemographic and historical context
  Our ethnographic study was conducted during two
one-week periods at an NWS Weather Forecast Office                       Our TORFF event focuses on warnings created at a
(WFO) in the southeastern United States, the first in late            NWS WFO and disseminated in a small rural town,
January and the second during late March/early April.1                Telmin,2 which is located in the southeast. The WFO
The authors emailed NWS WFO management staff near                     issued a verified TORFF warning (i.e., concurrent,

  1                                                                     2
    The year and exact dates in which these observations were taken       In accordance with Institutional Review Board guidelines, the
and the TORFF event in question took place are omitted from this      names and some information about the WFO location, the warn-
manuscript. This is in accordance with Institutional Review Board     ings, and town affected have been changed to protect the identity of
guidelines to protect the identity of forecasters and the public.     forecasters and the public. Telmin is a fictional name.

                                                                                             Unauthenticated | Downloaded 01/15/22 07:17 PM UTC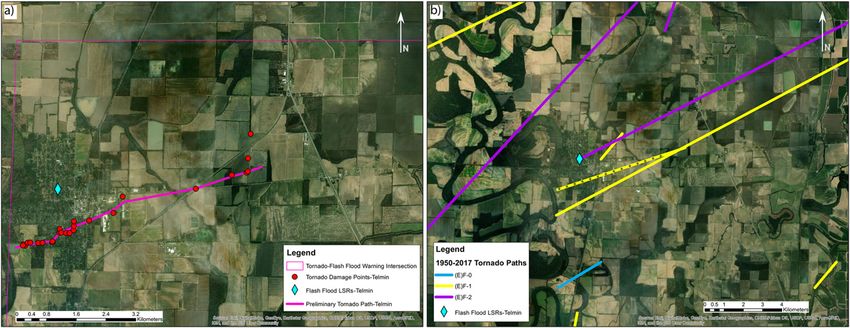
1462                                      WEATHER AND FORECASTING                                                              VOLUME 35

                     FIG. 1. (a) Geographic distribution of concurrent, collocated flash flood and tornado warnings
                  (color coded by month) that were issued within 30 min of one another from 2008 through 2018 (i.e.,
                  potential TORFFs). Polygons shaded on the map corresponds to the area common between both
                  the tornado and flash flood warning. Pink marker represents geographic mean center, pink ellipse
                  represent one spatial standard deviation away from mean center, black lines denote NWS WFO
                  boundaries, and blue lines mark RFC boundaries. (b) Locations of verified TORFF events (dots)
                  from 2003 to 2018 based upon 50-km spatial buffer between flash flood local storm reports (LSRs)
                  and tornado observations [see Nielsen (2019) for details], where color coding convention is as in (a).

collocated tornado and flash flood warnings where both                features and demographics that make it vulnerable in
individual threats verified) around 2200 local time (LT)              multiple ways traditionally defined by social scientists, such
on a day in late March (year and exact date omitted,                  as the number of mobile homes and the socioeconomic
Fig. 2). As a rural community, Telmin is characterized by             status of the population, and which may be magnified

                                                                                                 Unauthenticated | Downloaded 01/15/22 07:17 PM UTC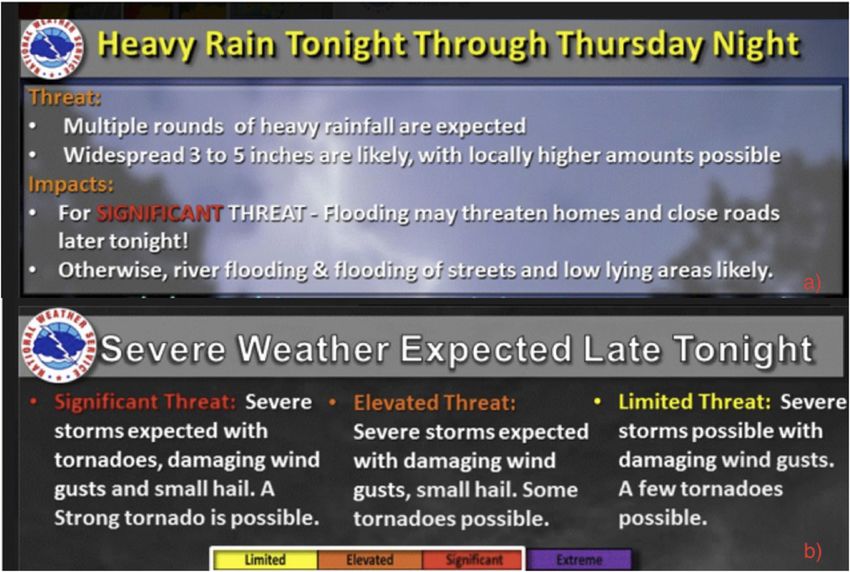
AUGUST 2020 HENDERSON ET AL. 1463
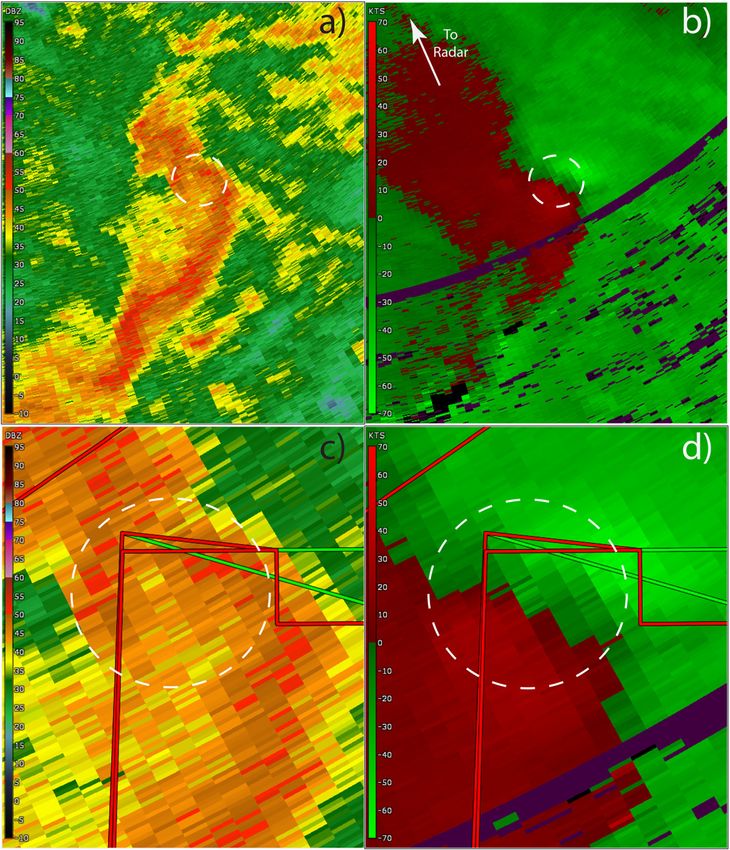
FIG. 2. (a),(c) Radar reflectivity and(b),(d) velocity for Telmin valid for the late March TORFF event. In (a) and
(b) the broad convective element responsible for producing the tornado and flash flooding is shown. In (c) and (d) a
zoomed in version of (a) and (b) is shown, respectively, highlighting part of the overlapping tornado (red) and flash
flood (green) polygons where the tornado and flash flooding co-occurred. The white dashed circle encompasses the
approximate location of the concurrent, collocated tornado and flash flood reports in all panels, and also encom-
passes approximately the same area in all panels.
during a TORFF because of increased risks from mul- agriculture. Thus, it is prone to regular river flooding.
tiple threats. Thus, inclusion of Telmin is meant to il- Data from the 2010 Census finds that Telmin has a
lustrate, however briefly, potential impacts of TORFFs population of nearly 3000 people, 77% of whom are
on a vulnerable public. African American, 20% Caucasian, and 1% from
Aerial maps of the town through Google Earth (Fig. 3b) Hispanic or Latino heritage. Nearly 30% of the pop-
show that the area in and around Telmin comprises a flat ulation is 18 years old or younger and 22% are over 65.
topography bordered on two sides by rivers, or bayous, The average median income is just under $18,000, with a
with the majority of land primarily used for rural per capita income of $9,998. In total, 35% live below
Unauthenticated | Downloaded 01/15/22 07:17 PM UTC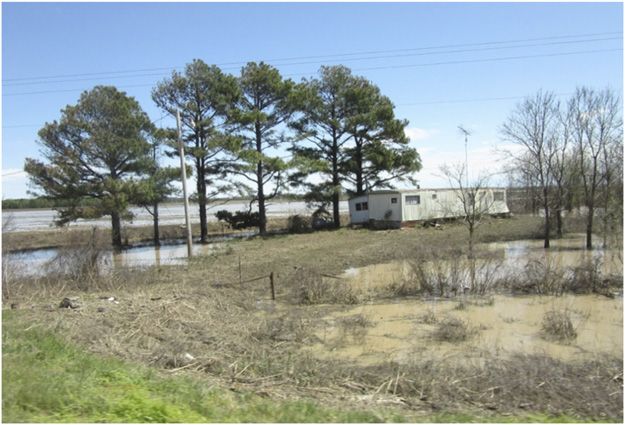
1464                                          WEATHER AND FORECASTING                                                           VOLUME 35

  FIG. 3. (a) Damage points (red dots), flash flood local storm reports (blue diamond), and damage path (pink line) of EF-1 tornado
damage path across the southern end of Telmin, ending just east of town, that led to the late March TORFF event discussed in this paper.
(b) All tornado paths between 1950 and 2017 that passed within 15 km of Telmin colored by (E)F rating. Flash flood local storm report
marker (blue diamond) is located in the same place in each image (i.e., notice different zoom levels). Asterisked track in (b) corresponds to
the tornado track depicted in (a).

poverty. These data suggest the population may lack                     Arkansas, and Texas. An emergency manager in Telmin
resources and the ability to evacuate during weather                    said in an interview after the TORFF event that there
disasters.                                                              had been ‘‘lots of flooding here over the past few weeks
   On multiple levels, this community’s sociodemographics               [before the TORFF]’’ and that ‘‘many homes have some
and exposure to nearby rivers suggest residents are more                damage. . .’’ and few could afford flood insurance or to
likely to be vulnerable to hazards like tornadoes and                   begin repairing their homes. He noted that of the 298
floods. When both co-occur, several dimensions of their                 homes that were flooded before the TORFF event, only
vulnerabilities may come into play. As previous research has            five had insurance and that flood insurance is high for
shown, mobile homes increase individual vulnerabilities to              this area, ‘‘some $3,800 a year.’’ There are no public
tornadic damage and death and pose challenges for those                 shelters in Telmin because of the water table and as the
who must shelter from tornadoes (e.g., Chaney and Weaver                emergency manager suggested, ‘‘they’re too expensive
2010; Liu et al. 2019). For example, Ash (2017) suggests that           to build,’’ so people must shelter in place. He also re-
people may understand tornado threats and the safety of                 called that the town has been hit by tornadoes a few
their mobile homes differently from experts and thus may                times in the past decade (Fig. 3b) and that he personally
have priorities for sheltering that reflect their concerns; they        had rebuilt his home three times because of damage and
may also be confused about what shelter is safe. Schmidlin              so had finally installed an underground shelter. The lack
et al. (2009) found that while about half of mobile home                of shelters makes residents more likely to be harmed by
residents seek shelter, some often do not do so because safe            tornadoes, and the lack of flood insurance makes the
places are not proximate to their homes, nor do they know               residents more exposed financially to such events. Thus,
who lives in the well-built homes where they might shelter.             Telmin residents are more sensitive to (Adger 2006), or
In the Southeast, the nocturnal nature of these tornadoes               more affected by, impacts from TORFFs.
can increase potential harm, especially for those in manu-                 In Telmin, rainfall totals for the period were measured
factured structures, such as mobile homes (e.g., Sutter and             as high as 16 in., some of the highest in the CWA.
Simmons 2010; Strader and Ashley 2018). Maps of housing                 This flooding, along with record flooding in the CWA
units from Telmin taken from 2010 census data indicate                  throughout the month, created saturated soils and left
less than 55% of residents in the county are homeowners                 standing water, which was still visible by satellite the day
and that mobile homes account for 30% of all housing units.             before the TORFF event. Additionally, a few weeks
   In the weeks before the TORFF event in question,                     before (i.e., mid-March), an EF1 tornado struck the
around mid-March, record flooding occurred across the                   southern part of town and continued east-northeast for
Southeast, with rivers cresting and homes suffering sig-                nine miles (track directly south of asterisked path in
nificant damage in Mississippi, Tennessee, Louisiana,                   Fig. 3b). Damage to homes from recent storms in the

                                                                                                Unauthenticated | Downloaded 01/15/22 07:17 PM UTC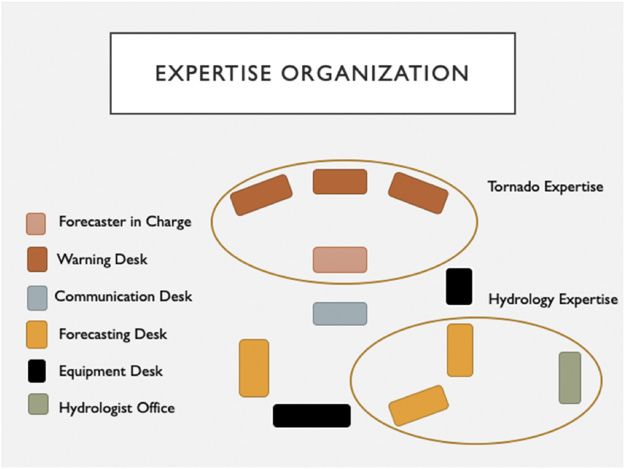
AUGUST 2020                                    HENDERSON ET AL.                                                         1465

area also meant that when the TORFF occurred, some             nocturnal nature of the event and overall strength of the
people may have been more exposed to these threats             storm system, the 0–1-km shear greatly intensified over
than they might have been otherwise.                           the period, from 15 to 25 m s21 near the end of the event
                                                               (not shown). The low-level wind profile likely played a
b. TORFF meteorological context
                                                               large role in the quasi-linear convective system (QLCS)
   TORFF warnings emerge in a maximum in the south-            tornado formation, while the sustained upper-level sup-
eastern United States (Nielsen et al. 2015). This is due, in   port and low-level moisture aided in the precipitation that
part, to the confluence of many environmental factors,         was observed.
including strong synoptic-scale forcing, low to moderate          Forecasters issued Telmin TORFF warnings around
instability, high environmental wind shear, and high           2200 LT on a day in late March, when the National
background total column moisture, that lead to envi-           Weather Service issued a 5-h flash flood warning for a
ronments favorable conditions for organized, tornado-          heavily saturated area of ground over which they expected
producing convection (e.g., Sherburn and Parker 2014;          storms to train. Fifteen minutes later, they issued a 45-min
Sherburn et al. 2016; King et al. 2017). Additionally,         tornado warning, a polygon that included Telmin. During
the high low-level shear environments that are com-            the TORFF event, an EF-1 tornado crossed the southern
mon to this region yield a situation where the rotation        edge of town, causing one injury and minor damage to
associated with tornadoes, itself, could enhance the           buildings (Fig. 3a). The warning said that ‘‘a storm capable
resulting rain rates, all else being equal (Nielsen and        of producing a tornado’’ was moving toward the town at
Schumacher 2018, 2020a,b).                                     60 mph. Local storm reports from emergency manage-
   Calculations of potential TORFF events reveal that          ment noted ‘‘heavy damage,’’ throughout the town, with
approximately 350 such overlaps occurred each year in          powerlines down and ‘‘multiple homes damaged, some
the United States between 2008 and 2018 (Nielsen               with heavy damage.’’ Flash flooding also occurred with
2019), with the highest frequency appearing in both            the tornadic storm, eventually inundating streets up to
warm and cool seasons in the following states: parts of        two feet in some places. These two warnings, the flash
Oklahoma, Missouri, Kentucky, Arkansas, Tennessee,             flood warning and the tornado warning, overlapped one
Mississippi, Louisiana, and Alabama (Fig. 1a). A similar       another in space and time, both fully encompassing a sig-
spatial pattern is seen in verified TORFFs (Fig. 1b),          nificant part of Telmin (Figs. 2 and 3a).
which on average occur between 25 and 75 times per
year, depending on the spatial buffer between tornado
                                                               4. Results
and flash flood observations (see Nielsen 2019, for
details).                                                        Findings from this study suggest a number of ways that
   The Telmin TORFF event was associated with a sur-           one hazard may be potentially amplified or attenu-
face cyclone (Fig. 4d) and a slow-moving cold front            ated in a NWS forecast office during the processes of
ahead of a digging upper-level trough (Figs. 4a,b). The        assessing and messaging a threat. Specifically, we report
presence of a robust subtropical jet (Fig. 4a) upstream of     on three aspects of NWS operations that function as
the region in question (pink and green circles on Fig. 4)      possible places in the warning process where this may
further aided storm development by providing upper-            occur: 1) forecasters’ beliefs about the danger posed by
level support for the convection. Warm, moist south-           tornadoes and flash floods in their area, and their per-
easterly flow at the surface (Fig. 4d) and southerly flow      ceptions about how the public understands these threats;
at midlevels (i.e., 850 hPa, Fig. 4c), after the passage of    2) the language forecasters used to describe the two
the warm front provided moisture, instability, and con-        threats in pre-event products and messaging including
tinued warm air advection at midlevels into the region.        use of Storm Prediction Center (SPC) products in
Further, due to the overall strength of the storm system,      communicating tornado probabilities; and 3) the organi-
wind speeds were at or above 25 m s21 (i.e., 50 kt;            zation of the office and expertise during warnings. Finally,
1 kt ’ 0.51 m s21) above the surface (Figs. 4a–c), even at     we identify other relevant TORFF related results, namely
850 hPa (Fig. 4c), which led to increased low-level shear      new types of TORFFs that raise other possible problems
in the prestorm environment. Thermodynamic profiles            for the public and a brief example of those affected by this
(not shown) from the area show 1300 J kg21 of most un-         particular TORFF. The following is not intended as a
stable convective available potential energy (MUCAPE)          criticism of forecaster challenges any more than it would
with instability present throughout the vertical column        be a criticism to highlight challenges members of the
and most levels near saturation, which is a profile often      public face in receiving, understanding, and acting on
supportive of heavy rainfall (e.g., Davis 2001; Schumacher     warnings. Instead, the purpose here is to highlight places
2009; Schroeder et al. 2016a). Corresponding to the            where risk amplification or attenuation might occur in a

                                                                                   Unauthenticated | Downloaded 01/15/22 07:17 PM UTC
1466 WEATHER AND FORECASTING VOLUME 35
FIG. 4. (a)–(d) Rapid Refresh (RAP; Benjamin et al. 2016) analysis valid at 0000 UTC for the late March TORFF event. (a) 250-hPa
isotachs (shaded every 20 kt over 70 kt, 1 kt 5 0.5144 m s21), 250-hPa geopotential height (contoured every 120 m), and 250-hPa wind
barbs (half barb 5 5 kt, full barb 5 10 kt, pennant 5 50 kt). (b) Absolute vorticity at 500 hPa (3 1025 s21), shaded every 3 3 1025 s21 above
9 3 1025 s21; 500-hPa geopotential height (contoured every 60 m); and 500-hPa wind barbs. (c) 850-hPa geopotential height (contoured
every 25 m), 850-hPa wind barbs, and 850-hPa temperature (shaded every 58C from 2208 to 358C). (d) Precipitable water (shaded contours
every 5 mm for values from 10 to 50 mm), 10-m wind barbs, and mean sea level pressure (MSLP) (contoured every 3 hPa). Green (in the
left column) and pink (in the right column) circles denote area of interest around Telmin. Latitude and longitude lines are in 58 intervals.
NWS WFO and thus opportunities to improve the flash flood, those events that occur in and around Telmin
overall warning system. and the CWA are perceived as having less rapid move-
ment. ‘‘I would say what we consider flash flooding is a
a. Forecasters’ beliefs about flash floods and little different than what you would say from other
tornadoes areas,’’ one forecaster noted. They are not as violent as
those that might ‘‘rip’’ through an area, suggesting rapid
1) FLASH FLOODS AND THEIR DANGER movement, nor do they ‘‘rage’’ down canyons or sweep
The NWS definition of flash flooding is ‘‘A flood everything away in their path. Instead, they are rapid rises
caused by heavy or excessive rainfall in a short period of of fairly slow moving water. As another forecaster said:
time, generally less than 6 hours. . . They can occur
‘‘Flash flooding is not what you would have out in the
within minutes or a few hours of excessive rainfall. They Colorado area where it’s fast-moving type things. [Water]. . .
can also occur even if no rain has fallen, for instance can rise very rapidly, but it’s usually not the intense rushing
after a levee or dam has failed, or after a sudden release of water like you would get, say, in an area like the mountainous
water by a debris or ice jam’’ (NWS 2017). This definition areas or the more hilly areas. . .Most of the time our water
highlights what forecasters call the ‘‘flashy’’ nature of just rises very rapidly, but it’s not as much movement initially.
flash floods, its quick onset and its rapid movement across You can get that once you get more river-type flooding. You
the landscape. Unlike the standard NWS definition of get a lot more of that.’’
Unauthenticated | Downloaded 01/15/22 07:17 PM UTCAUGUST 2020 HENDERSON ET AL. 1467
Others noted that standing water can constitute a flash much rain, we know this area will flood and [we can] try
flood, where movement of the water itself is slower but to sort of emphasize that area a little bit better.’’
the depth might be a problem: ‘‘You drive into [flash Forecasters also noted they seek confirmation of on-
flood water] and you can still get into a deep pool. . . You going flash floods from emergency managers and others
see a lot more standing water that’s rising in areas. Of in public safety, and impacts can be documented by
course, the closer you get to the creeks and everything, forecasters afterward, depending on factors such as the
you have water that’s moving.’’ Flash flooding in this availability of staff and the significance of the impact in
area of the Southeast is characterized by forecasters as their CWA, an approach which is confirmed in other
rising water that is usually not moving at rapid speed but research (Schroeder et al. 2016b).
can inundate roads and other structures. Forecaster interviews suggest the main danger from
Flash floods derive primarily from excessively heavy flash floods stems from water that enters roadways and
precipitation, though soils help mitigate flooding to hides other hazards, like roads that have washed away.
some degree. Unusually high rainfall rates that exceed This situation is particularly dangerous when individuals
soil saturation can lead to rapid rises, which constitute drive through flooded areas, which may cause a crash or
flash flood threats. ‘‘Flash flooding definitely [comes lead to a water rescue. ‘‘A lot of times where we get lives
from] heavy rainfall. . .so I guess our biggest threat lost—which is just like anywhere else—is when some-
would be when we get it in a very short time. . .’’ one body drives their car into a flooded area,’’ one forecaster
forecaster explained. ‘‘There are times where you can said. ‘‘We’ve had people actually drive into washed-out
get some pretty good flooding in places, too. That’s a bridges. They didn’t know the bridge was there or the
little more rare, but you can get those big ten-inch rains roadway was washed out. We’ve had that happen, but
in about six, seven hours around here. That’s really when we haven’t had a lot since I’ve been here of people that
you get your problems. That’s the most dangerous, the have actually been killed by that.’’ Communicating the
fast-occurring flash.’’ Further, flash flooding that does danger of driving through flooded roads is the main
occur usually doesn’t last long. Any rapid rises of water challenge for flash flooding.
are usually also followed by quickly receding of water, This belief is echoed in the concern some partners in
except when the soils are saturated from antecedent emergency management expressed about flash floods.
river flooding or extended periods of heavy rainfall. ‘‘My experience with flash flooding [is that] generally
Forecasters also reported that flash flooding is not often you’re going to have issues where they inundate a house
widespread but is largely confined to local areas of the real quick or where somebody tries to drive through it.
river basin or deltas, which are flat and thus flood fre- So, the biggest danger that I see are the people out there
quently. Flash flooding, then, depends on interactions driving around that think they can get through it, and
with soils, topography, and previous conditions. then you wind up with a water rescue.’’ In these exam-
Detecting flash flooding can be difficult and involves a ples, water alone is not the main threat. It is the behavior
combination of radar estimates, river gauges, when avail- of those who are navigating the water that, when cou-
able, and reports from partners or the public. Guidance pled with the water’s effect on topography and infra-
from the River Forecast Center and the software Flash structure, can cause danger. As a hazard, then, flash
Flood Monitoring and Prediction Program (FFMP) help
floods create challenges for forecasters because of the
forecasters identify areas that may flood. FFMP derives
rapid rise of slow moving water and the behavior of in-
rainfall rates and associated rainfall accumulations from
dividuals in and around the threat.
radar for basins given a particular timeframe. However, as
one forecaster said, these numbers can ‘‘be garbage’’ in 2) TORNADOES AND THEIR DANGER
their accuracy. For example, one forecaster noted that you The NWS defines a tornado as ‘‘a violently rotating
might sample an area and FFMP reads ‘‘3.74 in. to get flash column of air touching the ground, usually attached to
flooding but based on previous rain you know it’s actually the base of a thunderstorm.’’ This definition highlights
around 2 in.’’ Scant river gauges add an additional chal- how any phenomena that matches this description
lenge since observations are not able to confirm river constitutes a tornado, regardless of its strength or size.
flooding. To address these issues, forecasters are building a Forecasters in this WFO characterize tornadoes events
database of flooded areas. as frequent and difficult to visualize as they approach a
‘‘There are areas in every county that takes so much rain community because of when they occur, their speed, and
and you’re going to flood every time. . . .We’re trying to obstacles in the landscape. For tornadoes in their area,
map those out. . . we’re running an initial program to try ‘‘the cloud bases tend to be lower than say like in the
to find out what areas are flooding. Then, if we get so Plains—they can sneak up on you easier, but it’s harder
Unauthenticated | Downloaded 01/15/22 07:17 PM UTC1468 WEATHER AND FORECASTING VOLUME 35
to see with the trees and everything and the hills. . . size or strength. ‘‘Tornadoes are dangerous. They’re
They’re fast-moving, too. . .very deadly.’’ They also hard to see. A lot of times they’re at night.’’ Others point
noted other characteristics of tornadoes in their area. to the type of storms and landscape itself as part of the
‘‘We have a lot of long-track tornadoes. Tornado fre- danger.
quency’s higher. . .we get a lot more probably of the
lower end EF 0/EF 1 type.’’ Another confirmed this ‘‘As you can tell, there’s a lot of trees and a lot of vege-
tation. That makes it even more hazardous because you
same aspect of tornadoes as problematic because of
can’t see a lot of them. They may be wrapped in rain or
their lack of visibility. ‘‘So you have the added issues
sometimes very quick spin-ups. But that’s the big thing.
with the trees. A lot occur at night. And there’s quite a
You’ve got a lot of vegetation, a lot of things blocking
bit of mobile homes in the area.’’ One problem of your view.’’
communicating tornado threats is the ‘‘sneaky’’ nature
of their appearance, or the way they might surprise While storms are difficult to see, which can interfere
people in their path. with people’s ability to judge their risk, the types
According to forecasters, another feature of torna- of homes they live in can contribute to the danger.
does is the lack of a single dominant tornado season, Forecasters noted that ‘‘there are quite few of mobile
which might make an awareness of tornadoes in the homes in the area,’’ which means that ‘‘people have to
public less salient. In this geographic area, tornadoes can take added precautions. They have to actually have a
happen most months throughout the year, including good plan on what to do when something’s heading
during winter holidays and in the summer during out- their direction and where they can go to get out of the
door events. One forecaster noted that the frequency mobile home because it doesn’t take much. I mean just
can even surprise forecasters unfamiliar with the area: even strong winds to have a big impact [on them].’’ This
‘‘I didn’t realize how active this part of the country was description of danger from tornadoes is confirmed by
throughout the year. And I don’t think a lot of people those in emergency management. ‘‘I think our biggest,
did for a long time up until some of those outbreaks in most real risk, weather wise, to life and property are
2011 and onward.’’ What might be described as a con-
tornadoes,’’ one emergency manager said. He contin-
tinual threat of tornadoes in this area, then, creates a
ued, ‘‘Flash floods are real quick, but then they recede
situation where forecasters and the public must attend to
real quick, at least in our county. But the flooding part of
tornadoes throughout the year.
it doesn’t —I’m not as concerned about the flooding as
Detection of tornadoes in this area is largely based on
I am tornadoes.’’
dual-polarization (or dual pol) Doppler radar, which
In terms of danger, then, the consensus for this WFO
allows forecasters to see both rotation and debris being
is that the characteristics of tornadoes—nocturnal, hid-
lofted by the storm, called a debris signature. With dual
pol, ‘‘there’s a lot more things we can detect. . .we can den from view, frequent, and surprising—make them
actually look [at impacts on foliage and] we know potentially more dangerous than flash flooding. The very
there’s a tornado on the ground.’’ This has changed nature of tornadoes contributes to their ability to cause
some of the uncertainty associated with finding partners harm, sometimes regardless of what people do or do not
or members of the public to verify the development of do; for flash floods, the main hazard is driving on sub-
tornadoes, which can be difficult to see given the terrain merged roads, which is as much about human action as it
and nocturnal nature of storms. For some storms, is about the hazard of the water. Believing tornadoes to
‘‘we don’t even have to have storm spotters or any type be more dangerous than flash floods may lead fore-
of visual confirmation’’ one forecaster noted, ‘‘and we’re casters to spend time attending to winds over water.
more likely have a warning that says ‘tornado con-
b. Forecaster beliefs about public awareness for flash
firmed’’’ instead of radar indicated. Being able to more
floods and tornadoes
clearly visualize the tornado on radar also allows them
to include impact-based warning tags in their messaging. Forecasters were asked how they believe their gen-
Other forecasters noted the continued importance of eral public understands and are aware of each threat.
visual confirmation from social media, spotters, and Forecasters conceptualized their publics’ awareness in
partners, especially for lower end tornadoes or those two ways: 1) flash flood warnings can become a nuisance
from a QLCS. and lead to people to dismiss them; whereas tornado
The main danger from tornadoes in this CWA is warnings are attended to and more welcomed by the
twofold: the nature of the storms combined with the public; and 2) flash floods are part of a common, ev-
terrain, and the housing stock. Forecasters noted that all eryday phenomenon, water; tornadoes are scary and
tornadoes are seen as potentially deadly, no matter their uncommon in an individual’s direct experience. In this
Unauthenticated | Downloaded 01/15/22 07:17 PM UTCAUGUST 2020 HENDERSON ET AL. 1469
analysis, forecasters believe their public sees flash floods familiar part of people’s world. Because flash flooding
as less dangerous than tornadoes. can be dangerous, however, forecasters believe these
Forecasters noted that the public largely sees flash warnings should have more importance in people’s as-
flood warnings as a nuisance or question its relevance to sessment of their risks. Many of their warnings, for ex-
their lives. Forecasters suggested that when individuals ample, highlight the advice to ‘‘turn around, don’t drown.’’
receive flash flood warnings through wireless emergency Forecasters note that because people fear tornadoes,
alerts (WEA) on their phones, for example, they may they are more likely to attend to those warnings. One
believe a warning for their area does not affect them forecaster succinctly noted this issue: ‘‘People are very
because of where they live relative to the general threat. sensitive, so I would say raw.’’ He continued, noting his
As one forecaster explained: ‘‘In the past, I’ve had own personal connection to the fear of tornadoes:
people talk about flash flooding and have made com-
‘‘Yeah, on a warm, humid, windy day, the alarms start
ments, ‘Oh, well I live on a hill. I don’t have to worry
going off, and people think—I mean even my wife will
about that.’ I think most people ignore flash flood leave—she’s very much a layperson in terms of weather,
warnings.’’ Others noted that the public is not convinced but on certain days like she’s asking if there’s any, you
of the importance of flash flood warnings. ‘‘When those know, bad weather.’’
WEAs came out, the local news did a story on them. I
think there was a lot of flash flood warnings going off at Other forecasters noted the significance of past tor-
one point and people were like, ‘Why do we care about nado disasters in shaping people’s awareness and fear of
this?’’’ This indicates that forecasters believe the public tornadoes, given the widespread nature of the impacts
may not see flash flooding as relevant to their particular and the number of deaths. ‘‘I think [people have] gotten
context. ‘‘I would think that, unless you have an in- more aware of tornadoes. And maybe they’ve always
stance where you’ve experienced [flash flooding],’’ been. . . Over the past few years, I think there’s even
one forecaster explained, ‘‘I would think a lot of times more. . .so I think overall, most people are pretty cog-
people will ignore those over the others—like severe nizant of tornadoes.’’
thunderstorm–type warnings or tornado warnings. If In terms of warnings, forecasters believe that mem-
you’ve experienced [flash flooding], you probably are a bers of their public want to know if there’s a possible
little more sensitive to it.’’ Except for instances of per- tornado detected, no matter how often they occur. For
sonal experience, forecasters believe the public is less flash flooding, it can be opposite. One forecaster noted,
likely to prioritize flash floods warnings in favor of other ‘‘I might hear ‘Oh, how can I get this flash flood thing
kinds of convection related warnings.3 turned off my phone.’ I didn’t ever hear that, maybe
Another reason forecasters believe the public is not as never is the right word, but rarely ever that about a
attentive to flash flood warnings is the familiarity of tornado.’’ Another explained that in their conversations
water. The problem with seeing flash flooding as a with different members of the public over the years, in
dangerous threat, one forecaster suggested, is because general tornado warnings were not something people
the main element of the threat is composed of a sub- wanted to dismiss. ‘‘From my experience of talking to
stance people experience every day. people about it, it just seemed like they were really an-
noyed by the flash flood warnings. Tornado warning,
‘‘I don’t think that with flash flooding people think about
they were like okay, like if I knew something’s going on,
it in the way they should. . . I think in general I think that
they want to know about it.’’ Forecasters, then, suggest
people aren’t [aware] at all. I mean it’s one of those
things. . . I just think people don’t—they just think that their public believes that flash flood events and
it’s water.’’ warnings are not as desirable risk information as tor-
nado events and warnings.
The ubiquitous experience people have with water—in Amplification and attenuation of threats can emerge
their homes, in rivers and oceans, in rainfall and its be- from individual and collectively shared beliefs. Results
havior during storms—may create circumstances in suggest that forecasters’ beliefs about the dangers of
which a flash flood is not visible as a threat but as a tornadoes and flash floods parallel how they characterize
their public’s beliefs about these same threats: Tornadoes
are usually dangerous whereas flash flooding can be in the
3
As of 8 January 2020, the NWS implemented Impact-Based right circumstances. Recent research likewise finds that
Warning tags for flash flooding. This new policy will send to the forecasters may share similar beliefs with their publics
Wireless Emergency Alert system only those high-level flash flood
warnings that include damage threat tags of ‘‘considerable’’ or ‘‘cata-
about weather threats (Walters et al. 2020). Such beliefs
strophic.’’ For more information, please see https://www.weather.gov/ may shape decision-making practices in the WFO, in-
media/wrn/FFW-IBW-factsheet.pdf. cluding how forecasters attend to, communicate, and
Unauthenticated | Downloaded 01/15/22 07:17 PM UTC1470 WEATHER AND FORECASTING VOLUME 35
FIG. 5. De-identified threat graphics from the WFO that indicate the magnitude and impacts of the (a) rainfall and (b) severe
weather hazards.
warn for events with multiple, overlapping threats. While and forecasters at national offices. The presentation of
the amplification here is subtle, forecasters assessment the threat, with varying colors and categories, also rep-
of the characteristics of each threat and the perception of resent forecaster confidence about what will happen. As
the public’s beliefs seem to make tornadoes more salient one forecaster explained,
as a danger. This could then lead forecasters and their
‘‘A certain color we call limited. It means something is
publics to attend more to tornado threats than flash flood
possible. Elevated means it still may be possible, but
threats when both occur. we’re a little more confident that that could occur. And
c. Terminology and national office influence then we start to get—when you go to high and extreme,
that means you’re confident of more significant, severe
weather. Extreme is pretty much on the top end. You’re
1) GRAPHICASTS
confident in very extreme weather.’’
Like many others, this WFO generates threat
In the examples below, which were disseminated early
graphics, called graphicasts, to convey the magni-
in the morning of the TORFF event, flash flooding
tude, timing, locations, and impacts of the event.
and tornado threats were separately messaged, one per
They are shared with emergency managers and other
graphic, with flash flooding categorized under the heading
partners through briefing packages, webinars, social ‘‘heavy rain’’ (Fig. 5a) and tornadoes under ‘‘severe
media, and the office website with members of the weather’’ (Fig. 5b). On the WFO website, the severe
public. Graphicasts are a result of interoffice, collabo- weather graphic appeared first. A second tab explained
rative conversations about the threat as it evolves in the the threats for heavy rain, an ordering that suggested
time leading up to the initiation of an event, and they severe weather was the most important threat to which
account for negotiations between assessments of various forecasters feel the public should attend.
models and observations, past experiences and analogs The language used for each threat likewise suggested
for the event, as well as discussions with adjacent offices that, for the upcoming event, tornadoes would be more
Unauthenticated | Downloaded 01/15/22 07:17 PM UTCAUGUST 2020 HENDERSON ET AL. 1471
of a potential risk. In the severe weather graphic, the might obscure the magnitude of the threat, which was
hazards were divided by categories of threat severity: noted further down in the bulleted subheadlines.
significant, elevated, and limited, noted in descending ‘‘Severe weather’’ on the other hand (Fig. 5b), is not
order (Fig. 5b). In the significant category, there was a so much descriptive as evocative of the risk itself. It is
greater threat for certain areas of the CWA where akin to saying the weather will be dangerous, which
‘‘tornadoes, damaging wind gusts, and small hail’’ implies a greater degree of amplification.
were the main issue (Fig. 5b). For those members of Forecasters were unsure of the historical evolution of
the public in the red shaded areas, which corresponded threat language used for tornadoes and flash floods.
to the red highlighted text, forecasters implied the However, one forecaster noted the conundrum posed by
threat is greatest. Additionally, the language ‘‘a strong the difference in description: ‘‘Severe weather is haz-
tornado is possible’’ suggested that tornado threats ardous weather, but not all hazardous weather is severe
might be not only possible but deadly (Fig. 5b). As weather, like flash flooding.’’ Severe weather, he ex-
forecasters explained in office conversations, mention plained, is synonymous with convection; flash flooding is
of a strong tornado in a graphic indicates they believe hydrology. ‘‘When a forecaster is talking about severe
some storms may produce EF2 or EF3 tornadoes, weather, they’re generally talking about something that
which suggests a higher chance for loss of life. It is SPC would be dealing with. And then there’s everything
unclear if this assumption would be common knowl- else.’’ Thus, the legacy of the classification of phenom-
edge for partners or members of the public. Individuals ena according to meteorological and atmospheric pro-
in the ‘‘significant threat’’ category, then, would likely cesses, and the language used to describe the threat,
need a well-built structure or storm shelter available to shapes risk communication.
withstand a more deadly magnitude of tornadoes that
2) STORM PREDICTION CENTER
could occur. The lower magnitude categories omitted
the word ‘‘strong’’ and indicate with modifiers ‘‘some’’ Another mechanism that can amplify or attenuate a
and ‘‘few’’ indicating the scope and scale of the hazard is the forecaster’s use of and coordination
threat (Fig. 5b). with a national forecast office, such as the SPC. In
Graphicasts for precipitation mentioned risks for flash part, this coordination reflects the National Weather
flooding, but the language describing the threat attenu- Service’s effort to be consistent in their communica-
ated the risk. In the graphic ‘‘heavy rain,’’ the threat tions with partners and publics. This is evident in the
extended beyond the timing of the severe weather to adoption of SPC outlook boundaries and categories
involve ‘‘multiple rounds,’’ which suggests several in- by WFOs in their local communications. Coordination
stances of flash floods (Fig. 5a). The bulleted text under also occurs between the SPC and local WFO before a
‘‘impacts’’ indicated there would be a significant threat tornado watch is issued to determine specific geogra-
for members of the general public for flooding, which phies to be included or excluded. The same was not
‘‘may threaten homes and close roads later tonight’’ observed for flash flooding and the Weather Prediction
(Fig. 5a). This implies that not only is danger high should Center (WPC).
individuals drive through flooded streets but also that In many instances during observations, the SPC
water may come into people’s homes as they are shel- products influenced interoffice discussion and commu-
tering in place. While there is no implicit magnitude of nication with partners and the public. In part, the SPC
flood that corresponds to the category of significant, as influence can be seen in the timing for possible threats in
there is with tornadoes (e.g., EF2), the red highlighting the WFO’s graphics and discussion spaces. For example,
and all caps of the word suggests danger to life and about a week before the TORFF event in question, the
property (Fig. 5a). SPC noted in its forecast discussion possible tornadoes
The choice of headlines for each threat conveys in late March, or day 7 of its convective outlooks. With
forecasters’ prioritization of threats to the public. each successive daily SPC outlook, the likelihood of
‘‘Heavy rainfall’’ as a classification for the dangers of potential tornadic storms increased in certainty, with a
flash flooding is descriptive of the phenomena in a ‘‘Slight Risk’’ introduced for the CWA and other areas
literal way: there will be rainfall and it will be heavy. on day 4. The SPC’s mention of strong storms on day 7
Rainfall, even if heavy, does not suggest risk so much also cued forecasters to begin communicating possible
as a familiar phenomenon for an area that receives severe weather for the late March time frame, nearly a
significant precipitation each year. The impacts and week before the event occurred. In their area forecast
severity of the threat were in smaller font and re- discussion (AFD) at 0400 LT about a week before the
quired the reader to attend to the details (Fig. 5a). event, for example, the long term forecast directly
That is, mention of rainfall rather than flash flooding mentioned this influence with the SPC:
Unauthenticated | Downloaded 01/15/22 07:17 PM UTC1472 WEATHER AND FORECASTING VOLUME 35
expertise between local offices and the SPC about in-
“TO MAINTAIN CONSISTENCY WITH LATEST SPC
terpretation of guidance.
OUTLOOKS, WILL CONTINUE TO LEAVE SEVERE MENTION
These examples also illustrate how influential the SPC
OUT OF THE HAZARDOUS WEATHER OUTLOOK...THOUGH
can be relative other national offices, like the WPC,
THIS IS PRIMARILY DUE TO QUESTIONS IN TIMING
which issues guidance for precipitation. As one of the
AND NOT OVER THE EXISTENCE OF POTENTIAL FOR
management staff noted of this difference:
SEVERE WX.”
‘‘For pretty much my entire career, the SPC has played a
The SPC had noted ‘‘strong to severe thunderstorms’’
pivotal role in the message that gets conveyed by a local
on day 4 across the area, though ‘‘A GREATER office for severe weather. Now, offices might nuance the
SEVERE LIKELIHOOD SHOULD ARRIVE INTO wording, do some things to give themselves some more
DAY 5/SUNDAY ACROSS THE MID-SOUTH/DEEP flexibility, but there’s always been this fairly close cor-
SOUTH/TN VALLEY AND POSSIBLY THE OH relation between what SPC says and what a local office
VALLEY.’’ This prompted the WFO to issue a does. I think part of that is because SPC has a direct
‘‘Limited Threat’’ outlook on day 4, which was later role in the watch/warning process. I mean, they’re ac-
removed by the WFO when confidence for a diminished tually issuing the tornado watch and the severe thun-
threat emerged. At 0500 LT a few days before the derstorm watch. I think that the same relationship with
TORFF event, the office AFD noted this change. ‘‘IT regard to flash flooding and WPC has not existed in
the past.’’
NOW LOOKS LIKE THE THREAT FOR ANY
SEVERE STORMS WILL BE VERY MINIMAL In part, he explained, hydrology has been managed by
FOR THE FORECAST AREA...BUT THE OVERALL the local office so flash flood watches are issued in the
SEVERE THREAT HAS DROPPED ENOUGH TO WFO, whereas severe weather has been managed na-
REMOVE THE LIMITED THREAT FROM THE tionally. This forecaster also highlighted more recent
HAZARDOUS WEATHEROUTLOOK/GRAPHIC...AND efforts given the NWS emphasis on consistency for local
THIS FOLLOWS IN LINE WITH SPC.’’ Coordination offices to coordinate their message with the WPC, in-
with the national office for tornado threats is a primary cluding excessive rainfall outlooks and other products.4
practice for adjudicating local tornado threats, which Yet, there is still a difference in how offices approach
can, at times, create challenges for communication as the two national centers: ‘‘I think [these efforts] are in-
forecasts change. creasing the collaboration and increasing the role that
If flash flooding were to transition to become the WPC has in the process. But I would still say that it’s
dominant threat, consistency with the SPC could raise not as defined or strong as SPC’s role is in the severe
issues for messaging. For example, the Meteorologist in program.’’ The potential is thus embedded in the rela-
Charge (MIC) explained a communication challenge for tionships between local and national centers for an
the local office that centered on the SPC mentioning a amplification of tornado threats over flash flood threats
risk for strong tornadoes on day 7 of their outlooks. as forecasters use and rely on SPC products in their in-
Because of the SPC day 7, the MIC noted that ‘‘we’ve ternal analysis and warning decisions and in communi-
been ramping up the tornado risk for the last week so if cation with the public.
we downgrade now, we’ll send a signal that there’s less
d. Warning practices and organization
risk—and there’s not for some folks. . .’’ This created a
potential issue in conveying the dynamic nature of Important to understanding an amplification of threats
threats both because of the increase in flash flood threats is the way that expertise is organized, both through
and the de-escalation of the tornado threat. The MIC management approaches, such as sectorization and as-
concluded that ‘‘In the future, we should wait until signment of staff, and through spatial layout of the office,
we’re a few days out before we ramp up.’’ This addi- which can reflect aggregation of threat expertise. How a
tional time would allow more certainty to develop the threat is managed can reflect the values of the office,
forecast and for messaging to be more consistent with policies and procedures, local forecaster culture, past
the evolving changes in weather. Similarly, because local experience, and assumptions about workflows. It also
WFO graphics for severe weather are taken from the reflects the difficulties of TORFFs when a dominant
risk categories set by the SPC, changes in their outlooks
and decisions about increases or decreases in the threat
directly impact the information the local WFO sends to 4
The WPC began to mirror SPC products with excessive rainfall
its users. Together, the graphics and discussion at the outlooks through 3 days expressed categorically beginning in 2014
national level can become a challenging issue when a and mesoscale precipitation discussions that parallel SPC’s meso-
threat changes or when there are disagreements in scale discussion beginning in 2013.
Unauthenticated | Downloaded 01/15/22 07:17 PM UTCYou can also read


