A daily temperature rhythm in the human brain predicts survival after brain injury
←
→
Page content transcription
If your browser does not render page correctly, please read the page content below
https://doi.org/10.1093/brain/awab466                                                                   BRAIN 2022: 145; 2031–2048 | 2031

A daily temperature rhythm in the human
brain predicts survival after brain injury
  Nina M. Rzechorzek,1 Michael J. Thrippleton,2,3 Francesca M. Chappell,3
  Grant Mair,2,3 Ari Ercole,4 Manuel Cabeleira,5 The CENTER-TBI High Resolution

                                                                                                                                                         Downloaded from https://academic.oup.com/brain/article/145/6/2031/6604351 by guest on 04 August 2022
ICU (HR ICU) Sub-Study Participants and Investigators, Jonathan Rhodes,6,†
  Ian Marshall2,3,† and John S. O’Neill1,†

†
 These authors contributed equally to this work.

Patients undergo interventions to achieve a ‘normal’ brain temperature; a parameter that remains undefined for hu-
mans. The profound sensitivity of neuronal function to temperature implies the brain should be isothermal, but ob-
servations from patients and non-human primates suggest significant spatiotemporal variation. We aimed to
determine the clinical relevance of brain temperature in patients by establishing how much it varies in healthy
adults.
We retrospectively screened data for all patients recruited to the Collaborative European NeuroTrauma Effectiveness
Research in Traumatic Brain Injury (CENTER-TBI) High Resolution Intensive Care Unit Sub-Study. Only patients with
direct brain temperature measurements and without targeted temperature management were included. To interpret
patient analyses, we prospectively recruited 40 healthy adults (20 males, 20 females, 20–40 years) for brain thermom-
etry using magnetic resonance spectroscopy. Participants were scanned in the morning, afternoon, and late evening
of a single day.
In patients (n = 114), brain temperature ranged from 32.6 to 42.3°C and mean brain temperature (38.5 ± 0.8°C) exceeded
body temperature (37.5 ± 0.5°C, P < 0.0001). Of 100 patients eligible for brain temperature rhythm analysis, 25 dis-
played a daily rhythm, and the brain temperature range decreased in older patients (P = 0.018). In healthy partici-
pants, brain temperature ranged from 36.1 to 40.9°C; mean brain temperature (38.5 ± 0.4°C) exceeded oral
temperature (36.0 ± 0.5°C) and was 0.36°C higher in luteal females relative to follicular females and males (P =
0.0006 and P < 0.0001, respectively). Temperature increased with age, most notably in deep brain regions (0.6°C
over 20 years, P = 0.0002), and varied spatially by 2.41 ± 0.46°C with highest temperatures in the thalamus. Brain tem-
perature varied by time of day, especially in deep regions (0.86°C, P = 0.0001), and was lowest at night. From the
healthy data we built HEATWAVE—a 4D map of human brain temperature. Testing the clinical relevance of
HEATWAVE in patients, we found that lack of a daily brain temperature rhythm increased the odds of death in inten-
sive care 21-fold (P = 0.016), whilst absolute temperature maxima or minima did not predict outcome. A warmer mean
brain temperature was associated with survival (P = 0.035), however, and ageing by 10 years increased the odds of
death 11-fold (P = 0.0002).
Human brain temperature is higher and varies more than previously assumed—by age, sex, menstrual cycle, brain
region, and time of day. This has major implications for temperature monitoring and management, with daily brain
temperature rhythmicity emerging as one of the strongest single predictors of survival after brain injury. We con-
clude that daily rhythmic brain temperature variation—not absolute brain temperature—is one way in which human
brain physiology may be distinguished from pathophysiology.

Received May 03, 2021. Revised November 03, 2021. Accepted November 20, 2021. Advance access publication June 13, 2022
© The Author(s) 2022. Published by Oxford University Press on behalf of the Guarantors of Brain.
This is an Open Access article distributed under the terms of the Creative Commons Attribution License (https://creativecommons.org/licenses/by/4.0/),
which permits unrestricted reuse, distribution, and reproduction in any medium, provided the original work is properly cited.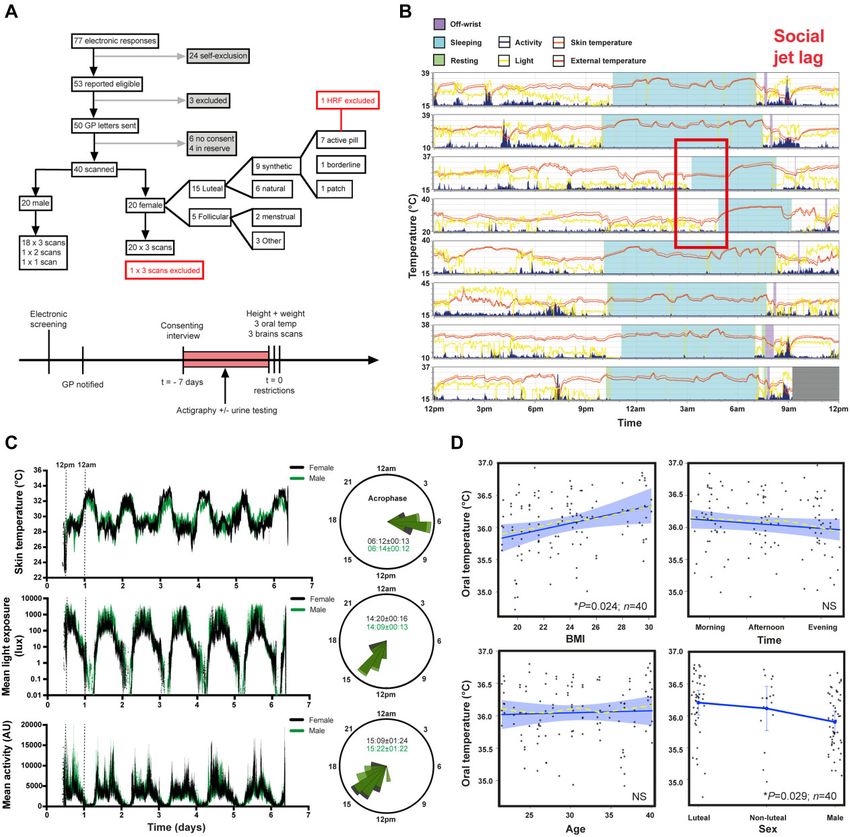
2032 | BRAIN 2022: 145; 2031–2048                                                                                  N. M. Rzechorzek et al.

1 MRC Laboratory of Molecular Biology, Cambridge CB2 0QH, UK
2 Edinburgh Imaging (Royal Infirmary of Edinburgh) Facility, Edinburgh EH16 4SA, UK
3 Centre for Clinical Brain Sciences, University of Edinburgh, Edinburgh EH16 4SB, UK
4 Division of Anaesthesia, University of Cambridge, Box 93 Addenbrooke’s Hospital, Cambridge CB2 0QQ, UK
5 Division of Neurosurgery, Department of Clinical Neurosciences, University of Cambridge, Box 167, Cambridge
  Biomedical Campus, Addenbrooke’s Hospital, Cambridge CB2 0QQ, UK
6 Department of Anaesthesia, Critical Care and Pain Medicine, NHS Lothian, Room No. S8208 (2nd Floor), Royal
  Infirmary of Edinburgh, Edinburgh EH16 4SA, UK

Correspondence to: Nina Rzechorzek
MRC Laboratory of Molecular
Biology Cambridge, CB2 0QH, UK
E-mail: ninar@mrc-lmb.cam.ac.uk

                                                                                                                                                 Downloaded from https://academic.oup.com/brain/article/145/6/2031/6604351 by guest on 04 August 2022
Correspondence may also be addressed to: John O’Neill
E-mail: oneillj@mrc-lmb.cam.ac.uk
Keywords: brain temperature; brain thermometry; daily; brain injury; mortality
Abbreviations: BMI = body mass index; CBF = cerebral blood flow; CENTER-TBI =Collaborative European
NeuroTrauma Effectiveness Research in Traumatic Brain Injury; TBI = traumatic brain injury; MRS =magnetic
resonance spectroscopy; MSFsc = sleep-corrected midpoint of sleep on free days; TBo = body temperature; TBr = brain
temperature; TTM = targeted temperature management

Introduction                                                            thermometry has proven to be a powerful research application of
                                                                        MRS but, with respect to healthy humans, it has only been used
Abnormal temperature has been recognized as a sign of disease for       in studies that were not designed to explore time-of-day variation
more than two millennia.1 Both the temporal and spatial dynamics        in temperature (Supplementary Table 1). We sought to undertake
of temperature contain additional diagnostic information, exem-         an evidence-driven appraisal of the clinical value of TBr in patients
plified by disrupted circadian rhythms, and local warming at sites       by establishing its spatiotemporal variation in healthy adults. We
of injury or infection.2–9 Brain temperature (TBr) is rarely measured   hypothesized that healthy human TBr would vary diurnally (in the
directly since invasive methods are required; in practice, it is as-    manner expected for a daytime active mammal), and that disrup-
sumed to match the body core, overlooking the clinical importance       tion of daily temperature variation would be associated with out-
of brain-specific measurements. Brain cell function is unequivocal-      come after traumatic brain injury (TBI).
ly temperature-dependent however,10,11 and it is accepted that ab-
solute TBr, its relationship to body temperature (TBo), and the
apparent temperature-sensitivity of brain tissue are frequently al-
tered following injury.3,7,8,12,13 Indeed, our understanding
                                                                        Materials and methods
of human TBr has largely been informed by studies of brain-injured      Reporting adheres to STROBE guidelines (Supplementary material).
patients, where intracranial probes allow precise (±0.1–0.3°C), dir-    All results are reported ± standard deviation (SD) unless otherwise
ect measurement from a single brain locus.14,15 The clinical rele-      stated. See Supplementary Box 1 for definitions of terms and
vance of these data is obscured entirely by the lack of a               phrases that have a specific meaning within the context of this
comprehensive reference dataset; application of targeted tempera-       work, but which may have alternative meanings in other contexts.
ture management (TTM) in neurocritical care thus remains highly
controversial.
                                                                        Ethics approval
    Despite its irrefutable clinical value, the normal range of human
TBr is unknown. Whilst the temperature-dependence of brain func-        For TBI patient data analysis, approval was provided by NHS
tion has perpetuated the assumption that TBr is maintained within       Scotland (14/SS/1086, R&D Department, University Hospitals
a very narrow range, several lines of evidence suggest that healthy     Division NHS Lothian 2015/0171) for data collected at the
TBr may vary over time, and between brain regions.4,5,7,9,12,13,16–20   Intensive Care Unit, Western General Hospital, Edinburgh, UK. For
For example, human core TBo is 1–2°C lower during sleep, when           data extracted from other clinical sites via the CENTER-TBI data-
cerebral blood flow (CBF) is also 20% higher21,22; therefore, brain     base, the CENTER-TBI study was conducted in accordance with all
heat removal should be more efficient at night than during the           relevant laws of the EU if directly applicable or of direct effect and
day. Moreover, direct measurements in non-human primates                all relevant laws of the country where the recruiting sites were lo-
show that deep brain structures are warmer than its surface and         cated, including but not limited to, the relevant privacy and data
that TBr varies at least as much as TBo across a 24-h period.19,20      protection laws and regulations (the ‘Privacy Law’), the relevant
    Deviations of TBr may have transformative diagnostic and/or         laws and regulations on the use of human materials, and all rele-
prognostic utility for acute and chronic brain disorders, but only if   vant guidance relating to clinical studies from time to time in force
these deviations can be distinguished from physiological variation      including, but not limited to, the ICH Harmonised Tripartite
over time.23 With magnetic resonance spectroscopy (MRS), spatial-       Guideline for Good Clinical Practice (CPMP/ICH/135/95) (‘ICH GCP’)
ly resolved TBr data can now be obtained non-invasively.14 Brain        and the World Medical Association Declaration of Helsinki entitled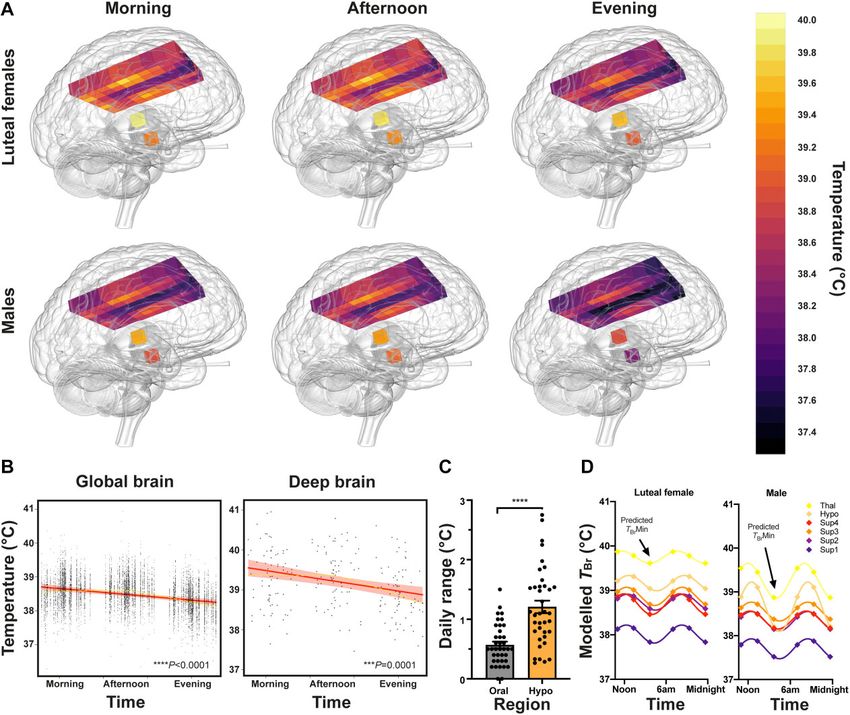
Brain temperature rhythms and mortality                                                                           BRAIN 2022: 145; 2031–2048             | 2033

‘Ethical Principles for Medical Research Involving Human Subjects’.                 Trauma Foundation guidelines.24 Patients were either admitted dir-
Informed consent by the patients and/or the legal representative/                   ectly to intensive care or following surgical intervention for mass
next of kin was obtained, accordingly to the local legislations, for                lesions. TBr was measured via a thermistor, inserted into the brain
all patients recruited in the Core Dataset of CENTER-TBI and docu-                  parenchyma via a dedicated bolt placed via a burr hole (Integra
mented in the e-CRF. Ethical approval was obtained for each re-                     Neurosciences). The bolt was placed so that the thermistor was in-
cruiting site. The list of sites, ethical committees, approval                      serted into frontal white matter at a tissue depth of around 18 mm
numbers and approval dates can be found on the website: https://                    below the dura; for diffuse injuries this was into the non-dominant
www.center-tbi.eu/project/ethical-approval. Prospective data col-                   hemisphere. When the main injury was focal, the bolt was placed
lection in healthy volunteers was co-sponsored by the University                    on the side of maximal injury, unless this would place the monitors
of Edinburgh and NHS Lothian (R&D Project Number 2019/0133).                        into non-viable tissue. High temporal-resolution physiological data
Ethics approval was obtained from the Academic and Clinical                         were recorded at a minimum of 1-min intervals to either a bedside
Office for Research Support (ACCORD) Medical Research Ethics                         computer running ICU Pilot software (CMA) or to a Moberg neuro-
Committee (AMREC; Study Number 18-HV-045). All participants                         monitoring system (Moberg Research Inc.). Data were collected
provided written informed consent to participate.                                   continuously (except for interruptions due to CT scanning or surgi-

                                                                                                                                                                  Downloaded from https://academic.oup.com/brain/article/145/6/2031/6604351 by guest on 04 August 2022
                                                                                    cal intervention) and until intracranial pressure monitoring was no
                                                                                    longer required, or the patient died. Data for the CENTER-TBI study
Patient brain temperature                                                           were collected through the Quesgen e-CRF (Quesgen Systems Inc.),
                                                                                    hosted on the INCF platform and extracted via the INCF Neurobot
Study design and data sources
                                                                                    tool (INCF, Sweden). For patient monitoring and data collection in
We conducted a multicentre, retrospective cohort study of TBI pa-                   the High-Resolution repository, the ICM+ platform (University of
tients that had high temporal-resolution TBr data collected directly                Cambridge, UK) and/or Moberg Neuromonitoring system (Moberg
from the brain. Data for all eligible patients were extracted using                 Research Inc., USA) were used. For TBo, the primary method of
version 2.0 of the CENTER-TBI dataset, compiled between 2015                        measurement was documented in 26 of 134 screened patients
and 2017. Additional eligible patients monitored at one of the con-                 and included tympanic (21), bladder (3), external axillary (1) and
tributing sites (Intensive Care Unit, Western General Hospital,                     nasopharyngeal (1). Secondary sites included rectal, external axil-
Edinburgh, UK) were included up to May 2020 and comprised 109                       lary, oesophageal and skin.
of the 134 eligible patients screened. The Western General
Hospital is the tertiary referral centre in South East Scotland for
                                                                                    Temperature data processing
neurosurgical emergencies. Patients with moderate to severe TBI
admitted to intensive care requiring intubation, sedation, and                      Four inclusion criteria levels were applied to ensure that sufficient
intracranial pressure management also received brain oxygen ten-                    temperature data from the brain and/or body were available to as-
sion and temperature monitoring using the Integra Licox system                      sess for a daily rhythm (Box 1), and that any data potentially af-
(Integra). Patients were managed in accordance with Brain                           fected by TTM protocols were excluded. Analysis of patient

  Box 1 Inclusion criteria for retrospective analysis of temperature data from TBI patients
  Level A: Criteria for extracting maximum and minimum daily brain and/or body temperatures
  • Known sex
  • Known age
  • Minimum 24 h of temperature data collection under ‘constant’ conditions. The first data-point recorded in the intensive care setting that exceeds the
    minimum recorded temperature from that patient in the absence of TTM will be taken as the start point (to exclude low temperature points surrounding
    insertion of probe or those relating to patient hypothermia on arrival in intensive care)
  • For data where only the maximum and minimum daily TBo (and in some cases TBr) are recorded with their respective times, a minimum of two days’ worth
    of data is needed
  • If TTM was applied, only data relating to time preceding TTM or after the first inflection of data after cessation of TTM can be used and must meet the above
    requirements for minimum time length in the absence of TTM
  • When extracting the time of the minimum and maximum temperature point, the first occurrence of that specific temperature point under intensive care
    ‘constant’ conditions will be selected
  Level B: Additional criteria for performing daily rhythmic temperature analyses
  • Minimum hourly TBo or TBr data with TBr data extracted via intracranial probe (standard depth and positioning in cortical white matter) recorded
    continuously over a minimum of 36 h. The same rules as above apply in relation to TTM.
  • Ideally minimum hourly data of another matched parameter [intracranial pressure, partial pressure of brain oxygen (PbTO2), mean arterial pressure] with
    expected daily rhythm
  Level C: Additional criteria for correlation with outcome
  • Mortality/survival in intensive care
  • Ideally, a Glasgow Outcome Scale Extended (GOSE) score at 3 and/or 6 months (imputed where necessary)
  Level D: Additional criteria for correlation with injury severity
  • One of more of the following parameters: presence of pupillary light reflex in one/both/no eyes; Glasgow Coma Scale (GCS) score, Glasgow Coma Scale
    motor response (GCSM) score
  • Ideally injury type (focal/diffuse; from CT scoring) and/or severity [International Mission for Prognosis and Analysis of Clinical Trials in TBI (IMPACT)
    imputed GCS] on admission to Study Hospital and/or Therapy Intensity Level score (including individual components of this)
  • Ideally site of probe insertion for focal injury (ipsilateral or contralateral to injury—to be determined using CT/MRI images if available)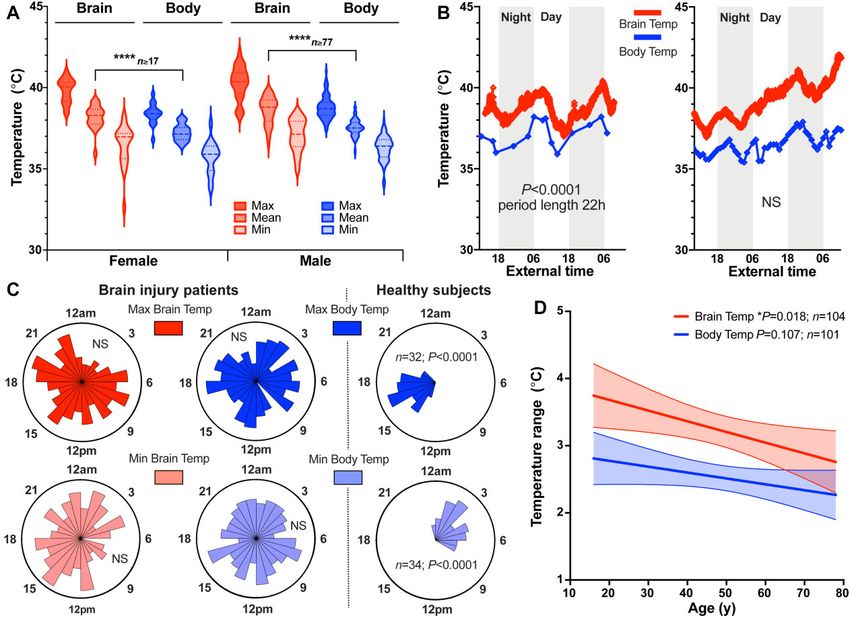
2034 | BRAIN 2022: 145; 2031–2048                                                                                    N. M. Rzechorzek et al.

temperature data was blinded to outcome. Data from the first 2 h of        high-resolution MRI).27 We recruited 40 eligible participants (20 fe-
monitoring were excluded from the analysis to ensure the results          males) for scanning to account for potential withdrawal, exclusion
were not influenced by the time required for the electrode to stabil-      and/or technical scan failure.
ize. Raw data processing was performed in Excel™ to identify any              Recruitment for our prospective study was based on meeting
gaps in the time series, exclude artefactual data (e.g., impossible       criteria for our primary outcome (Supplementary Table 2) and
negative values either side of data gaps) and define the analysis          was conducted locally using mailshots to University of Edinburgh
window. Analysis of patient temperature data served to determine          and NHS staff, social media posts and posters displayed at
whether a daily rhythm was present, agnostic to any relationship          University of Edinburgh campuses and NHS Lothian hospitals. By
with the environmental timing cues. Entrainment by environmen-            completing an online eligibility questionnaire, all prospective par-
tal cues was not assumed, since the amplitude of these cues may be        ticipants provided written informed consent for their personal
diminished in the critical care setting, and their transduction might     data to be used to schedule consenting interviews and to notify
be impaired in TBI patients. Temperature data were first visualized        general practitioners of their intention to participate. The question-
in GraphPad Prism version 8.2 and assessed for the presence of dai-       naire provided access to inclusion and exclusion criteria, the
ly rhythmicity. Visual analyses were validated by testing all data-       Participant Information Sheet and Consent to Participate Form

                                                                                                                                                   Downloaded from https://academic.oup.com/brain/article/145/6/2031/6604351 by guest on 04 August 2022
sets with a battery of rhythm-detection algorithms using                  (Supplementary material) and Data Protection Information sheet.
GraphPad Prism, BioDare2 (biodare2.ed.ac.uk)25 and the Harmonic           All participants provided written, informed consent to participate
Regression package in R.26 To be categorized as having a daily            during face-to-face interview conducted by the Chief Investigator
rhythm, the patient’s temperature pattern need not be aligned             (N.M.R.) at the University of Edinburgh. Additional written in-
with the day-night cycle, but it had to meet both of the following cri-   formed consent was obtained for publication of individual data
teria: (i) a period length of 22–26 h in at least part (but not neces-   which, by nature of its distinctive features, could potentially be re-
sarily all) of the time series as determined by visual analysis of        cognized by participants as their own data. The Study Protocol is
the raw data in GraphPad Prism; and (ii) a period length of 22–26 h       presented in the Supplementary material.
as determined by period analysis in (a) cosinor analysis in
GraphPad Prism and/or (b) statistically significant output from
                                                                          Prospective data collection
Harmonic Regression in R and/or (c) BioDare2.
    In GraphPad Prism, period results were only considered valid          During a consenting interview at the study site, 1 week in advance
if a cosinor curve fit was significantly preferred over a straight          of scanning, each participant was given a wrist-worn actimeter
line. When using the Harmonic Regression package, the period              (ActTrust2, Condor Instruments). Each participant then under-
length term (Tau) of the model to test for was set to 24 h. In            went three identical brain scans in the morning (9–10 am), after-
BioDare2, period analysis was performed using six different al-           noon (4–5 pm) and late evening (11 pm–midnight) of their
gorithms. A full description of these algorithms can be found at          scheduled scanning day. Multiple time points spanning >12 h
https://biodare2.ed.ac.uk/documents/period-methods. All pa-               were selected because the human circadian rhythm (body clock)
tient temperature analyses were blinded to patient outcome                impacts almost every aspect of physiology (Supplementary
and a detailed description of how patient temperature datasets            material).28–31 The exact alignment, or phase relationship, between
were handled using the approaches summarized above can be                 the body clock and the day-night cycle is dictated by individual
found in Supplementary material and Supplementary Fig. 1.                 chronotype, which is determined by genetic and lifestyle factors,
Results for each patient are presented in the Supplementary               and can be derived from longitudinal monitoring of locomotor ac-
material.                                                                 tivity.32 To assign scan times to the appropriate part of each parti-
                                                                          cipant’s circadian cycle, we determined individual chronotypes
                                                                          using wrist actigraphy to extract the sleep-corrected midpoint of
Healthy brain temperature                                                 sleep on free (non-work) days (MSFsc; Supplementary material).32
                                                                              Height and weight were measured immediately before the morn-
Study design and recruitment
                                                                          ing scan to calculate BMI. Oral temperature was recorded before each
We conducted a prospective, single-site, cohort study in healthy          scanning session using a digital Clinical Thermometer (S. Brannan &
adults, controlled for age, sex, body mass index (BMI), menstrual         Sons) covered in a single-use Probe Cover (Bunzl Retail & Healthcare
cycle phase, seasonal variation and individual chronotype. Our pri-       Supplies Ltd.) and placed sublingually. Rectal temperature probes
mary objective was to determine whether healthy TBr varies by time        were not deemed appropriate since these would discomfort volun-
of day. Our secondary objectives were to compare variability in           teers and impede study recruitment without providing TBo measure-
brain and oral temperatures, to test for differences between males        ments that were likely to be any more meaningful for the
and luteal-phase females and to explore brain-regional changes in         interpretation of TBr than those collected sub-lingually. Although de-
TBr with time. We hypothesized that TBr would (i) exceed and vary         sirable, continuous core TBo measurement using ingestible telemetric
more than oral temperature across the day; (ii) be higher in luteal       sensors was precluded due to their incompatibility with MRI. Oral
females relative to males; and (iii) increase with increasing brain       temperature measurements also served to exclude any participants
tissue depth. Sample size was estimated for achieving the primary         with a fever. For females, hormonal influences were controlled
outcome (a change in TBr between time points) using a linear mixed        through urine-based ovulation testing (ClearBlue®) or documenting
model, considering published data on the reliability of MRS brain         hormonal contraception type. We aimed to scan females during the
thermometry in healthy men.14 With 36 subjects, and a conserva-           luteal phase of their natural menstrual cycle, or on a day when an ac-
tive true diurnal mean TBr difference of 0.5°C, we estimated 80%          tive combined pill would be taken, or combined patch worn. Females
power to detect a statistically significant difference between time        using other forms of contraception (implant or intrauterine device)
points at the 5% significance level. A health-related finding on            were excluded. On the day of scanning, food consumption was re-
MRI was the key exclusion criterion and was expected for two vo-          stricted to 6 am–8 am, 12 noon–2 pm and 6 pm–8 pm; caffeine con-
lunteers (based on 5% prevalence of health-related findings using          sumption was restricted to 6 am–8 am and 12 noon–2 pm. Alcohol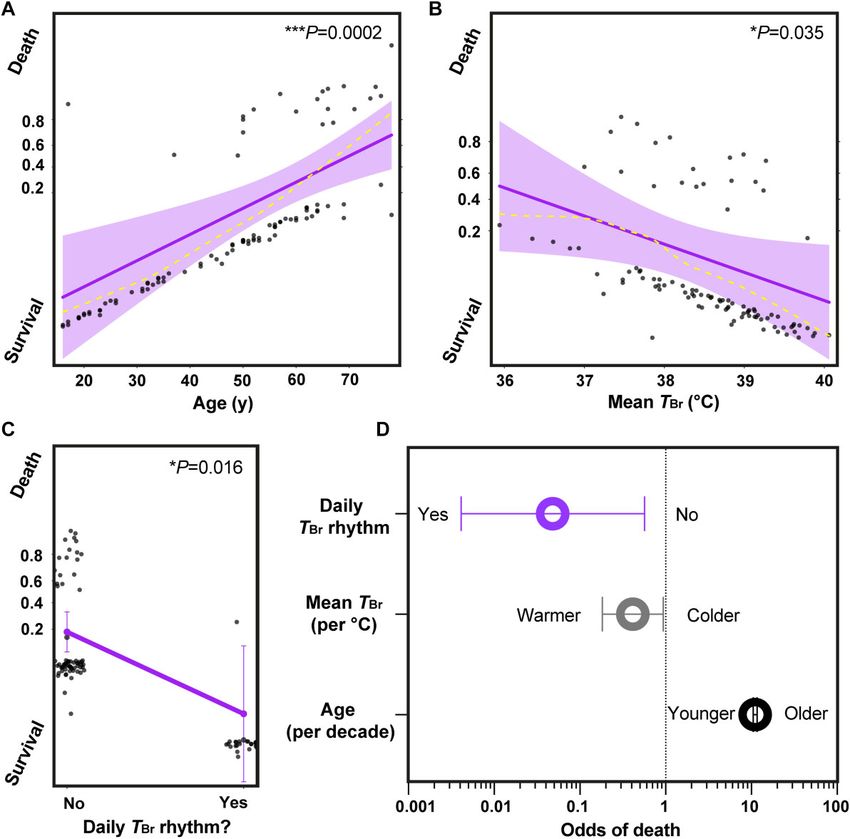
Brain temperature rhythms and mortality                                                                 BRAIN 2022: 145; 2031–2048         | 2035

was strictly prohibited at all times. Participants were asked not to par-   case, an upper limit for the number of fixed effects was set to avoid
ticipate in excessive physical activity on the day of scanning. Data col-   over-fitting each model within the confines of our sample size.35
lection was limited to a 14-week period between July and October 2019       Random effects for intercept and slope were included, allowing par-
to avoid daylight savings clock changes and large seasonal variation        ticipants to have different baseline temperatures and different
in environmental light and temperature conditions. Data manage-             changes in temperature over time. The models for oral temperature
ment procedures are described in Supplementary material.                    (OralTemp) and TBr (BrainTemp) were built as follows:

Brain imaging                                                                  OralTempij = [intercept(b0) + Time(b1) + Sex(b2)
                                                                                              + EdTemp(b3) + Age(b4) + BMI(b5)]
All brain imaging was conducted at the Edinburgh Imaging (Royal
                                                                                              + 1ij (residuals for subject i at time j)
Infirmary of Edinburgh) Facility using a 3-T MAGNETOM Prisma scan-
ner (Siemens Healthcare) with a 32-channel head coil. All participants                        + U1i (intercept for subject i)
were screened for MRI contraindications and changed into hospital                             + U2i (slope for subject i in relation to Time)    (2)
scrubs for each scanning session—conducted in a temperature-
controlled room (target 21.5°C). Room lights were off and the scanner       where fixed effects include: Time (time of day normalized for

                                                                                                                                                       Downloaded from https://academic.oup.com/brain/article/145/6/2031/6604351 by guest on 04 August 2022
lighting and fan were maintained on their lowest setting. Ear protec-       chronotype using the ‘time distance’ between the TOral measure-
tion was provided and a mirror was attached to the head coil so parti-      ment and MSFsc for that participant as a proportion of a linearized
cipants had the choice of closing their eyes or viewing the MRI control     unit circle where 0 = MSFsc and 1 = 24 h); Sex (participant biological
room; no visual or acoustic entertainment was provided. At each time        sex categorized as male, luteal female, or non-luteal female);
point, after whole-brain structural MRI, MRS data were collected from       EdTemp (environmental temperature in Edinburgh on that date
82 brain locations (voxels). Since the main objective of our study was to   and at the time of temperature measurement); Age (participant
determine how human TBr varies over the course of a normal day, it          age on date of temperature measurement); BMI (participant BMI
was designed to include time points that covered the range of waking        on date of temperature measurement), with random effects for
hours for most people, without disrupting normal sleep patterns, nor        intercept by subject and for slope by subject with respect to time.
imposing any restrictions on vigilance state. Whilst the protocol was
not designed to formally assess vigilance state, we anticipated that           BrainTempij = [intercept (b0) + Time(b1) + Sex (b2)
some participants might fall asleep during scanning (particularly at                           + BrainRegion(b3) + Age(b4) + Sleep(b5)]
the late evening session), and that this might be associated with                              + 1ij (residuals for subject i at time j)
changes in MRS-derived TBr.33 Participant self-reported sleep was                              + U1i (intercept for subject i)
documented at the end of each session so that this could be incorpo-                           + U2i (slope for subject i in relation to Time)   (3)
rated into our analysis as a fixed effect. The scanning protocol was
well tolerated, with no serious adverse events reported during 7-day        where fixed effects include: Time (time of day normalized for chron-
follow-up. Further details on the scanning protocol, MRS data process-      otype using the ‘time distance’ between the TBr measurement and
ing and the dedicated Study Participant Data Form (Case Report Form)        MSFsc for that participant as a proportion of a linearized unit circle
are provided in Supplementary material.                                     where 0 = MSFsc and 1 = 24 h); Sex (participant biological sex categor-
                                                                            ized as male, luteal female, or non-luteal female); BrainRegion (brain
Calculation of MRS-derived brain temperature                                voxel categorized to one of six regions: Superficial 1, Superficial 2,
                                                                            Superficial 3, Superficial 4, Thalamus, Hypothalamus); Age (partici-
MRS brain thermometry exploits the fact that the chemical shift of
                                                                            pant age on date of temperature measurement); and Sleep (whether
water is exquisitely temperature-dependent (−0.01 ppm/°C), whilst
                                                                            participant reported falling asleep during scanning; categorized as
that of the reference metabolite NAA is not.34 The chemical shift
                                                                            ‘yes’, ‘maybe’ or ‘no’) with random effects for intercept by subject
difference between water and NAA can estimate absolute TBr in
                                                                            and for slope by subject with respect to time.
healthy males with a short-term precision of 0.14°C at 3-T.14 TBr
                                                                               To confirm that there was no relationship between TBr and BMI,
for each brain tissue voxel in this study was calculated using the
                                                                            the model was run a second time, but replacing the Sleep effect
following relationship:
                                                                            with BMI. The model for deep TBr was identical to the BrainTemp
                                                                            model above except that only thalamic and hypothalamic regions
     TBr = 100 × [NAA frequency–H2 O frequency + 2.665] + 37          (1)
                                                                            were included (Supplementary material).
                                                                               For the final analysis of patient data, a generalized linear mixed
where frequency is in parts per million and temperature is in de-
                                                                            model for logit binomial distribution of patient outcome was cho-
grees Celsius.
                                                                            sen (the rationale for model choice is provided in Supplementary
   The reliability and accuracy of TBr determination using this MRS
                                                                            material). Survival in intensive care or ‘alive’ was specified as a
protocol was thoroughly tested using in vivo human and in vitro
                                                                            miss and death or ‘dead’ as a hit. The model incorporated fixed ef-
phantom measurements; the latter validated with a magnetic
                                                                            fects and random effect for intercept and was built as follows (‘daily
resonance-compatible industrial thermometer that meets inter-
                                                                            rhythm’ results were included for TBr only):
national standards.14

                                                                            Outcomei = [intercept(b0) + Age(b1) + Sex(b2) + BrainMean(b3)
Statistical analysis                                                                  + BrainRange(b4) + Daily(b5)]
To determine healthy temperature variation, we applied a linear                          + 1ij (residuals for patient i)
mixed modelling approach (Supplementary material). The fixed ef-                          + U1i (intercept for patient i)                         (4)
fects (predictors) were specified a priori based on published litera-
ture describing factors that were most likely to affect body and/or         where fixed effects include: Age (patient age in intensive care); Sex
brain temperature in humans and other mammals.23 In each                    (patient biological sex categorized as male or female); BrainMean
2036 | BRAIN 2022: 145; 2031–2048 N. M. Rzechorzek et al.
(absolute mean TBr throughout analysis window); BrainRange (TBr were available for TBo only). Outcome in intensive care was avail-
range across analysis window); Daily (presence or absence of a daily able for 113/114 patients (criteria levels A and C), one or more injury
TBr rhythm within analysis window—categorized as ‘yes’ or ‘no’; severity scores (presence of a pupillary light reflex, Glasgow Coma
see above for details on how tests for daily rhythmicity were per- Scale and/or Glasgow Coma Scale motor response) were available
formed), with random effects for intercept by subject. for 109/114 patients (criteria levels A and D). A total of 105 patients
The choice of fixed effects (predictors) to include in the model met all criteria levels; summary data for patients meeting key cri-
was based on our core study objectives, avoiding redundant terms teria levels are shown in Table 1. Mean TBr (38.5 ± 0.8°C) was signifi-
and optimizing the model fit (Supplementary material). Missing cantly higher than mean TBo (37.5 ± 0.5°C; P < 0.0001, Fig. 1A), with a
data values for any of the model components were input as ‘NA’ range of 32.6 to 42.3°C. TBr was not affected by the site of intracra-
and thus patients with values missing for one or more of the nial probe placement relative to focal injury (Supplementary Fig.
components were excluded from the model output. The most con- 2). We found an approximately daily temperature rhythm in 27/
servative approach was taken i.e., multiple imputation was not 110 patients; 25 of these patients had a daily rhythm in TBr and 11
performed since the random nature of missing data could not be had a daily rhythm in TBo (with nine having a daily rhythm in
assumed. both temperatures; Fig. 1B and Supplementary Fig. 3). However,
Downloaded from https://academic.oup.com/brain/article/145/6/2031/6604351 by guest on 04 August 2022
Statistical modelling and other circular analyses were performed across the cohort, the timings of temperature maxima and minima
using R version 3.6.336 and the circular,37 cosinor,38 cosinor2,39 were poorly aligned with the external day-night cycle. This uncoup-
lme4,40 effects,41 afex,42 Matrix,43 Cairo,44 yarrr,45 and car41 ling of internal timing from the external solar cycle is typical of
packages. The full reproducible code is provided in Supplementary temperature rhythms when external timing cues are diminished;46
material or is available on request to the lead author. All other ana- it lies in stark contrast to rectal temperature data from healthy in-
lyses were performed in GraphPad Prism version 8.2. dividuals maintained under similar conditions but with daily light/
dark and feed/fast cues that normally function to synchronize the
Data availability body’s circadian rhythms with external environmental cycles
(Fig. 1C). Notably, there was a relationship between TBr and age;
Individual patient data contained within the CENTER-TBI database TBr range was reduced in older patients (P = 0.018), driven predom-
are not publicly available but permissions for access can be re- inantly by an upward trend in minimum TBr (Fig. 1D and
quested at https://www.center-tbi.eu/data. We are committed to Supplementary Fig. 4).
sharing all other anonymized individual participant and patient
data that would support further research. All shareable items are
Chronotype-controlled spatiotemporal
available immediately upon publication and indefinitely, or ending
measurements of human brain temperature
5 years following article publication, by reasonable request from
the corresponding author(s). Shareable items will be available to Whilst the patient data were consistent with our hypothesis of TBr
anyone who wishes to access them and for any purpose. Code for rhythm disruption in the context of brain injury, this was based on
statistical modelling is provided in Supplementary material or is an assumption that human TBr normally varies by time of day. We
available on request to the corresponding author(s). set out to validate this prediction using MRS. Of 77 volunteers
screened for eligibility, we recruited 20 males and 20 females
(aged 20–40 years) between July and September 2019 (Fig. 2A).
Results Participants represented 15 nationalities across five continents
and the last participant was scanned on 8 October 2019. One male
Brain temperature variation after traumatic brain
attended only for morning scanning and another male volunteer
injury
missed afternoon scanning; available data from both of these par-
Of 134 eligible patient records screened, 114 had at least 24 h of ticipants were included in the analysis. Of the females scanned,
temperature data recorded (criteria level A). Of these, 110 patients 11 had natural menstrual cycles, eight were taking a combined
had sufficient temperature data (≥36 h) for daily rhythm analysis contraceptive pill and seven of these took an ‘active’ pill on the
(criteria levels A and B; for 10 of these patients, sufficient data day of scanning. The female subject on a ‘pill break’ reported day
Table 1 TBI patient demographics and summary temperature data
Females (A) Females (D) Males (A) Males (D)
Age (years) 55.0 (14.8) n = 21 54.3 (14.7) n = 20 45.8 (17.3) n = 93 46.2 (17.1) n = 85
TBr Mean (°C) 38.2 (0.74) n = 20 38.1 (0.75) n = 19 38.6 (0.85) n = 85 38.6 (0.80) n = 79
TBo Mean (°C) 37.2 (0.51) n = 17 37.2 (0.52) n = 16 37.5 (0.51) n = 77 37.5 (0.49) n = 73
TBr Range (°C) 3.38 (1.68) n = 20 3.46 (1.68) n = 19 3.21 (1.08) n = 84 3.25 (1.09) n = 78
TBo Range (°C) 2.65 (1.23) n = 17 2.75 (1.20) n = 16 2.50 (0.87) n = 84 2.52 (0.89) n = 76
TBr Maximum (°C) 39.8 (0.74) n = 20 39.9 (0.73) n = 19 40.3 (1.03) n = 84 40.3 (0.97) n = 78
TBo Maximum (°C) 38.4 (0.63) n = 17 38.5 (0.50) n = 16 38.8 (0.70) n = 84 38.8 (0.69) n = 76
TBr Minimum (°C) 36.4 (1.27) n = 20 36.4 (1.30) n = 19 37.1 (0.99) n = 84 37.1 (0.98) n = 78
TBo Minimum (°C) 35.7 (0.99) n = 17 35.7 (1.02) n = 16 36.3 (0.76) n = 84 36.3 (0.71) n = 76
PLR 1.86 (0.36) n = 21 1.85 (0.37) n = 20 1.79 (0.55) n = 87 1.79 (0.56) n = 84
GCS 7.90 (3.42) n = 21 7.90 (3.51) n = 20 8.09 (3.58) n = 88 8.07 (3.64) n = 85
GCSM 4.10 (1.61) n = 21 4.05 (1.64) n = 20 3.73 (1.85) n = 88 3.68 (1.87) n = 85
Data presented as mean (SD). GCS = Glasgow Coma Scale score; GCSM = Glasgow Coma Scale motor response score; PLR = presence of a pupillary light reflex in one or both eyes.
Individual patient temperature values and ranges were calculated from all available data present within the data analysis window that met inclusion/exclusion criteria level A
(Box 1). Aggregate results for males and females are presented for n = 114 patients meeting criteria level A (A) and again for n = 105 patients meeting criteria level D (D).Brain temperature rhythms and mortality BRAIN 2022: 145; 2031–2048 | 2037
Downloaded from https://academic.oup.com/brain/article/145/6/2031/6604351 by guest on 04 August 2022
Figure 1 Disrupted temperature rhythms in brain-injured patients. (A) Violin plot of patient TBr and TBo according to sex. Mean TBr significantly greater
than mean TBo, mixed effects analysis with Tukey’s for multiple comparisons (****P < 0.0001, females, n = 20 for TBr and n = 17 for TBo; males, n = 85 for TBr
and n = 77 for TBo). See also Supplementary Fig. 2. (B) Representative raw data from a 62-year-old female patient (left) showing daily variation in TBr and
TBo, with TBr consistently higher than TBo and both parameters in same phase. TBr sampled once per minute; peak at 05:28 and nadir at 16:12 highlight-
ing inversion of phase relationship with external day-night cycle under intensive care conditions (external time in 24-h clock format). Representative
raw data from a 42-year-old male patient (right) showing lack of a daily rhythm in both TBr and TBo. See also Supplementary Fig. 3. (C) Rose plots (left)
showing timings of temperature maxima and minima in TBI patients (24-h clock format). For all variables, the null hypothesis of a uniform distribution
could not be rejected (Rayleigh test of uniformity; TBrMax, n = 104, P = 0.20; TBrMin, n = 104, P = 0.16; TBoMax, n = 101, P = 0.99; TBoMin, n = 101, P = 0.86).
Contrast with healthy subject rectal temperature data from publicly-available database (right).47 (D) Linear regression of patient temperature ranges
with age; reduction in temperature range significant for brain (slope of −0.016 significantly different from zero; 95% CI −0.029 to 0.003). Shaded areas
represent 95% CIs for lines of best fit. Max = maximum; Min = minimum; NS = not significant. See also Supplementary Fig. 4.
one of menstruation at their afternoon scan; their TBr data from a total of 9434 (0.25%) were excluded because they did not
were included in the luteal group. Of the females with natural cy- meet quality control criteria for MRS spectral fitting
cles, six were confirmed luteal (urine test), two were in menstru- (Supplementary material, Supplementary Fig. 8 and Supplementary
ation and three were in non-menstrual follicular phase at Table 3). The data-points that failed quality control derived from 15
scanning. Five females thus formed a non-luteal group. One female of the 40 subjects scanned. Together, these data confirmed that our
wore a combined contraceptive patch on the scanning day (transi- cohort was representative of healthy adult males and females with
ently removed during each scan); their TBr data were included in the respect to basic physiological parameters, chronotype distribution
luteal group. and sleep patterns. Furthermore, we had developed a novel
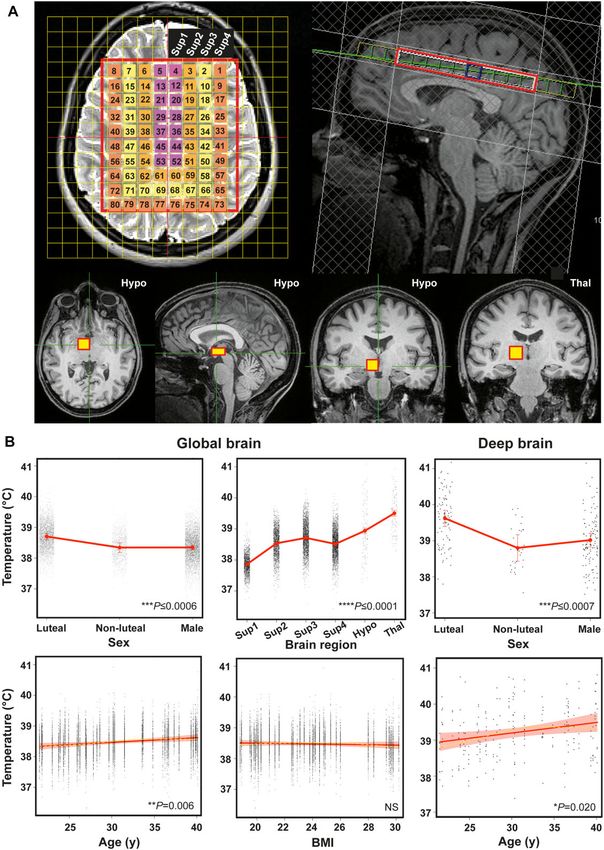
All subjects exhibited daily variation in wrist skin temperature, chronotype-controlled imaging protocol that reproducibly obtains
which was anti-phasic with their rhythm in activity and light expos- time-resolved TBr data at high spatial resolution.
ure, in the week preceding their scans (Fig. 2B and C and
Supplementary Figs 5 and 6). BMI was marginally higher in males
Human brain temperature varies by age, sex and
(P = 0.014; Table 2). Oral temperature was 0.29°C higher in luteal fe-
brain region
males relative to males [95% confidence interval (CI) 0.03 to 0.58, P =
0.029] and 0.04°C higher for a unit increase in BMI (0.005 to 0.083, Reflective of the patient data, healthy global TBr (including all voxels
P = 0.024; Fig. 2D). There were no differences in oral temperature by measured) was higher than oral temperature (38.5 ± 0.4°C versus
age or time of day however, despite daily changes in environmental 36.0 ± 0.5°C); it was also 0.36°C higher in luteal females relative to
temperature (Fig. 2D and Supplementary Fig. 7). Brain locations for follicular females and males (95% CI 0.17 to 0.55, P = 0.0006 and
MRS data sampling are shown in Fig. 3A. MRS data from one female 0.23 to 0.49, P < 0.0001, respectively). This sex difference appeared
were excluded due to a health-related finding; 24 TBr data-points to be driven by menstrual cycle phase (Supplementary Fig. 9).2038 | BRAIN 2022: 145; 2031–2048 N. M. Rzechorzek et al.
Downloaded from https://academic.oup.com/brain/article/145/6/2031/6604351 by guest on 04 August 2022
Figure 2 Chronotype-controlled temperature variations in healthy adults. (A) Prospective study profile and workflow (see the ‘Materials and methods’
section). (B) Representative actogram displaying typical actigraphy over 1 week from one male volunteer. Horizontal panels represent consecutive
days. Note absence of light exposure and activity, with increase in skin temperature during sleep time (activity also absent when device was ‘off-wrist’).
Social jet lag refers to large delay in sleeping schedule due to social activities on two consecutive days, highlighted (red box). See also Supplementary
Fig. 5. (C) Group-averaged mean ± SEM data for distal skin (wrist) temperature, total light exposure and activity by sex during actigraphy week (left).
Females n = 20, males n = 20. Associated rose plots with circular means (acrophases ± SD) displayed (right). For each data type, radial uniformity was
rejected for both groups (Rayleigh uniformity test P < 0.0001) and there were no significant differences in circular mean between them (Watson’s two-
sample test for homogeneity, P > 0.1). See also Supplementary Fig. 6. (D) Linear mixed modelling results for oral temperature. Solid blue lines represent
model fits, shaded areas and double-ended error bars represent 95% CIs, dark grey circles display residuals (single temperature data-points) and
smoothed dashed yellow lines represent partial residuals. The x-axis for time summarizes the continuous variable of time distance since the partici-
pant’s MSFsc (proportion of a linearized unit circle, where 0 = MSFsc and 1 = 24 h). Note time-dependent trend but lack of significant diurnal variation in
oral temperature, likely reflecting inherent practical challenges of obtaining accurate oral temperature readings in human subjects.48 See also
Supplementary Fig. 7.
Despite age-selective recruitment, we captured an age-dependent 2.41 ± 0.46°C. In the cerebrum, white matter-predominating areas
increase in TBr, most notably in deep brain regions (thalamus and were relatively warm. The lowest temperatures were observed
hypothalamus; 0.6°C over 20 years; 0.11 to 1.07; P = 0.0002). Sex, in cortical grey matter regions lying close to the brain surface
age and spatial effects on TBr are summarized in Fig. 3B and and adjacent to a major venous drainage channel (region
Supplementary Fig. 10A. The TBr range overall was 36.1 to 40.9°C, Sup1, surrounding the superior sagittal sinus). The highest tem-
whilst the mean maximal spatial TBr range (difference between hot- peratures were observed in the thalamus (1.64°C higher than
test and coolest voxel in an individual at any given time point) was cortical grey matter, 1.57–1.72, P < 0.0001; 0.56°C higher thanBrain temperature rhythms and mortality BRAIN 2022: 145; 2031–2048 | 2039
Table 2 Healthy participant demographics and sleep characteristics
Females (n = 20) Males (n = 20)
Age (years) 29.76 (5.48) 31.81 (6.16)
BMI 22.33 (2.80) 24.97 (3.65)a
No. days actigraphy data
Free 1.6 (1.23) 1.65 (1.50)
Scheduled 6.0 (1.26) 5.95 (1.73)
Total 7.6 (0.60) 7.6 (0.94)
Sleep onset 23:33 (00:55) 23:59 (01:07)
Onset latency (min) 5.4 (4.26) 4.4 (2.33)
Sleep offset 07:40 (00:50) 07:50 (01:04)
Sleep duration (min) 486.5 (33.47) 474.2 (39.61)
Total sleep time per night (min) 442.4 (34.95) 424.8 (37.00)
WASO (min) 40.05 (17.90) 43.80 (22.07)
Downloaded from https://academic.oup.com/brain/article/145/6/2031/6604351 by guest on 04 August 2022
Sleep efficiency (%) 89.93 (3.86) 89.04 (4.99)
MSFsc 03:56 (01:01) 03:58 (01:26)
MSWsc 03:33 (00:50) 03:53 (01:01)
PCSM 03:15 (00:34) 03:31 (01:17)
SJLsc (min) 52.27 (49.28) 38.82 (34.06)
Acrophase 15:09 (01:24) 15:22 (01:22)
Circadian function index 0.65 (0.07) 0.67 (0.08)
Oral temperature (°C)
Morning 36.18 (0.51) 36.02 (0.40)
Afternoon 36.11 (0.60) 36.03 (0.48)
Evening 36.09 (0.57) 35.84 (0.43)
MRI room temperature (°C)
Morning 21.02 (0.67) 21.36 (0.76)
Afternoon 21.98 (0.63) 21.94 (0.71)
Evening 21.30 (0.64) 21.38 (0.53)
Scan start time (clock time)b
Morning 09:01 (00:02) 09:31 (00:02)
Afternoon 16:02 (00:05) 16:33 (00:11)
Evening 22:59 (00:02) 23:29 (00:02)
Time difference relative to MSFcsc
Morning 05:17 (00.58) 05.46 (01.26)
Afternoon 12.14 (01.12) 12.29 (01.26)
Evening 19.12 (01.12) 19.41 (01.26)
Scan duration (min)
Morning 31.80 (3.82) 31.10 (3.29)
Afternoon 30.50 (6.68) 29.61 (2.97)
Evening 29.55 (2.09) 28.63 (1.64)
Slept during scan
Morning 1 (0) 2 (3)
Afternoon 6 (1) 6 (2)
Evening 5 (0) 5 (1)
Data presented as arithmetic mean (SD) except for sleep onset, sleep offset and acrophase [where circular mean (SD) is presented] and ‘slept during scan’, where numbers of individuals
are presented as definite (possibly). Mean calculated across entire data collection period for each participant prior to calculation of group mean, where applicable. ’Sleep onset’ is defined
as bed time plus latency of sleep onset. ’Sleep offset’ is wake up time. ’Sleep duration’ is the duration between sleep onset and offset. ’Total sleep time’ is the total duration of sleep period
after removing periods of wakefulness. ’Wake after sleep onset (WASO)’ refers to the summed duration of periods of wakefulness occurring after defined sleep onset; a reflection of sleep
fragmentation. ’Sleep efficiency’ is the percentage of time spent asleep while in bed, calculated by dividing the amount of time spent asleep by the total amount of time in bed. A normal
sleep efficiency is considered to be 80% or higher. MSFsc is calculated as the sleep onset on free days plus half of the average weekly sleep duration for all days. ’Sleep-corrected midpoint
of sleep on work days (MSWsc)’ is calculated as the sleep onset on work days plus half of the average weekly sleep duration for all days. ’Previous corrected sleep midpoint (PCSM)’ is the
sleep-corrected midpoint of sleep on the night before scanning. ’Sleep-corrected social jetlag (SJLsc)’ is calculated as MSFsc − MSWsc or the absolute difference between sleep onset on free
and work days when average sleep duration was longer on free than work days; if average sleep duration was longer on work days than free days, SJLsc was calculated as the absolute
difference between sleep offset on free and work days. Note that this parameter was calculated only for participants that reported at least one of each ‘day type’ (free or scheduled)
during data collection. Circadian function index ranged from 0.43–0.73 in an age-matched group of healthy volunteers.49
a
BMI higher in males than females (P = 0.014; unpaired two-tailed t-test with Welch’s correction).
b
Scan time data from the female with a health-related finding have been excluded; there were only n = 18 males at the afternoon session and n = 19 males at the evening session.
c
Time difference relative to MSFsc was converted to a proportion of a unit circle for each participant before incorporation into the linear mixed model in order to correct for chronotype.
hypothalamus, 0.39–0.73, P < 0.0001). Eight female and 12 male Diurnal variation in human brain temperature
participants reported having ‘definitely’ or ‘possibly’ fallen
asleep during one or more scans; this had no measurable impact Absolute TBr is ultimately determined by a balance between the rate
on TBr within the 30-min scan time (Supplementary material). of heat generated by the brain, and its rate of heat loss, mediated
Collectively, these data show that normal human TBr exceeds principally by CBF.50,51 Since blood arrives to the brain from the
oral temperature and varies substantially by age, sex, menstrual body at a lower temperature, this temperature gradient should en-
cycle and brain region. able effective brain heat removal, as long as cerebral perfusion is2040 | BRAIN 2022: 145; 2031–2048 N. M. Rzechorzek et al.
Downloaded from https://academic.oup.com/brain/article/145/6/2031/6604351 by guest on 04 August 2022
Figure 3 Human brain temperature is spatially heterogenous. (A) Representative annotated MR images to show MRS extraction protocol immediately
after whole-brain structural acquisition. T2-weighted axial (top left) and T1-weighted mid-sagittal (top right) image showing multivoxel MRS overlay for
more superficial brain regions including cerebral grey and white matter; note positioning superior to corpus callosum. From this multivoxel acquisi-
tion, MRS data were extracted from each of the numbered voxels individually; for the final statistical model, the whole cerebral region was split into
four superficial groups of voxels (Sup 1–4, depicted as separate colours in the overlay, from medial to lateral). T1-weighted axial, sagittal and coronal
images (bottom three images from left side, respectively) showing orthogonal positioning of single voxel in right hypothalamus (yellow box).
T1-weighted coronal image (bottom right) showing positioning of single MRS voxel in right thalamus (yellow box). See also Supplementary Fig. 8. (B)
Linear mixed modelling results for global TBr by sex, age, brain region and BMI, and for deep TBr (including thalamus and hypothalamus) by sex and
age. Solid red lines represent model fits, shaded areas and double-ended error bars represent 95% CIs, dark grey circles display residuals (single tem-
perature data-points) and smoothed dashed yellow lines represent partial residuals. For sex, P-value reflects comparisons of each group with luteal
females. For brain region, P-value represents comparisons of each region relative to superficial region 1 (parasagittal group of voxels). Sup 1–4 = super-
ficial brain regions 1–4 from medial to lateral; Hypo = hypothalamus; Thal = thalamus. See also Supplementary Fig. 9.Brain temperature rhythms and mortality BRAIN 2022: 145; 2031–2048 | 2041
Downloaded from https://academic.oup.com/brain/article/145/6/2031/6604351 by guest on 04 August 2022
Figure 4 Healthy brain temperature varies by time of day. (A) Snapshot 3D maps of TBr at each data collection point. Inferno colour scale is used to
assign a temperature to each tissue voxel, to 0.1°C resolution. Aggregate temperatures are displayed in each voxel for luteal females (n = 14) and males
(n = 20) separately. (B) Linear mixed modelling results for TBr by time of day; results for global TBr (left) and deep brain TBr (thalamus and hypothalamus,
right) are shown. Solid red lines represent model fits, shaded areas represent 95% CIs, dark grey circles display residuals (single temperature data-
points) and smoothed dashed yellow lines represent partial residuals. The x-axis for time summarizes the continuous variable of time distance since
the participant’s MSFsc (proportion of a linearized unit circle, where 0 = MSFsc and 1 = 24 h). (C) Temperature range (maximum versus minimum across
three tested time points) for oral and hypothalamic sites for each healthy participant (n = 39). Temperature varied more by time of day in the hypothal-
amus than orally (repeated measures one-way ANOVA with Sidak’s multiple comparisons test ****P < 0.0001; see Supplementary Fig. 10B for other brain
regions). (D) Schematic to model 24-h temperature rhythms of the healthy human brain. Extrapolated TBr rhythms in healthy luteal females (n = 14) and
males (n = 20), without controlling for age, BMI, or chronotype. Extrapolated temperature rhythms were created by duplicating the average tempera-
tures measured at three time points and applying a 24 h sinusoidal fit to these six points. Note higher temperatures in all regions in luteal females rela-
tive to males and marked variation in deep brain temperatures in males. Arrows point to predicted TBr minima around 2–3 am (approaching MSFsc).
Sup1–4 = superficial brain regions 1–4 from medial to lateral; Hypo = hypothalamus; Thal = thalamus.
maintained.52 It follows that TBr must be partially determined by Robust, approximately sinusoidal, daily TBo rhythms are a very
TBo. Since TBo and CBF both show clear diurnal regulation in hu- well-characterized aspect of human physiology and similar tem-
mans, with lower temperature and higher CBF at night,21,22 we rea- perature rhythms have been extensively documented in other diur-
soned that human TBr should drop in the evening. Our linear mixed nal mammals in the brain and body.53,54 Since TBr is expected to
model (Fig. 4A and B) revealed that global TBr varied by 0.57°C (95% depend (at least in part) on TBo, we used the simplest and most ap-
CI 0.40–0.75, P < 0.0001) across time; whereas deep brain locations propriate mathematical model (24 h cosinor fit) to predict diurnal
varied by 0.86°C (0.37–1.26, P = 0.0001) and the hypothalamus dis- human TBr in a continuous fashion. We extrapolated a sinusoidal
played the greatest temporal variation (1.21 ± 0.65°C, range 0.27– time series for TBr in six brain regions of interest (Fig. 4D). The pre-
2.75°C). Diurnal temperature variation was significantly greater in dicted average minimum (anticipated around MSFsc, 3 am) was
deep brain regions than in the cerebrum or the body (oral tempera- 38.4°C in luteal females and 38.0°C in males. Importantly, the diur-
ture; Fig. 4C and Supplementary Fig. 10B and C) and for all brain re- nal range of measured TBr across individuals in healthy cortical
gions, TBr was lowest at night. white matter—the location measured in patients with2042 | BRAIN 2022: 145; 2031–2048 N. M. Rzechorzek et al.
Downloaded from https://academic.oup.com/brain/article/145/6/2031/6604351 by guest on 04 August 2022
Figure 5 A daily brain temperature rhythm predicts survival after brain injury. (A–C) Generalized linear mixed model results for outcome in n = 98 TBI
patients. Probability of death (‘success’ or ‘hit’ = 1) relative to survival (‘failure’ or ‘miss’ = 0) is depicted on the y-axis. Solid purple lines represent model
fits for logit (log of the odds) binomial distribution for a given predictor and dark grey circles display residuals (individual patients). For numerical pre-
dictors (A and B), shaded areas represent 95% CIs and smoothed dashed yellow lines represent partial residuals. For the categorical predictor of pres-
ence/absence of a daily TBr rhythm (C), residuals are jittered in the x-axis direction for visibility and 95% CIs are presented as double-ended error bars.
(D) Odds of death in intensive care transformed from the data in A–C; the results for these three predictors are significant since the 95% CIs (double-
ended error bars) do not include 1. Note also that CIs become numerically asymmetric once transformed from log odds to regular odds. Only factors that
demonstrated a statistically significant relationship with mortality are shown. Note logarithmic scale on the x-axis and large effect size for presence of
a daily rhythm in TBr in (D). See the ‘Materials and methods’ section for further details on the generalized linear mixed model and Supplementary
material for numerical outputs and related code.
moderate-to-severe brain injury—was 37.0–40.3°C. In summary, hot deep brain regions and their greater diurnal variation in males
these data reveal a remarkable sex- and brain region-dependent di- than females. The HEATWAVE videos complement the voxel maps
urnal variation in normal human TBr. in Fig. 4A, which represent a reference resource for interpreting hu-
man TBr at each of the time points tested. Since each data-point in
each map is an average of data from multiple individuals, it incor-
HEATWAVE: a 4D map of human brain temperature
porates the range of ages, BMIs, and chronotypes expected for each
Combining our spatial and temporal observations, we built sex in the demographic tested. Our data collection points also cater
HEATWAVE—a 4D map to model human TBr at hourly resolution for the times (morning and afternoon) when most patients would
(Supplementary Videos 1 and 2). HEATWAVE can be dynamically present for MR-based neuroimaging in the non-acute setting.
explored at (https://www2.mrc-lmb.cam.ac.uk/groups/oneill/ In addition to modelling diurnal human TBr in a continuous
research/heatwave/). These comparisons highlight the relatively fashion, HEATWAVE thus provides the first comprehensiveYou can also read