WTO Trade Cost Index: Evolution, Incidence and Determinants
←
→
Page content transcription
If your browser does not render page correctly, please read the page content below
WTO Trade Cost Index: Evolution,
Incidence and Determinants
Background Note1

March 24, 2021

 1
 Disclaimer: This note reflects research in progress. The data and materials published serve a purely
informative purpose, and have no official or legal status. They are not intended to represent the positions or
opinions of the WTO or its Members, and are without prejudice to Members' rights and obligations under the
WTO. Any representation, aggregation or interpretation of the data and results is meant to facilitate the
understanding of the research. References to geographical or other territories and groupings are based on terms
provided to the WTO Secretariat by WTO Members and Observers, or terms used by relevant international
organizations. The use of such terms, and the colours, boundaries and designations used in maps do not
constitute or imply any judgment, official endorsement or acceptance by the WTO Secretariat concerning the
status of any territory, the delimitation of its frontiers, or sovereignty.
2

:

 CONTENTS

1 Introduction .......................................................................................................................................... 3
2 Global trade costs.................................................................................................................................. 5
3 Sectoral trade costs ............................................................................................................................... 8
4 Economy-level trade costs .................................................................................................................. 10
5 Trade costs by types of individuals and firms ..................................................................................... 12
 5.1 Household income ....................................................................................................................... 12
 5.2 Skills .............................................................................................................................................. 13
 5.3 Gender.......................................................................................................................................... 15
 5.4 Firm size ....................................................................................................................................... 16
6 Determinants of trade costs ............................................................................................................... 17
7 References........................................................................................................................................... 19
8 Annex 1: Methodology ........................................................................................................................ 21
 8.1 Gravity estimation ........................................................................................................................ 21
 8.2 Aggregation .................................................................................................................................. 21
 8.3 Decomposition by types of individuals and firms ........................................................................ 23
 8.4 Determinants of trade costs ........................................................................................................ 23
9 Annex 2: Comparison of our results with previous studies ................................................................ 26
3

1 INTRODUCTION

How much are overall trade costs? How have they evolved over time? How much do trade policy barriers
matter in overall trade costs? Who bears most of the burden of trade costs?
Answering these questions is extremely important. Policy makers need insights on the incidence of trade
policy barriers in overall trade costs to assign adequate priorities in policy debates. Understanding
whether trade costs fall more on women than men, small firms than large firms or skilled than unskilled
workers is essential to make progress on a more inclusive trade policy.
A key function of WTO is to provide transparency and monitor trade policy. WTO collects and shares
information on a variety of trade policy measures. Trends in trade costs are typically evaluated
aggregating up this information. For example, WTO provides statistics on average tariffs by country and
over time as well as a timely account of the number of new non-tariff barriers countries introduced since
the 2008 financial crisis. This approach is very data intensive, it does not give a sense of the degree of
restrictiveness of some of these measures, nor measures how trade policy barriers compare to other
trade costs, nor who bears these costs.
The objective of this research is to contribute to the transparency function of the WTO, by building a
WTO Trade Cost Index. This index allows Members to monitor the evolution of global trade costs,
understand what the main components of trade costs are and who faces the largest trade costs. Our
approach is top down. That is, we start from an indirect estimation of overall trade frictions and we then
break these down into specific trade cost components.
We infer trade costs by comparing international to domestic trade flows. Hence our measure of trade
costs reflects the cost of trading internationally relative to trading domestically. This top down approach
to estimate trade costs is conceptually close to the trade cost index initially proposed by Head and Ries
(2001) and then elaborated in several subsequent studies.2 These top-down measures of trade costs
include all costs that burden foreign sales more than domestic sales: transportation costs, trade policy
barriers, costs to comply with foreign regulations, communication costs, transaction costs or
information costs. A great advantage of using these indirect measures of trade costs is that they allow
to estimate total trade costs without the need to gather an immense amount of information. The
disadvantage of such indirect approach is that the estimates of trade costs may also reflect a broader
set of factors. The home bias (that is, an individual preference for goods produced at home) is a clear
example of what is being captured by this overall measure of trade costs.3 However, to the extent that
this component does not change systematically over time, or across countries or across groups of
consumers or producers, it is also clear that it is not going to affect trends. Moreover, in our analysis of
the determinants of trade costs, we show that measurable demand and supply factors account for only
a minor share of our estimated trade costs variation.

Our results are based on a new methodology introduced in Egger, Larch, Nigai and Yotov (2021) [ELNY].
This methodology builds a unified theory-based framework to estimate trade costs and their incidence
on different economic agents. One novel contribution of this methodology is that it delivers sector-
specific elasticities of trade flows to trade costs for both goods and services. This is a more realistic
feature of our methodology compared to previous top down studies of trade costs that typically use the
same elasticities for each sector. In fact, an agricultural product is likely to be more sensitive to an
increase in trade costs than a customised manufacturing input into a production chain (factors such as,
market conditions of competition, relations-specificity, homogeneous/differentiate product matter).
Because of sector-specific elasticities, we estimate different patterns of trade costs across sectors than

 2
 See for instance Anderson and van Wincoop (2004), Chen and Novy (2011), Novy (2013), Miroudot et
al. (2013), Arvis et al. (2016).
 3
 In general, any demand shifter, such as taste dissimilarity, or supply side determinants such as pricing
strategies that vary across destination markets will be captured in top down measures of trade costs (Gervais,
2019).
4

previous studies. For example, as it has to be expected, we get more significant differences between
services and agriculture trade costs than had trade costs been estimated with a single elasticity.

Note also that in terms of levels, our estimates of trade costs are higher than previous estimates.4 This
is mainly driven by our lower estimates for the elasticities used to infer trade costs from trade flows.
From a methodological perspective, our estimates represent an improvement compared to the past. In
fact, while previous studies borrowed figures of elasticities estimated by yet other studies, our estimates
rely on a unified theory-consistent framework and are estimated on the same sample of countries and
sectors as our trade costs indicators.

Second novel contribution of ELNY's methodology is that it allows the estimation of directional trade
costs. This is also a big step toward a more realistic estimation of trade costs. It is well known that the
cost of shipping a good from A to B may not be the same as shipping it from B to A. Not only tariffs to
import a good may be different, but also transportation costs may vary for the same route in different
directions. If a large boat is empty on its return trip, shipping prices fall in moving goods back from B to
A.

Last but not least, beyond offering more realistic estimates of trade costs, directional trade costs also
allow us to estimate the incidence of trade costs on different groups of consumers and producers. This
is a major achievement of this work. We are the first to estimate trade costs for different income groups,
by gender, firms size and skill groups comparable across a large group of countries.

In this research, we use the estimates of bilateral trade costs for 43 countries and 33 sectors between
2000 and 2018 to illustrate the evolution of global trade costs as well as to understand who faces the
largest trade costs and what are their main components.

Compared to the study by ELNY, we introduce three major innovations: (i) we focus on a more recent
time-period, (ii) we complement the analysis of who bears trade costs with a gender dimension, and (iii)
we decompose overall trade costs into components that are relevant for policy discussions.

To deliver these new dimensions in the analysis of trade costs, we undertook a major effort in terms of
data and methodological approach. ELNY methodology to estimate trade costs requires international
input-output data. First, to obtain the broadest possible country coverage and extend the analysis to
the most recent years, we combine the 2016 edition of the World Input Output Database (WIOD) with
an experimental dataset from the Asian Development Bank. This requires translating the WIOD database
from ISIC rev.4 classification to ISIC rev. 3.1. Second, in order to have disaggregated estimates of trade
costs by gender, skill level and firms size, we also use the WIOD Socio Economic Accounts for data on
sectoral employment and employment by skill groups, ILO data on sectoral employment by gender and
OECD data on the number of firms by size. However, not all these data are yet available for the most
recent years and therefore the estimates of trade costs by household income, skill group, gender and
firm size cover a shorter time-period, mostly up to 2014. Third, in order to decompose overall trade
costs into their determinants, we gather data on determinants of trade costs from various sources and
use the most up to date methodology. We focus on measures of trade costs components that have been
found pertinent in the literature and at the same time have sufficient country and year coverage.

What are our main findings?

 • Global trade costs have declined by 15 per cent between 2000 and 2018.
 • Trade costs for services are higher than trade costs for agricultural goods. Trade costs for
 manufactured goods are the lowest.
 • Overall trade costs are higher for women, SMEs, and unskilled workers.

 4
 See Annex 2 for a detailed comparison.
5

 • High-income groups face higher trade costs, given their larger share of consumption in services
 • Trade policy barriers and regulatory differences are estimated to account for at least 14 per cent
 of trade costs in all sectors. They include tariff and non-tariff barriers, regulatory differences, as
 well as other policies covered by trade agreements, such as a lack of investment facilitation or
 of intellectual property protection.
 o Trade policy barriers are relatively the most important component of trade costs for
 trade among low income countries.
 o Transport and travel costs together with information and transaction costs explain the
 largest share of trade costs between high-income economies.

What's next? This research is work in progress. The first set of results that we outline in this note refers
to partial equilibrium estimations. These are the most comparable to existing studies, as they are a mere
comparison of international to domestic trade costs. In a second note we will present general
equilibrium trade costs. This next set of indexes takes into account that trade between two countries
depends not only on their bilateral trade costs, but also on their trade costs with other countries. For
instance, even if trade costs between country A and B remain unchanged, their bilateral trade may
decline if their trade costs with other countries decline. This second set of trade costs will allow to
capture how trade costs between two countries in a certain sector evolve relative to other countries
and sectors. Future steps of our research will aim at extending the breakdown of trade costs to better
capture the role of uncertainty. We will expand the coverage by country, sector and years as well explore
new gender, firm and household datasets. Finally, we will explore ways in which to produce timely
estimates of trade cost to account for real time update of trade measures.

2 GLOBAL TRADE COSTS

In order to allow a comparison of the levels of trade costs across country groups, broad sectors and over
time we build trade cost indexes. A summary of the methodology to estimate these trade cost indexes
and how we aggregate bilateral estimates of trade costs to global indices is presented in Annex 1:
Methodology.

Our estimates suggest that global trade costs are around 3.5 times higher than domestic trade costs
(Figure 1). They are higher for lower-income economies than for high-income economies.5 Figure 1 also
shows that overall trade costs have declined between 2000 and 2018. Globally, the cumulative decline
was 15 per cent. While high-income economies' trade costs declined throughout the entire period, trade
costs in lower-income economies saw an uptick during the Great Financial Crisis of 2008/2009.
Moreover, low-income countries' trade costs declined faster than those of high-income countries before
2008, but the two series moved in parallel after 2012.

 5
 Lower-income economies are those classified by the World Bank in the year 2000 as low and middle
income; High-income economies are those classified as high income. In our sample, lower-income economies are
represented by Brazil, Bulgaria, China, Croatia, the Czech Republic, Estonia, Hungary, India, Indonesia, Latvia,
Lithuania, Korea, Malta, Mexico, Russia, Turkey, Romania, Poland and Slovakia. High-income economies are
Australia, Canada, Chinese Taipei, Cyprus, EU15 countries, Japan, Norway, Slovenia, Switzerland and the United
States.
6

Figure 1: Global trade costs
Levels in 2018 (left panel) and growth index, 2000=100 (right panel)

 5.0 105

 100
 4.0 3.7
 3.5 3.3 95
 3.0
 90

 2.0 85

 80
 1.0

 0.0
 Global High-income Lower-income
 Global High-income Lower-income

Note: The level of global trade costs can be interpreted as how many times higher are international trade costs compared to
domestic trade costs. Hence, global trade costs in 2018 (3.5) correspond to an ad valorem equivalent of 250 per cent.

Breaking global trade costs down by broad sector, Figure 2 shows that they are the highest in services
and the lowest in manufacturing.6 Between 2000 and 2018 all three broad sectors have registered a
cumulative decline in trade costs of around 15 per cent. Notably, manufacturing, and to a smaller extent
agriculture, registered an increase in trade costs during the Great Financial Crisis of 2008/2009. The
declining trend in trade costs in services continued during the crisis but slowed down afterwards (and
this is despite the increase in trade cost that we estimate in financial intermediation services, as we will
show below).
Figure 2: Global trade costs by broad sector
Levels in 2018 (left panel) and growth index, 2000=100 (right panel)

 5.0 105
 4.2
 100
 4.0
 3.4
 95
 3.0 2.7
 90

 2.0 85

 80
 1.0

 0.0
 Agriculture Manufacturing Services Agriculture Manufacturing Services

Note: The level of global trade cost can be interpreted as how many times higher is international trade cost compared to
domestic trade cost. Hence, trade cost in services in 2018 (4.2) corresponds to an ad valorem equivalent of 320 per cent.
Trade cost in manufacturing in 2018 (2.7) corresponds to an ad valorem equivalent of 170 per cent.

The ranking of trade costs in the three broad sectors is the same for lower-income and high-income
economies (Figure 3). However, all costs are higher for lower-income economies' trade. In 2018, the
estimated trade costs in lower-income economies were 9 per cent higher in manufacturing, 10 per cent
higher in agriculture, and 16 per cent higher in services compared to high-income economies.

The overall estimated decline in trade costs was larger in lower-income economies in agriculture and
manufacturing than in high-income countries. In high-income economies the cumulative decline

 6
 The trade costs index does not capture trade in services through commercial presence (mode 3).
7

between 2000 and 2018 was between 10 and 14 per cent in agriculture and manufacturing, respectively.
In lower-income economies, it was 18 per cent for both broad sectors.

The estimated evolution of trade costs was notably different between the two income groups during
and after the Great Financial Crisis. In high-income economies, trade costs in agriculture and services
continued declining throughout the crisis but their decline slowed down afterwards. Trade costs in
manufacturing, on the other hand, increased during the crisis and started coming down only after 2015.
In lower-income economies, all broad sectors saw an uptick in trade costs during the crisis in 2009, but
they quickly returned to the pre-crisis decline. Nevertheless, the decline flattened after 2012.
Figure 3: Global trade costs by broad sector and income per capita level
High-income (upper panels) and lower-income economies (lower panels), levels in 2018 (left panels) and growth
index, 2000=100 (right panels)

 5.0 High-income High-income, index 2000=100
 3.9 105
 4.0
 3.3 100
 3.0 2.7 95

 90
 2.0
 85
 1.0 80
 2000 2002 2004 2006 2008 2010 2012 2014 2016 2018
 0.0
 Agriculture Manufacturing Services Agriculture Manufacturing Services

 5.0 Lower-income 4.6 Lower-income, index 2000=100
 105
 4.0 3.6
 100
 2.9
 3.0 95

 90
 2.0
 85
 1.0 80
 2000 2002 2004 2006 2008 2010 2012 2014 2016 2018
 0.0
 Agriculture Manufacturing Services Agriculture Manufacturing Services

Breaking down trade costs further according to the direction of trade shows that flows among lower-
income economies face the highest cost, followed by flows between lower-income and high-income
economies (Figure 4). Trade flows among high-income economies face the lowest cost. In 2018, the
smallest difference among these groups was in manufacturing and the largest difference in services.

The decline in trade costs has been the fastest among lower-income economies and the slowest among
high-income economies, leading to convergence in trade costs in both agriculture and manufacturing.
This was the case also in services until the crisis of 2009. After the crisis, the evolution of trade costs in
services became similar among all the income groups.7

 7
 Figure 3 is not directly comparable with Figure 2. This is because the latter includes the aggregate "Rest
of the World" as partner while in Figure 3 this aggregate, that consists of both high-income and lower-income
economies, is not considered.
8

Figure 4: Global trade costs by broad sector and direction of trade
Levels in 2018 (left panels) and growth index, 2000=100 (right panels)

 Agriculture Agriculture, index 2000=100
 6.0 105
 5.0 100
 4.0 4.3
 95
 4.0 3.2 90
 3.0 85
 2.0 80
 1.0 75
 2000 2002 2004 2006 2008 2010 2012 2014 2016 2018
 0.0
 Between high- Among lower- Among high- Between high and lower income economies
 and lower- income income Among lower income economies
 income Among high income economies

 Manufacturing Manufacturing, index 2000=100
 6.0 105
 5.0 100
 95
 4.0 3.3
 3.1 90
 3.0 2.5
 85
 2.0 80
 1.0 75
 2000 2002 2004 2006 2008 2010 2012 2014 2016 2018
 0.0
 Between high- Among lower- Among high- Between high and lower income economies
 and lower- income income Among lower income economies
 income Among high income economies

 Services Services, index 2000=100
 6.0 5.3 5.6 105
 5.0 4.3 100
 95
 4.0
 90
 3.0 85
 2.0 80
 1.0 75
 2000 2002 2004 2006 2008 2010 2012 2014 2016 2018
 0.0
 Between high- Among lower- Among high- Between high and lower income economies
 and lower- income income Among lower income economies
 income Among high income economies

3 SECTORAL TRADE COSTS

Within manufacturing, we estimate the lowest trade cost sectors are Chemicals and Chemical Products,
and Electrical and Optical Equipment (Figure 5). Rubber and Plastics, and Transport Equipment also face
relatively low costs. Other Non-Metallic Mineral Products, and Food, Beverages and Tobacco, on the
other hand, face relatively high trade costs compared to other goods.
9

Figure 5: Global trade costs in manufacturing sectors in 2018

 Other Non-Metallic Mineral Products 3.2
 Food, Beverages and Tobacco 3.1
 Other Manufacturing; Recycling 3.1
 Coke, Refined Petroleum and Nuclear Fuel 2.8
 Pulp, Paper, Printing and Publishing 2.8
 Wood and Products of Wood and Cork 2.8
 Basic Metals and Fabricated Metal 2.8
 Textiles; Leather Products and Footwear 2.7
 Other Machinery 2.6
 Transport Equipment 2.6
 Rubber and Plastics 2.5
 Electrical and Optical Equipment 2.3
 Chemicals and Chemical Products 2.2

In the service sector, Transport and Logistics sectors have the lowest trade costs and are comparable
with some manufacturing sectors (Figure 6). Post and Telecommunications, Wholesale Trade, and Other
Services face higher trade costs, followed by Education, Business and Professional Activities, and
Financial Intermediation. Finally, the highest trade costs are in Real Estate Activities, and Construction.

Figure 6: Global trade costs in service sectors in 2018

 Real Estate Activities 7.2
 Construction 5.9
 Sale, Maintenance and Repair of Motor Vehicles 4.8
 Health and Social Work 4.6
 Retail Trade 4.6
 Hotels and Restaurants 4.5
 Financial Intermediation 4.1
 Business and Professional Activities 3.9
 Education 3.9
 Other Services* 3.8
 Wholesale Trade and Commission Trade 3.7
 Post and Telecommunications 3.6
 Air Transport 3.2
 Logistics and Travel Agencies 3.2
 Inland Transport 3.1
 Maritime Transport 2.8

*Other Services include Community, Environmental, Cultural and Personal services

Among sectors that saw a sustained decline in trade costs over the whole period was Maritime
Transport, Business and Professional Activities, Other Services, and Education (Figure 7). Trade costs in
Wholesale and Retail Trade sectors saw a very rapid decline between 2003 and 2010 but a flat evolution
afterwards, like several other services sectors. Financial Intermediation even saw a notable increase in
trade costs after the Great Financial Crisis. Trade costs in most sectors started declining again after 2016.
10

Figure 7: Evolution of global trade costs by sector, 2000=100

105 105

100 100

 95 95

 90 90

 85 85

 80 80
 2000 2002 2004 2006 2008 2010 2012 2014 2016 2018 2000 2002 2004 2006 2008 2010 2012 2014 2016 2018
 Food, Beverages and Tobacco Other Non-Metallic Mineral Products
 Textiles; Leather Products and Footwear Basic Metals and Fabricated Metal
 Wood and Products of Wood and Cork Other Machinery
 Pulp, Paper, Printing and Publishing Electrical and Optical Equipment
 Chemicals and Chemical Products Transport Equipment
 Rubber and Plastics Other Manufacturing; Recycling

105 105
100 100
 95 95
 90 90
 85 85
 80 80
 75 75
 2000 2002 2004 2006 2008 2010 2012 2014 2016 2018 2000 2002 2004 2006 2008 2010 2012 2014 2016 2018
 Hotels and Restaurants Financial Intermediation
 Inland Transport Real Estate Activities
 Maritime Transport Business and Professional Activities
 Air Transport Education
 Logistics and Travel Agencies Health and Social Work
 Post and Telecommunications Other Services*

105
100
 95
 90
 85
 80
 75
 70
 2000 2002 2004 2006 2008 2010 2012 2014 2016 2018
 Construction
 Sale, Maintenance and Repair of Motor Vehicles
 Wholesale Trade and Commission Trade
 Retail Trade

4 ECONOMY-LEVEL TRADE COSTS

Countries may face different levels of trade costs for their imports and exports. While many obstacles
to trade are symmetric (distance between two countries matters in the same way for their bilateral
exports as it does for their bilateral imports), some, especially policy, barriers may be asymmetric. For
instance, non-reciprocal preferential trade regimes may create asymmetry between import costs and
export costs between LDCs and the granting economies. Moreover, there are policies that affect
predominantly import costs, such as technical barriers to trade, and policies that affect predominantly
11

export costs, such as the access to trade finance. These factors may thus create asymmetry between a
country’s costs to import and its costs to export.

Figure 8 plots for each economy the export cost on the vertical axis and the import cost on the horizontal
axis. The dashed line goes through points where import and export costs are the same. The figure shows
that there is a strong correlation between export and import costs, suggesting that most barriers to
trade are in fact symmetric. For some economies like Turkey, Romania, or Sweden, import costs are
higher than export costs. For others, like Russia, India or Chinese Taipei the opposite is the case. Large
EU countries, such as the Netherlands, France, Belgium and Germany are among those with the lowest
trade costs as both importers and exporters.
Figure 8: Comparison of import and export costs

 5.5

 5.0 RUS

 4.5 IND
 LVA MLT
 NOR
 TPKM BRA
 Export Cost

 4.0 IDN CYP
 JPN FIN HRV
 EST
 CHN CZE PRT AUS
 LTU TUR
 3.5 CHE BGR
 SVK
 KOR
 ITA HUN SVN
 GRC
 POL CAN
 DNK ROU
 ESP MEX
 3.0 AUT
 DEU LUX SWE
 IRL USA
 BEL GBR
 2.5 FRA NLD

 2.0
 2.0 2.5 3.0 3.5 4.0 4.5 5.0 5.5
 Import Cost

We have already shown above that, on average, lower-income countries exhibit higher trade costs than
high-income countries. Figure 9 further corroborates that both import and export costs are correlated
with income per capita; richer countries tend to have lower trade costs.
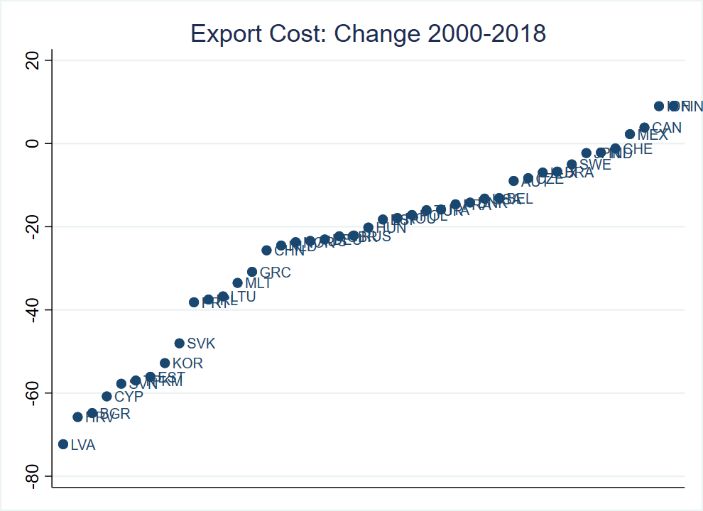
12

Figure 9: Trade costs are negatively correlated with income per capita

 Import costs Export costs
 5.0 5.5
 5.0
 4.5
 4.0
 4.0
 3.5
 3.0 3.0
 2.5
 2.0 2.0
 0 20000 40000 60000 80000 100000 120000 0 20000 40000 60000 80000 100000 120000
 GDP per capita, US$ GDP per capita, US$

Consistent with the evolution over time of global aggregate trade costs, we also estimate that both
export and import costs declined between 2000 and 2018 for most countries. On the exporter side, the
most pronounced fall happened in some of the new EU Member States (Latvia, Croatia, Bulgaria, Cyprus
and Slovenia). On the importer side, Lithuania, Slovakia, Luxembourg, Bulgaria and Belgium saw the
largest declines.

A few countries registered an increase in trade costs between 2000 and 2018. On the exporter side it
was Finland, Indonesia, Canada and Mexico. On the importer side it was Croatia, Korea, India and Malta.
Figure 10: Changes in import and export costs between 2000 and 2018

5 TRADE COSTS BY TYPES OF INDIVIDUALS AND FIRMS

In order to estimate trade costs by income group, firm size, skill and gender, we combine economy-
sector estimates of trade costs with data on economy-sector differences in consumption between
different income groups and differences in labour and firm-size composition. This helps us gauge
whether some groups of consumers and workers bear a larger burden of trade costs.
5.1 Household income

Figure 11 plots average import costs faced by households at different levels of income, showing (i) that
the cost to import increases with household income and (ii) that the disparity has narrowed over time.
These results can be explained by that higher-income households spend a larger share of their budget
on services which in turn face higher trade costs than goods. We estimate a negative difference between
average import costs faced by lowest-income and highest-income households for all economies in our
sample (Figure 12).
13

Figure 11: Global import costs by household income

 5

 4.5

 4

 3.5
 2000
 2001
 2002
 2003
 2004
 2005
 2006
 2007
 2008
 2009
 2010
 2011
 2012
 2013
 2014
 1st quintile 2nd quintile 3rd quintile
 4th quinitle 5th quintile

Note: The 1st quintile represents the 20 per cent lowest income group, the 5th quintile represents the group of households
with an income above the 80% of all households.

Figure 12: Difference between import costs faced by the lowest-income and the highest-income
households

 0

 -0.05

 -0.1

 -0.15

 -0.2

 -0.25

 -0.3

 -0.35

 -0.4

Note: A negative difference implies that import costs for lowest-income households are lower than for highest-income
households. The former is defined as being in the lowest quintile of the household income distribution, the latter is defined
as being in the highest quintile.

5.2 Skills

Depending on the sectors where they are predominantly employed, workers with different skill-levels
face different costs to export. Figure 13 shows that on average low-skill workers face lower export costs
than mid- and high-skill workers.8 This is because in many economies low-skill workers are
predominantly employed in goods-producing sectors which exhibit lower trade costs than service
sectors. However, the right panel of Figure 13 also shows that both within goods and within services,
low-skill workers are employed in activities that face higher trade costs than activities were mid-skill
and high-skill workers are predominantly employed.

 8
 Skill levels in our data are defined by educational attainment. Low-skill workers have primary education,
mid-skill workers have secondary education and high-skill workers have tertiary education.
14

Figure 13: Global export costs by workers' skill level

 6 6
 5.5 5.5
 5 5
 4.5 4.5
 4 4
 3.5 3.5
 3 3
 2.5 2.5
 2003

 2011

 2000
 2000
 2001
 2002

 2004
 2005
 2006
 2007
 2008
 2009
 2010

 2012
 2013
 2014

 2001
 2002
 2003
 2004
 2005
 2006
 2007
 2008
 2009
 2010
 2011
 2012
 2013
 2014
 High-skill - goods Mid-skill - goods
 High-skill Mid-skill Low-skill Low-skill - goods High-skill - services
 Mid-skill - services Low-skill - services

Figure 14 shows that the average gap between export costs faced by low-skilled and high-skilled workers
in fact varies across economies. Low-skill workers in high-income economies are predominantely
employed in services sectors. On the other hand, low-skill workers in lower-income economies are
concentrated in agriculture and manufacturing sectors. Combined with the fact that service sectors
exhibit relatively larger costs, this employment pattern results in a positive correlation between the
relative export costs faced by low-skill workers and per capita income level. In high-income economies,
low-skill workers tend to face larger export costs than high-skill workers while in lower-income
economies the opposite holds (see Figure 15).
Figure 14: Difference between export costs faced by low-/medium-skill and high-skill workers in total
economy

 1

 0.5

 0

 -0.5

 -1

 -1.5

 -2

 Low-skilled workers Medium-skilled workers

Note: A positive difference implies that export costs for low-/medium-skilled workers are higher than for high-skilled
workers.
15

Figure 15: Percentage difference between export costs faced by low-skill workers and high-skill
workers correlates positively with economy's income per capita

 15%

 10%

 5%

 0%
 0 20000 40000 60000
 -5%

 -10%

 -15%

 -20%

 -25%
 GDP per capita, US$

5.3 Gender

As with high-skill and low-skill workers, export costs differ between male and female workers because
they concentrate in different sectors. Manufacturing is the largest employer for men, accounting for
more than 20 per cent of male employment. It is followed by construction, and transport and logistics
services that each account for around 14 per cent. For women, manufacturing, distribution services,
health and social work and education each account for 12 to 17 per cent of their employment globally.9

Figure 16 shows that this employment structure results in higher export costs for women than for men.
While the average disparity was narrowing until 2012, it started to grow again afterwards. This pattern
is driven by trends in trade costs in the services sectors where women work. As shown in the right panel
of Figure 16, services where women were predominantly employed faced in fact lower export costs, and
a faster export costs decline, than services which accounted for most men's employment. However,
after 2014 this trend was reversed, and the average export costs faced by women increased to the levels
of costs faced by men.
Figure 16: Global export costs by workers' gender

 5.5 6

 5.5
 5
 5
 4.5
 4.5
 4
 4

 3.5 3.5
 2000 2002 2004 2006 2008 2010 2012 2014 2016 2000 2002 2004 2006 2008 2010 2012 2014 2016

 Men Women Men - services Women - services

Note: Based on a sample of 31 countries for which available data covers at least 75 per cent of total employment in each year.

 9
 Calculations based on ILO statistics on employment by sex and economic activity for 2017.
16

When it comes to the employment structure in manufacturing, we have information only for a cross-
section of a few economies. Figure 17 shows the average percentage difference between export costs
faced by women and men by broad sector in those economies. While female workers are estimated to
face higher export costs than men in services, there is on average almost no difference between men
and women within the manufacturing sector.
Figure 17: Export costs faced by women and men, by broad sector

 7
 6
 5
 4
 3
 2
 1
 0
 Goods Services

 Men Women

Note: A positive difference implies that women face larger export costs than men. The estimates are an average for six
economies where data on gender employment by 2-digit ISIC sector are available.

Figure 18 shows that the average difference between export costs faced by women and men also varies
across economies. In more than half of our sample it is positive, while in other economies it is in fact
negative.
Figure 18: Difference between export costs faced by women and men

 2

 1.5

 1

 0.5

 0

 -0.5

 -1

 -1.5

Note: A positive difference implies that export costs faced by women are higher than by men.

5.4 Firm size

Looking at export costs by firm size, MSMEs tend to face higher average cost to export than large
enterprises. In the total economy, MSMEs face on average 18 per cent higher export costs. In goods
sectors the difference is just 5 per cent. The difference in export costs for different categories of firms
is driven by the types of sectors where MSMEs are concentrated.
17

Figure 20 shows that this pattern holds in most economies but there are a few where large firms face
higher average export costs than MSMEs. The pattern is also very similar when we focus only on firms
in goods-producing sectors.
Figure 19: Global export costs by firm size

 6.5 6.5
 6
 5.5 5.5
 5
 4.5 4.5
 4
 3.5 3.5
 3
 2.5 2.5
 2000

 2012
 2001
 2002
 2003
 2004
 2005
 2006
 2007
 2008
 2009
 2010
 2011
 2012
 2013
 2014

 2000
 2001
 2002
 2003
 2004
 2005
 2006
 2007
 2008
 2009
 2010
 2011

 2013
 2014
 MSMEs - goods Large - goods
 MSMEs Large enterprises
 MSMEs - services Large - services

Figure 20: Difference between export costs faced by MSMEs and large enterprises

 3.5
 3
 2.5
 2
 1.5
 1
 0.5
 0
 -0.5
 -1
 -1.5

 Total economy Goods

Note: A positive difference implies that export costs faced by MSMEs are higher than for large firms.

6 DETERMINANTS OF TRADE COSTS

Many different factors affect the ease of international trade. Some of them are related to policies and
regulations, others are driven by geography, culture or institutions. In what follows, we decompose the
bilateral variation in trade costs in each sector into five main components – transport and travel cost,
information and transaction cost, ICT connectedness, trade policy and regulatory differences, and
governance quality.

Transport and travel costs are captured by geographical distance, being landlocked and the quality of
transport infrastructure. Information and transaction costs are determined by common history, culture
or language; all these factors proxy for path-dependent social and political factors that facilitate
exchange. ICT connectedness is captured by broadband and mobile coverage. It affects trade costs by
facilitating communication and search for foreign partners and products. In that way it plays a similar
role to common language, but unlike language it is policy actionable. Trade policy and regulatory
18

differences are captured by applied tariffs, non-tariff measures, international economic integration
through regional trade agreements and deeper agreements such as the European Union or the
Eurozone. They also include the level and heterogeneity of services trade restrictiveness. Finally,
measures of governance quality capture the impact of formal institutions on transaction costs of doing
business with a foreign partner.

Figure 21 shows the decomposition of trade costs by broad sector. This decomposition focuses on what
drives differences in trade costs across partners and provides insights into the scope for policy to change
trade costs. Our observable determinants do not fully explain the variation in trade costs across partners
and hence the figure also includes a category "Other" which represents this unexplained component.
Future research will aim to identify additional variables that can help us explain this part of trade costs.
Figure 21: Determinants of global trade costs

 100%
 Other
 90% 24%
 28% 29%
 80%
 Governance quality
 70% 10%
 9% 7%
 60% 16% Trade policy and regulatory differences
 14% 18%
 50% 4%
 3%
 6% ICT connectedness
 40% 16%
 20%
 30% 16%
 Information and transaction cost
 20%
 26% 30%
 10% 24% Transport and travel cost

 0%
 Agriculture Manufacturing Services
Note: This decomposition shows to what extent various factors contribute to explaining the variation in bilateral trade costs.
That is, factors that explain why export costs from a country vary across importers and why import costs to a country vary
across exporters. "Other" is the part of trade costs that remains unexplained by observable trade costs determinants. The
underlying regressions are based on data for the year 2016. See the Annex 1 and Rubínová and Sebti (2021) for more details.

Transport and travel costs play the most important role among the determinants of trade costs. Even
though they play a lesser role in the variance of trade costs in services than in goods, they still explain
the largest share (24 to 30 per cent). The reason may be that many services still require face-to-face
communication, and thus business travel, even when a large part is delivered cross-border. Trade policy
and regulatory differences, and information and transaction costs are also important determinants.
They play similar roles for trade in manufactured goods and services (16 to 18 per cent). Trade in
agricultural goods is different in that information and transaction costs are estimated to have a higher
importance than trade policy. Governance quality accounts for a smaller but non-negligible share of the
bilateral variation in trade costs. Finally, ICT connectedness matters the most in services (6 per cent),
followed by manufacturing (4 per cent) and the primary sector (3 per cent). This may point towards the
importance of digital delivery for cross-border services trade.

Figure 22 presents a decomposition by direction of trade: trade between lower-income economies,
trade between high-income economies, and asymmetrical trade between high-income and lower-
income economies. The contributions of various factors differ markedly. Transport and travel costs can
explain the largest share of trade costs variation among high-income economies and between high- and
lower-income economies. For trade among lower-income economies, on the other hand, trade policy
19

and regulatory differences explain the largest share of trade costs. This highlights the high potential for
trade policy to boost trade among developing countries. The same group of determinants also plays an
important role for trade between high- and lower-income economies, even though these costs are
relatively poorly explained by our observable factors. Finally, the effect of ICT connectedness on trade
costs is most substantial when lower-income economies trade amongst themselves.
Figure 22: Determinants of global trade costs by direction of trade

 100%

 90% 18% 17% Other
 27%
 80%
 12% 14% Governance quality
 70%
 11%
 60% 15%
 24% Trade policy and regulatory differences
 50% 6% 20%

 40% 7% ICT connectedness
 19% 5%
 30% 16% 13%
 Information and transaction cost
 20%
 29%
 10% 22% 23%
 Transport and travel cost
 0%
 LL HH HL
Note: LL refers to trade flows between lower-income economies, HH refers to trade between high-income economies, and HL
refers to flows between high-income and lower-income economies. The underlying regressions are based on data for the year
2016. See the Annex 1 and Rubínová and Sebti (2020) for more details.

7 REFERENCES

Anderson, J.E. and van Wincoop, E. (2004). Trade costs. Journal of Economic Literature 42(3): 691-751.

Arvis, J.-F., Duval, Y., Shepherd, B., Utoktham, Ch. and Raj, A. (2016). Trade Costs in the Developing
World: 1996-2010. World Trade Review 15(3): 451–474.

Chen, N. and Novy, D. (2011). Gravity, trade integration, and heterogeneity across industries. Journal
of International Economics 85 (2011): 206–221.

Egger, P. and Larch, M. (2008). Interdependent Preferential Trade Agreement Memberships: An
Empirical Analysis. Journal of International Economics, 76(2):384-399.

Egger, P. and Nigai, S. (2015). Structural gravity with dummies only: Constrained ANOVA-type
estimation of gravity models. Journal of International Economics 97(1): 86-99.

Egger, P., Larch, M., Nigai, S. and Yotov, Y. [ELNY] (2021). Trade Costs in the Global Economy:
Measurement, Aggregation and Decomposition. ERSD Staff Working Paper no. ESRD-2021-2. World
Trade Organization.

Gervais, A. (2019). Indirect measures of trade costs: Limitations and caveats. Economics Letters 176:
96-102.

Ghodsi, M., J. Grübler, O. Reiter and R. Stehrer (2017). The Evolution of Non-Tariff Measures and their
Diverse Effects on Trade. WIIW Research Report, No. 419. The Vienna Institute for International
Economic Studies.
20

Head, K. and Ries, J. (2001). Increasing returns versus national product differentiation as an
explanation for the pattern of US–Canada trade. American Economic Review 91 (4), 858–876.

Huettner, F. and Sunder, M. (2012). Axiomatic Arguments for Decomposing Goodness of Fit According
to Shapley and Owen Values. Electronic Journal of Statistics 6 (2012): 1293-1250.

Miroudot, S., Sauvage, J. and Shepherd, B. (2013). Measuring the cost of international trade in
services. World Trade Review 12(4): 719-735.

Novy, D. (2013). Gravity Redux: Measuring International Trade Costs with Panel Data. Economic Inquiry
51 (1): 101-121.

Rubínová, S. and Sebti, M. (2021). The WTO Trade Cost Index and Its Determinants. ERSD Working
Paper n.ERSD-2021-6. World Trade Organization.
21

8 ANNEX 1: METHODOLOGY

8.1 Gravity estimation

For each sector and year, we estimate a constrained gravity model proposed by ELNY, from which we
obtain the coefficients on directional country-pair dummies ( ̂ ).10 Compared to ELNY we focus on a
more recent time-period; we use international and domestic trade data from the 2016 edition of the
World Input-Output Database (WIOD) for 2000-2014, and from an experimental dataset by the Asian
Development Bank (ADB-MRIO) for 2015-2018.11

The basis for all applications is the estimated trade openness index ( ̂ ) at the exporter-importer-
sector-year level. It reflects all factors that increase sales to foreign partners relative to domestic sales.
From here we do two types of analysis.
8.2 Aggregation

First, we estimate the evolution of global trade costs over time, by country groups, broad sectors and
sectors. We also calculate the incidence of trade costs on different types of economic agents.

For these purposes we aggregate the estimated trade openness index12 to a country-sector-year level
using a theory-consistent weighted average. We generate three measures at the country-sector-year
level:

 1. Export index = ̂ averaged over all importers and weighted by the estimated importer fixed
 effects from the gravity model.
 2. Import index = ̂ averaged over all exporters and weighted by the estimated exporter fixed
 effects from the gravity model.
 ̂ ⋅
 3. Trade index = √ ̂ averaged over all importers and weighted by the geometric average of

 importer's importer and exporter fixed effects.

To obtain trade costs ( ) we transform these indices using a sectoral trade costs elasticity ( ):

 = ( )−1/

The parameter is estimated according to the methodology introduced in ELNY. A higher means a
higher responsiveness of trade to trade frictions. Table 1 shows that for many services sectors takes
on lower values than for goods, implying that trade in services reacts less to changes in trade costs.

The use of sector-specific elasticities also means that the estimated size of trade costs differs from
conventional estimates that typically use one uniform elasticity of substitution for all sectors. Figure 23
presents a comparison of global trade costs computed with our sector-specific elasticities and with a
uniform elasticity (8 is a number often used in the literature). It shows that the value of trade elasticity
is an important determinant of the level of estimated trade costs. On the other hand, the choice of
elasticity does not have an impact on the estimated evolution over time, as shown in the right pane of
Figure 23 (while the decline is more pronounced for the estimates that use sector-specific elasticities,
the pattern is the same for both).

 10
 For simplicity, we omit the subscripts for sector and year in what follows.
 11
 WIOD 2016 data use ISIC revision 4 classification while ADB data are in ISIC revision 3.1 classification.
We use a correspondence table from WIOD (http://www.wiod.org/protected3/data16/SEA/SEA16_Sources.pdf)
to convert WIOD 2016 data to ISIC rev 3.1. with two modifications: E37-39 and J59-60 are allocated to Other
Community, Environmental, Cultural and Personal Services (not to Electricity, gas and water supply and Pulp,
paper, printing and publishing, respectively).
 12
 The estimated trade openness index is trimmed at 1% and 99%.
22

Table 1: Estimated trade costs elasticities

 Sector Elasticity

 Agriculture, Hunting, Forestry and Fishing 4.86
 Mining and Quarrying 5.06
 Food, Beverages and Tobacco 4.93
 Textiles; Leather Products and Footwear 4.79
 Wood and Products of Wood and Cork 4.87
 Pulp, Paper, Printing and Publishing 4.89
 Coke, Refined Petroleum and Nuclear Fuel 4.52
 Chemicals and Chemical Products 5.09
 Rubber and Plastics 4.79
 Other Non‐Metallic Mineral Products 4.49
 Basic Metals and Fabricated Metal 4.68
 Other Machinery 4.61
 Electrical and Optical Equipment 4.85
 Transport Equipment 4.71
 Other Manufacturing; Recycling 4.59
 Construction 3.91
 Sale, Maintenance and Repair of Motor Vehicles and Fuel 4.18
 Wholesale Trade and Commission Trade 4.37
 Retail Trade; Repair of Household Goods 4.10
 Hotels and Restaurants 4.39
 Inland Transport 5.27
 Maritime Transport 4.40
 Air Transport 3.66
 Logistics and Travel Agencies 5.04
 Post and Telecommunications 5.30
 Financial Intermediation 4.84
 Real Estate Activities 4.40
 Business and Professional Activities 4.42
 Education 4.91
 Health and Social Work 4.24
 Other Community, Environmental, Cultural and Personal Services 5.01
Note: These elasticities correspond to the parameter θ in Egger et al. (2021).

We further aggregate the country-sector trade costs measures to global, country-group, country and
sector level. These aggregations use a simple average.
23

Figure 23: Global trade costs computed with a sector-specific elasticity and with a constant
elasticity
Levels in 2018 (left panel) and growth index, 2000=100 (right panel)

 4.5 105
 4
 100
 3.5
 3 95
 2.5
 2 90
 1.5
 85
 1
 0.5 80
 0
 Agriculture Manufacturing Services

 Sector-specific elasticity Elasticity = 8 Agriculture Manufacturing Services

8.3 Decomposition by types of individuals and firms

We follow the ELNY methodology in decomposing export costs by firm size and workers' skills and
import costs by household income. That is, we use information on sectoral allocation of firms, workers
and household expenditure and match this information with our estimates of sectoral trade costs.
Additionally, we decompose the incidence of export costs by workers' gender. The data required for
most of these decompositions are sourced from WIOD Socio-Economic Accounts and are available until
2014. The underlying data for decompositions by gender are available until 2017 (ILO statistics by sex
and economic activity at the ISIC 1-digit level).
8.4 Determinants of trade costs

In the third part of the analysis, we investigate what drives trade costs variation across partners.13 To
this purpose, we regress the log of bilateral trade cost estimates in each sector on their observable
determinants.14 We then use the results to decompose bilateral variation in trade costs in each sector
into five main categories – transport and travel cost, information and transaction cost, ICT
connectedness, trade policy and regulatory differences, and governance quality. Computing the
contribution of each group of variables to R-squared is not straightforward when explanatory variables
are correlated (as is very likely in our case). We employ a method proposed by Huettner and Sunder
(2012) that takes into account possible correlation among explanatory variables by averaging
incremental R-squared over all possible orderings through which one could add variables to a
specification. The resulting values provide an R-squared decomposition with some good intuitive
properties.15

Our main decomposition results are based on OLS regressions with importer and exporter fixed effects
run for each sector on a cross-section of 37 countries in 2016, which is the year with the maximum
available observations for all explanatory variables. The decomposition results are aggregated to the
broad sector level using weighted averages with weights proportional to the variance of sector’s trade
costs.

The use of importer and exporter fixed effects precludes identification of factors that do not vary across
partners. However, we are still able to include several country-specific variables in a form that is likely

 13
 For detailed methodology as well as additional results see Rubínová and Sebti (2021).
 14
 This two-step approach to the identification of partial effects of observable gravity variables on total
trade costs is akin to the method proposed in Egger and Nigai (2015).
 15
 This method has been used in a similar context by Gervais (2019).
24

to drive bilateral trade costs. For instance, even if my internet connection is fast, the quality of our call
over the internet will be poor if your connection is slow. Hence bilateral communication costs will be
determined by the minimum between the importer's and the exporter's internet connection.
Furthermore, previous literature suggests that formal institutions tend to be more important for
partners with very different culture, language or informal institutions. As these differences tend to
increase with distance, this would imply that the impact of formal institutions on trade costs increases
with distance. We find a similar amplifying effect for the role of transport infrastructure.

The estimated equation is

 ln( ) = + ∙ + ∙ +
 ∙ + ∙ +
 ∙ + + + .

Transport and travel costs

To capture the impact of transportation and travel costs on bilateral trade frictions, the set of variables
in includes the log of population-weighted bilateral distance, a binary variable
indicating if the trading partners share a border and a binary variable indicating if either of the trading
partners is landlocked.16 Additionally, it includes the interaction between importer's quality of transport
and trade-related infrastructure and bilateral distance, and the interaction between exporter's quality
of transport and trade-related infrastructure and bilateral distance.

Information and transaction costs

To capture the impact of information and transaction costs, the set of variables in
 includes having common ethnic language, having common
religion, having common legal origin, previously being in a colonial relationship, previously being the
same country and the log of the 1970 stock of migrants from the importing in the exporting country,
and vice versa. These variables proxy for the ease of communication and the similarity of path-
dependent institutions.

ICT connectedness

 consists of the minimum between the exporter's and the importer's broadband
coverage per capita and mobile phone subscriptions per capita. This group of variables could be
considered part of information and transaction costs, but, unlike variables in the previous group, it is
policy actionable and therefore we single it out.

Trade policy and regulatory differences

To capture trade policy barriers and regulatory differences, the set of variables in
 includes being in a free trade agreement, being part of the
European Union and being part of the Eurozone. It also includes applied bilateral tariffs, specific trade
concerns raised at WTO by the exporter on sanitary and phytosanitary (SPS) and technical barriers to
trade (TBT) measures imposed by the importer as well as the OECD's Services Trade Restrictiveness
Index (STRI) of the importer and its heterogeneity between the importer and the exporter.

Several components of trade policy, such as tariffs, SPS, TBT or services trade restrictiveness are sector
specific. However, competitive environment and openness in service sectors such as transport, logistics
and telecommunications may have an important impact on the ease of trading goods. Similarly, tariffs

 16
 Data sources are listed in Table 2.
25

on goods may affect service sectors that are related to goods trade such as retail and wholesale trade,
and transport. Therefore, we allow for cross-sectoral trade policy spillovers. That is, in the goods
regressions we include the simple average of the STRI variables across all service sectors. In the services
regressions we include the average bilateral applied tariff, SPS and TBT.

Governance quality

 includes differences in the control of corruption between the importer and the
exporter, as well as the interaction of its level with distance for both the importer and the exporter.

Finally, it is possible that part of our estimated trade costs reflects determinants of bilateral trade flows
other than trade frictions per se. For instance, countries with similar preferences are more likely to trade
with each other. Differences in factor endowments may also drive bilateral trade in certain sectors. To
address this concern, we include in our estimation a measure of income per capita differences and
differences in human capital (tertiary education). We partial out the variation accounted for by these
determinants and do not include them in the decomposition.17
Table 2: Data sources

 Variables Source
 Population-weighted distance, having common border, being Centre d’études prospectives et
 landlocked, having common ethnic language, having common d’informations internationales
 religion, having common legal origin, previously being in a (CEPII)
 colonial relationship, previously being the same country
 Quality of transport and trade-related infrastructure World Bank, World Development
 Indicators
 Bilateral stock of migrants in 1970 World Bank, Global Bilateral
 Migration Database
 Broadband coverage per capita and mobile phone subscriptions International
 per capita Telecommunications Union
 Having a regional trade agreement, being part of the European Mario Larch’s Regional Trade
 Union and having common currency Agreements Database from Egger
 and Larch (2008), 2018 update
 Services Trade Restrictiveness Index (STRI) and STRI Organization for Economic
 heterogeneity Cooperation and Development
 (OECD)
 Applied bilateral tariffs World Integrated Trade Solution
 (WITS)
 SPS and TBT specific trade concerns World Trade Organization,
 Integrated Trade Intelligence
 Portal (I-TIP) and WIIW,
 https://wiiw.ac.at/wiiw-ntm-
 data-ds-2.html18
 Control of corruption World Bank, Worldwide
 Governance Indicators (WGI)

 17
 It is important to include these variables in the regression. This is because they are likely to be
correlated with some of the other explanatory variables. For instance, the differences in GDP per capita are
correlated with differences in governance quality.
 18
 See Ghodsi et al. (2017) for details on the WIIW database.
You can also read