Welfare Effect of a Price Change: The Case of Lotto 6/49
←
→
Page content transcription
If your browser does not render page correctly, please read the page content below
Welfare Effect of a Price Change:
                     The Case of Lotto 6/49∗
                                 Kam Yu and Xun Xu†
                                      May 24, 2007

                                          Abstract
          On June 2, 2004 Lotto 6/49 increased its ticket price from one dollar to two
      dollar. The price change provides a unique opportunity to study the welfare
      effect on a price change of a product involving risk. Using an explicit utility
      theory on lottery first developed by Erwin Diewert and extended by Kam Yu,
      we estimate the welfare effect and the real price change of the nominal price
      increase. Initial results indicate that the ticket price change, with some minor
      rule changes in the prize structure, have improved the quality of the product.
      Simply put, the higher jackpot prizes provide more excitement for the lottery
      players. Consumer welfare has increased and the real price of playing the game
      has decreased. As a result productivity of the lottery sector has also improved.

      JEL Classification: C43, D81, E01, L83
      Keywords: system of national accounts, direct measurement, volume index,
      quantity index, choice under risk, lotteries, gambling, non-expected utility
      theory.

1     Introduction
Lotto 6/49 has been played weekly across Canada since June 12, 1982. For example,
the average Canadian household spends $154 in 2005 on government-run lotteries
(Statistics Canada, 2005).1 Evidently, the lottery industry is a significant part of the
gross domestic product. In this paper we analyze the innovation of rules of Lotto
   ∗
     Paper presented to the 41st Annual Meeting of the Canadian Economics Association, June 1–3,
2007, Halifax, Nova Scotia.
   †
     Lakehead University, Thunder Bay, Ontario, Canada. E-mail: Kam.Yu@lakeheadu.ca. The
authors wish to thank Lottery Canada for providing the data on Lotto 6/49.
   1
     Marshall (1998) reports that consumers often underreport their spending in gambling by a
factor of three.
6/49 that was executed on June 2, 2004, study the output and the price index of
Lotto 6/49 before and after June 2, 2004, and calculate the price elasticity of demand
for lottery tickets.
Instead of the traditional expected-utility model, we use a new economic ap-
proach to estimate the real output and price of the Lotto 6/49. In economic theory
the expected utility hypothesis is well known and widely applied in solving problems
with uncertainty. However, the traditional expected-utility hypothesis (EUH) and
expected- utility models are not sufficiently flexible to provide an adequate empir-
ical description of economic behavior in a risky environment (Epstein, 1992). In
gambling, according to the EUH a risk-averse, consumer will never buy a lottery
ticket, since the game is unfair. Therefore, the implication of the EUH cannot ac-
commodate the fact that consumers are risk-averse in buying insurance and at the
same time risk-seekking in playing games of chance. To resolve the paradox, Diewert
(1993, 1995) develops a simple 2-state model of gambling using the implicit expected
utility theory. The model has been expanded by Yu (2004) to a N -state model with
unequal probabilities to calculate the real output and price of the lottery sector. In
this paper we update Yu’s model according to the new Lotto 6/49 rules and study
the impact of the rule change.
The structure of the paper is as follows. Section 2 briefly reviews the background
of the game of lottery and compares the rules of the Canadian Lotto 6/49 before
and after June 2, 2004. A comparison with Super 7, another national lottery game,
is also provided. In Section 3 we introduce Diewert’s 2-state model and expand Yu’s
N -outcome model. Section 4 reports the data sources and the estimates of the real
output, the price index and the elasticity of the tickets demand. Finally, Section 5
discusses and concludes our findings.
2 Lottery Background
2.1 History
Lotteries have been successful in many countries for hundreds of years. It existed
at least before Christ. The Roman emperor Augustus Caesar once used lotteries
to fund public works (Ziemba, 1986). Germany had its first city lottery in 1470
and it has had a national lottery game for over 40 years. Italian national lottery
has operated continuously since 1530. United Kingdom first organized its lottery
in 1566 aimed to raise fund to fight the French (Walker, 1998). At present over
100 countries run lotteries. Spain, Ireland, Canada, the UK, USA and several Aus-
tralian have the largest lotteries in the world. Most of these countries have several
lottery games throughout the countries or provinces. These lottery games are often
owned by syndicates, and the revenues are shared by the companies, the retailers
and the government or institution for some good causes such as health care, educa-
2tion, environment and community charity. In Canada, lottery was illegal until 1969.
Canada’s first major national lottery was organized for the Montreal Olympic Games
in 1973. Now, the two lottery games, Lotto 6/49 and Super 7 are played across the
entire country. They are operated by five provincial lottery organizations — British
Columbia Lottery Corporation, Western Canada Lottery Corporation, Ontario Lot-
tery Corporation, Lotto Quebec, and Atlantic lottery Corporation. Each company
also offers smaller lottery games that occur across one or two provinces. Compared
with the national lotteries, these games usually have lower price ticket and smaller
fixed prizes.
2.2 Lotto 6/49 in Canada
The Lotto 6/49 has been played throughout Canada since its inception. Customers
choose 6 numbers out of the 49 numbers. There are several prizes depending on the
total numbers matched. The total amount wagered and take out rate, which is the
rate of the amount that allocate to the government, retailers and the corporations,
determine the prize fund of the draw according to the following formula:
Prize fund = (1 − takeout rate) × total wager.
Except for the smaller prizes, which have fixed rewards, winners will share the prize
reward from the pool fund. The pool fund is determined by deducting the prize fund
by the total amount of fixed prizes. For each draw, if there is no jackpot winner, the
jackpot pool will be passed on to the jackpot pool of the next draw (the “Rollover”).
At the beginning, Lotto 6/49 in Canada was similar to lottery in other countries
with one-dollar ticket price and one draw per week. Then, as most countries did,
Lotto 6/49 changed its draw to twice a week on September 11, 1985, while keeping
everything else unchanged. On June 2, 2004, it increased the ticket price from one
dollar to two dollars, redesigned the take out rate and shares of the pool fund and
added a sixth prize. The organizers claimed that with the changes, customers will
have a chance at bigger jackpots more often and better overall odds of winning.
Table 1 lists the difference between the two rules.
From Table 1 we see that the share of jackpot has been raised from 50% to 80.5%
of the pool fund and the take-out rate has been reduced from 55% to 53%, the
average jackpot will be higher than before. The shares of other prizes, which have
larger chances to win, have been reduced sharply, while the Jackpot, which has an
extremely low chance to win, has been increased. The probability of a rollover is
given by
p = (1 − π)s/v ,
where π is the probability of winning the jackpot per ticket, s is total sales and v
is the price of the tickets. The probability falls with s, since the more tickets sold,
the more likely of a matching ticket having been sold to claim the jackpot, and the
3probability falls with π. On the other hand, the probability of a rollover rises with
the ticket price, since the higher the price is, for the fixed sales, the fewer tickets are
issued. So as the ticket price increases to two dollar, the chances to have rollovers,
double rollovers or multiple rollovers are higher. In terms of odds, it seems that
the overall odd has increased because of the new 6th prize. The odds, however, are
calculated on a per ticket basis, which is now two dollar. If we consider the odds per
dollar, which is 1/64, the overall odd is lower than before.
Also, in the new game there is a rule that if the rollover exceeds $30 million, then
the percentages of the pool fund applying to Jackpot, 2nd prize, 3rd prize, and 4th
prize will be changed to 40%, 16%, 15% and 29%, respectively. Nevertheless, up to
now rollovers have never exceeded $30 million.
3 Output of Lotto 6/49
In economic theory, the classical expected utility model has been applied to many
areas but sometimes the observed behaviour in a risky environment and experimental
results contradict the theory. The expected utility theories represent consumers
with second order risk aversion rather than first order risk aversion, which imply
that the risk premium is proportional to the variance of the gamble but not to the
standard deviation of the gamble (Segal and Spivak, 1990). Here we review the newly
developed theory in uncertain environment and its application in simple gambling
sector.
Based on the the classical theory by von Neumann and Morgenstern (1953), a con-
tingent commodity approach was developed by Arrow (1964). Blackorby, Davidson
and Donaldson (1977) place a separability assumption on the contingent preference
function and by using the representation theorem proposed by Gorman (1968), they
deduce an additively separable functional form as follows:
" N #
X
M (x1 , x2 , . . . , xN ) = φ−1 (1/N )φ(xi ) ,
i=1
where M is called a stochastic preference function that expresses the decision maker’s
attitude toward risk, xi is a certainty utility which can be expressed as
xi = f (y i ), i = 1, . . . , N,
i
y denotes the consumption vector of the decision maker if state i occurs, and f is the
certainty utility function. There are N states of nature and each state has probability
1/N and φ is a continuous, increasing function of one variable. Diewert (1993) derives
an implicit expected-utility theorem based on this contingent commodity approach.
It can be expressed as
XN
pi φu (xi ) − φu (u) = 0,
i=1
4where pi is the probability and u is the overall utility. In this formulation, φ is
function of the certainty utility of state i, xi and the overall utility u. In order to
aggregate across consumers, a homothetic preference structure is assumed. Then the
above implicit utility function can be written as
N
X
pi γ(xi /u) − γ(1) = 0, (1)
i=1
where γ is an increasing and continuous function of one variable.
3.1 A Simple Model
Using (1), Diewert (1995) derives simple models for measuring the real outputs of
some problems in choice under risk. Here we review the simple model in 2-state
game and and in the next section extend it to a 7-state model for Lotto 6/49. A
consumer has a probability p1 to lose the wager w, and a probability p2 = 1 − p1
to win Rw, where R is the payout ratio, which means the ratio of the total wagers
allocate to the prize. The outcomes can be written as
x1 = y − w, x2 = y + Rw, (2)
where y is consumer’s real income. Assuming homothetic preferences, the implicit
utility function φu can be written as:
φu (z) = γ(z/u).
To provide a kink in the difference curve, the following functional form for γ is
employed:
α + (1 − α)z β , z ≥ 1
γ(z) = (3)
1 − α + αz β , zWith observations in w∗ and y, the parameters α and β can be estimated using a
regression model. Then consumers’ utility levels with gambling (u∗ ) and without
gambling (u0 ) can be calculated using (4). The real output of the 2-state game can
be defined as
Q = u ∗ − u0 .
3.2 Model for Lotto 6/49
As mentioned above, Lotto 6/49 had 5 prizes when it was one dollar per ticket and
now it has 6 prizes. We now expand the 2-state model to a multiple-state model.
To allow for the different prices per ticket in the two rules, we derive the re-
sults using the number of tickets instead of the wager. First we formally define the
variables used:
w = wager,
n = number of tickets purchased per draw,
v = price per ticket,
πi = probability of winning the i-th prize for one single ticket, i = 1, . . . , 6
pi = total probability of winning the i-th prize, i = 1, . . . , 6
p7 = probability of not winning any prize,
xi = state contingent consumption, i = 1, . . . , 7
y = real disposable income,
Ri = payout for the i-th prize, (R7 = 0) i = 1, . . . , 7,
where n = w/v and pi = nπi , since buying more tickets will increase the chance to
win. Table 4 lists all the probabilities of winning for a single ticket. The probability
of not winning any prize is one minus the total probability of winning, that is:
6
X 6
X
p7 = 1 − pi = 1 − n πi
i=1 i=1
and xi = y + Ri − vn, i = 1, . . . , 7. In the one-dollar ticket game v = 1 and therefore
w = n. Also, there are 6 outcomes instead of 7. See Yu (2004) for details.
As we mentioned above, if the consumer has a homothetic preference, his/her
contingent preference function can be expressed by (1). Using γ assumed in (3), it
becomes
X 6 x β x β
i 7
pi α + (1 − α) + p7 1 − α + α − 1 = 0,
i=1
u u
6or
6
" β #
X y + Ri − vn
nπi α + (1 − α) +
i=1
u
6
!" β #
X y − vn
1− nπi 1−α+α − 1 = 0.
i=1
u
Solving for u, we get
" P6 P6 #1/β
β β
(1 − α)n i=i πi (y + Ri − vn) + α 1 − n π
i=i i (y − vn)
u(n) = . (5)
α + (1 − 2α)n 6i=i πi
P
The consumer’s problem is to maximize this utility function with respect to n subject
to the constraint 0 ≤ 2n ≤ y. For notational convenience, we define the following
variables as
d = y − vn,
6
X
p= πi ,
i=i
X6
q= πi (y + Ri − vn)β−1 ,
i=i
X6
m= πi (y + Ri − vn)β .
i=i
Notice that although w = vn appears on the right hand side of the above equations,
compared with disposable income y and payout prize Ri , which are much more
higher than w, the effects of w are so trifling that they can be ignored. The first
order condition is
α(1 − α)m − vβq(1 − α)n[α + (1 − 2α)np]−
vαβ(1 − np)[α + (1 − 2α)np]dβ−1 − αpdβ (1 − α) = 0.
Rearranging as a quadratic equation in n, we have
{vβp(1 − 2α)[αpdβ−1 − q(1 − α)]}n2
+ {vαβ[αpdβ−1 − (1 − 2α)pdβ−1 − q(1 − α)]}n
+ α[(1 − α)m − vαβdβ−1 − pdβ (1 − α)] = 0. (6)
7Writing (6) as an2 + bn + c = 0, where
a = vβp(1 − 2α)[αpdβ−1 − q(1 − α)],
b = vαβ[αpdβ−1 − (1 − 2α)pdβ−1 − q(1 − α)],
c = α[(1 − α)m − vαβdβ−1 − pdβ (1 − α)],
the solution for this quadratic equation is the optimal level of wager
√
∗ −b ± b2 − 4ac
n = .
2a
We use this equation to estimate the values of parameters α and β. With the
estimated parameters, we can calculate the output of services provided by Lotto
6/49, which is
Qt = u(nt v t ) − u(0),
where nt is the number of tickets sold and v t is the ticket price in period t. An implicit
price level can be estimated as a sub-index of the CPI by following equation:
P t = wt /Qt .
4 Empirical Analysis
4.1 Data Sources and Statistics
Our data on the winning numbers, payout prize and sales of Lotto 6/49 are from
January 3, 1998 to May 29, 2004 for the one dollar game and from June 2, 2004 to Aug
30, 2006 with the two-dollar game. The data is partly collected from Lottery Canada
web site and partly provided by the company. Monthly data on the CPI and annual
data on the number of households, personal disposable income, and participation
rates in government lotteries are available from Statistics Canada. The sales volume
of each draw is divided by the number of participating households, which gives the
average wager per participating household, wt . The average personal disposable
income per household, adjusted by the CPI, is used as a proxy for yt .
Figure 1 depicts the numbers of tickets sold from January 3, 2001 to August 30,
2006. The numbers of tickets sold fell sharply after the ticket price increased to two
dollars. The average number of tickets sold in the one-dollar game in the sample
period is 15.93 million while in the two-dollar game it is only 9. 29 million. Since
the ticket price is double, overall revenue of Lotto 6/49 still increased. Figure 2
plots the total sales revenue over time. After the price increase, the highest sales
point is 99,474,164 on October 26, 2005, more than twice the highest sales point in
the one dollar period. The interesting point is that the lowest sales volume during
the two dollars period was 1,607,940 on August 27, 2005, less than one sixth of the
8lowest sales point in the one dollar period. However, the jackpot was $8.45 million,
which was five times higher than the total ticket sales of that draw and higher than
the average jackpot during the period of the two dollars. In fact at that draw the
revenue from sales could only cover the payout of the 5th and 6th prizes.
In the two-dollar game, the increased wagers and higher jackpot rate give gam-
blers more attractive prize pay-offs. Moreover, fewer tickets sold means that the
chance to share prizes with others decreases. The lottery dream with the same win-
ning chance but a higher reward and lower possibility of sharing makes gamblers
have a higher expected value for the Lotto 6/49.
Apart from the publicity and attention drawn to the jackpot, how do the pay-
offs of other prizes fare? Table 2 compares the average sales, pool fund, number of
winners and payouts of prizes of the one dollar with those of the two dollars and their
average changes. The biggest jackpot during the sample period of one-dollar ticket
was $15 million, won by a single ticket on September 30, 2000. The biggest jackpot
of the two-dollars sample period was $54 million, won by a single ticket on October
26, 2005. We can see that the percentage increase in take-out (15.2%) is lower than
the percentage increase in sales (19.59%), which reflects the lower take-out rate in
the new rule. The new game gives a much higher average jackpot than old one while
other prizes have decreased in size. This mirrors the higher share rate in the jackpot
and lower share rate in the other prizes in the two-dollar game. Clearly, the only
thing become more charming under new rule is the size of the jackpot.
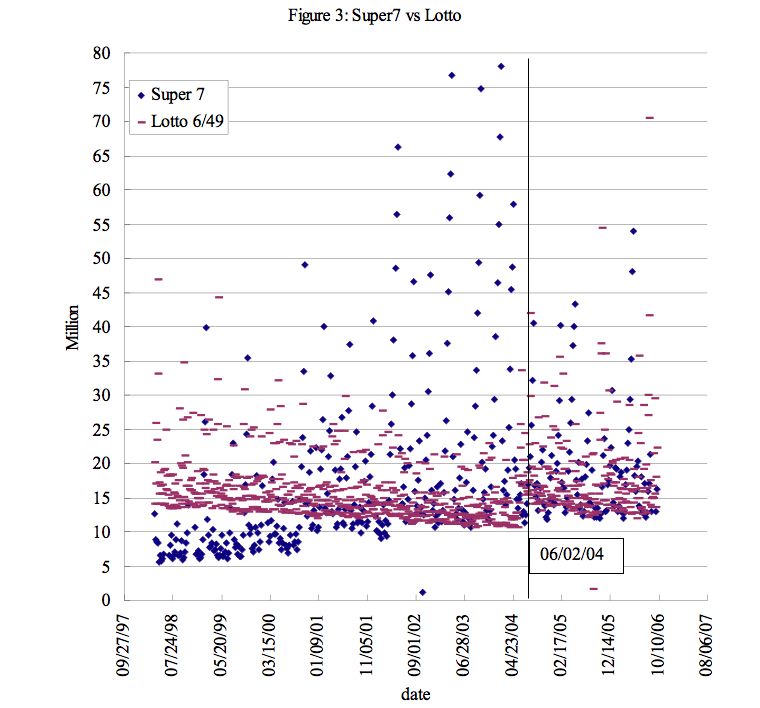
4.2 Lotto 6/49 and Super 7
Lotto 6/ 49 and Super 7 are both national lottery games in Canada. Compared with
Lotto 6/49, which selects six numbers from 1 to 49, Super 7 allow customer to pick
seven numbers from 1 to 47. The chance to win any prize in Super 7 is 1 in 17. The
jackpot’s share of pool fund was 60% before January, 20, 2006 and 73% after, while
the corresponding share in the one-dollar Lotto 6/49 game was 50%. The history of
Super 7 is shorter than Lotto 6/49, but Super 7 developed rapidly and now it enjoys
the same market share as Lotto 6/49. Figure 3 compares the sales of Lotto 6/49 and
Super 7 and Table 3 shows the regression analysis of the total sales against time.
From the figure and the table, we can see that before the rule change, there was a
downward trend on sales of Lotto 6/49. The rate of increase in total sales of Super 7
is higher than that of Lotto 6/49. After the rule change the rate of increase of Lotto
6/49 has risen but still lower than Super 7’s rate. In fact, after the rule change,
Lotto 6/49 and Super 7 have become similar in structure: both have the two-dollar
price, higher jackpot rate and similar chances to win. The figure shows that after the
rule changes, sales in Super 7 and Lotto 6/49 are almost the same. Considering that
both Super 7 and Lotto 6/49 are owned by the same corporation, and the similar
rules make them more like substitute goods, perhaps the corporation can consider
9the probability of combining the two games to make a more attractive game.
4.3 Estimation and Results
By using the maximum likelihood method, we get the estimated values of α and
β. In the one-dollar ticket period, α = 0.1201 with standard error of 0.834 × 10⁻⁵
and t-ratio of 14,408 and β = −31.95 with standard error of −0.269 × 10⁻³ and
t-ratio of −118, 670. In the two-dollar ticket period, α = 0.0319 with standard error
of 0.3801 × 10⁻⁶ and t-ratio of 8389.6 and β = −0.000338 with standard error of
0.4312 × 10⁻³ and t-ratio of −0.78464. Using the estimated value, we can get the
money metric utility and the real output of the Lotto 6/49 for each draw in two
periods.
Figure 4 illustrates the changes of customers expected utility values in the two
periods. Our interpretation is that the new game has increased the expectation
and excitement of the players, resulting in higher utility or output. The average
output in the two-dollar game is $26.1 million, which is six times of the average
output in the one-dollar-game. The average official GDP at factor cost, which is
15.4% of the revenue (7.1% in retailer commissions and bonuses and 8.3% in other
operating expenses) is $2.73 million. It is one ninth of the average output calculated
by the economic approach. Using the official statistics as the total input cost in the
production of the Lotto 6/49 services, we can calculate the games productivity as
shown in Figure 5. The average productivity in the two-dollar game is 10.3 and the
one-dollar game 1.9. It seems that the innovation of Lotto 6/49 is highly successful.
On the producer side the corporations gain more revenue by increasing the price.
On the consumer side players now have a more exciting game. Overall the efficiency
of production has improved dramatically.
Figure 6 is calculated with the price of January 1, 2004 as the basis price. Con-
trast with the real output, the price index decreases tremendously after the new rule
applied and the average price index in the two-dollar game is 0.26, which is less than
one sixth of the average price index in one-dollar game. The price trend in Figure
6 correlates in an opposite way with the changes of productivity in Figure 5. Since
P = w/Q, when wagers do not change too much, the increase in Q causes the real
price to decrease.
We also estimate the elasticity of the demand for the lottery using a simple
formulation:
log Q = η log P + log y + T.
where η is the price elasticity of demand, is the income elasticity, and T is a
trend variable to capture taste change over time. The price elasticities of the Lotto
6/49 in the two periods are −0.72 and −0.21 respectively. The absolute value of η
decreases with the ticket price increase, that is, the demand for Lotto 6/49 become
more inelasticity in the two-dollar game. In one-dollar game the income elasticity of
10Lotto 6/49 is 2.1, which means that lotto tickets are a “luxury” goods, while in the
two-dollar game the income elasticity is 0.76, which means that the lotto tickets are
a normal good.
The above results seems paradoxical. In the one-dallar game, the real price is in
the inelastic range. Therefore a revenue maximizing firm should increase the price,
which is exactly what the lottery corporations do. What is interesting is that they
can only control the ticket price, not the real price. With the ticket price increase,
quantity (number of tickets) sold goes down while revenue increases as predicted. But
together with the rule change and larger jackpots, consumers’ utility in playing the
game increases. This translates into increase real output (welfare) and accordingly
the real price goes down, making the demand even more inelastic.
From the changes in output, price index and elasticity, we can conclude that
the innovation of Lotto 6/49 not only simply changes the rules of the game, it also
change the nature of the product.
5 Conclusion
In this paper, we study the demand for lottery tickets. We applied the non-expected
utility theory to measure the outputs and prices of Lotto 6/49 in the one-dollar
ticket and the two-dollar ticket games. The results show the nature of Lotto 6/49
changes with the ticket price and rule changes. The output of Lotto 6/49 have risen
sharply while the price index fell dramatically. The output is six times higher than
before while the price index is less than one sixth of the price index of the two-dollar
period. Income elasticity decreased from 2.1 to 0.726. The output estimated by
non-expected utility model is nine times higher than the official GDP in the two-
dollar period while in the one-dollar period it is close to three times (Yu, 2004). The
method used here can be used to other games such like Super 7. In fact, after the
innovation the new Lotto 6/49 is more similar to Super 7, the output and price index
of the Super 7 calculated by the N -states model may closer to those we get in two
dollars period. In future studies it would be interesting to estimate and analyse the
cross-price elasticity of Lotto 6/49 and Super 7.
References
Arrow, K.J. (1964) ‘The Role of Securities in the Optimal Allocation of Risk-bearing,’
Review of Economic Studies, 31(2), 91–96.
Blackorby, Charles, Russel Davidson, and David Donaldson (1977) ‘A Homiletic
Exposition of the Expected Utility Hypothesis,’ Economica, 44, 351–358.
11Diewert, W.E. (1993) ‘Symmetric Means and Choice under Uncertainty,’ in W.E.
Diewert and A.O. Nakamura, eds, Essays in Index Number Theory, Vol. 1,
Amsterdam: North-Holland, 335–433.
Diewert, W. Erwin (1995) ‘Functional Form Problems in Modeling Insurance and
Gambling,’ Geneva Papers on Risk and Insurance Theory, 20, 135–150.
Epstein, Larry G. (1992) ‘Behavior under Risk: Recent Developments in Theory
and Applications,’ in Jean-Jacques Laffont, ed, Advances in Economic Theory,
Sixth World Congress, Vol. II, Cambridge: Cambridge University Press, 1–63.
Gorman, W. M. (1968) ‘The Structure of Utility Functions,’ Review of Economic
Studies, 35(4), 367–390.
Marshall, Katherine (1998) ‘The gambling industry: Raising the stakes’, Services
Indicators, Statistics Canada, 4th Quarter, 29–38.
Segal, Uzi and Avia Spivak (1990) ‘First Order versus Second Order Risk Aversion,’
Journal of Economic Theory, 51, 111–125.
Statistics Canada (2005) Survey of Household Spending.
von Neumann, John and Oskar Morgenstern (1953) Theory of Games and Economic
Behavior, Princeton: Princeton University Press.
Walker, Ian (1998) ‘The Economic Analysis of Lotteries,’ Economic Policy, October,
359–401.
Yu, Kam (2004) “Measuring the Output and Prices of the Lottery Sector: An Ap-
plication of Implicit Expected Utility Theory,” Paper presented to the CRIW
Conference on Price Index Concepts and Measurement in Vancouver, Forth-
coming in a NEBR volume, draft copy available at .
Ziemba, William T. (1986) Dr Z’s 6/49 Lotto Guidebook, Vancouver: Dr. Z Invest-
ments Inc.
12Table 1: Rules of Lotto 6/49
Before June 2, 2004 After June 2, 2004
Ticket price $1 $2
Take-out rate 55% 53%
Prize categories 5 6
Overall odds per ticket 1/54 1/32
Share of the pool fund:
Jackpot 50% 80.5%
2nd prize 15% 5.75%
3rd prize 12% 4.75%
4th prize 23% 9%
5th prize $10 $10
6th prize N/A $5
Note: pool fund = (1 − takeout rate) × total wager − total 5th and 6th prizes pay-out
Table 2: Statistics of Lotto 6/49
1 dollar 2 dollar Change
Sales 15,541,318 18,585,285 19.6%
Pool fund 4,272,773 6,543,449 53.1%
Take-out 8,547,724 9,850,201 15.2%
Jackpot 2,136,386 5,267,476 146.6%
Jackpot winners 1.09 0.62 −43.1%
2nd prize 640,916 376,248 −41.3%
2nd winners 6.66 3.56 −46.6%
3rd prize 512,732 310,813 −39.4%
3rd winners 279 162 −41.9%
4th prize 982,737 588,910 −40.1%
4th winners 14,905 8,828 −40.8%
5th + 6th prize 2,720,820 2,191,635 −19.4%
5th + 6th winners 272,082 276,144 1.5%
5th winners 272,082 162,183 −40.4%
13Table 3: Total Sales over Time
Coefficient Standard Error p-value R2
Lotto 6/49 total sales in 2 dollar game
Intercept 3.63 × 10¹⁰ 5.50 × 10⁶ 2.75 × 10⁻¹⁰ 0.9989
Time 1.82 × 10⁷ 39,107 0
Super 7 total sales
Intercept −8.02 × 10⁸ 2.90 × 10⁷ 0 0.9849
7 5
Time 1.96 × 10 1.17 × 10 0
Lotto 6/49 total sales in 1 dollar game
Intercept 2.67 × 10⁸ 1.03 × 10⁷ 0 0.9979
7
Time 1.55 × 10 27,960 0
Table 4: Probability of winning for one ticket
Prize Rule Probability of Winning, πi
Jackpot 6 numbers 0.0000000715
Second 5 numbers + bonus 0.000000429
Third 5 numbers 0.00001802
Fourth 4 numbers 0.0009686
Fifth 3 numbers 0.01765
Sixth 2 numbers + bonus 0.0123
1415
16
17
18
You can also read