WEEKLY RESEARCH REPORT - Pattern to Profit, LLC
←
→
Page content transcription
If your browser does not render page correctly, please read the page content below

Pattern to Profit, LLC
WEEKLY RESEARCH REPORT
Geometric technical analysis of global financial markets
Volume 4, November 25, 2017
(www.patterntoprofit.com)
HIGHLIGHTS
Euro/Dollar heading higher after enthusiastic move off strong support.
DAX Index holding key support. Watch for decisive move above 13,209 for bull signal.
FTSE 100 Index also successfully tests significant support. Looking for signs of strength to take
the index up towards 7,558+
Gold continues to consolidate, but there are some price levels to watch for signs of an upside
breakout. The first target zone would then be $1,347.30 to $1,359.
Euro Dollar
Bull trend expected to continue following reversal off key moving average support.
Next higher targets are in the 1.2025 – 1.2100 price range.
The Euro (EUR/USD) reversed its decline on Tuesday, November 7 (marked L4) with a closing price of
1.1586. This close was sitting right on the average closing prices from the day before all the way back to
the important low of May 11, 2017 at 1.0839 (marked L3).
There are many effective applications of a simple moving average (sma). However, a most overlooked
and strikingly accurate application is to use a specific time value derived from an important high or low,
to immediately calculate the cumulative average price for the period in question as is done on the
following EUR/USD charts.
Downloaded from www.hvst.com by IP address 172.23.0.10 on 11/17/2020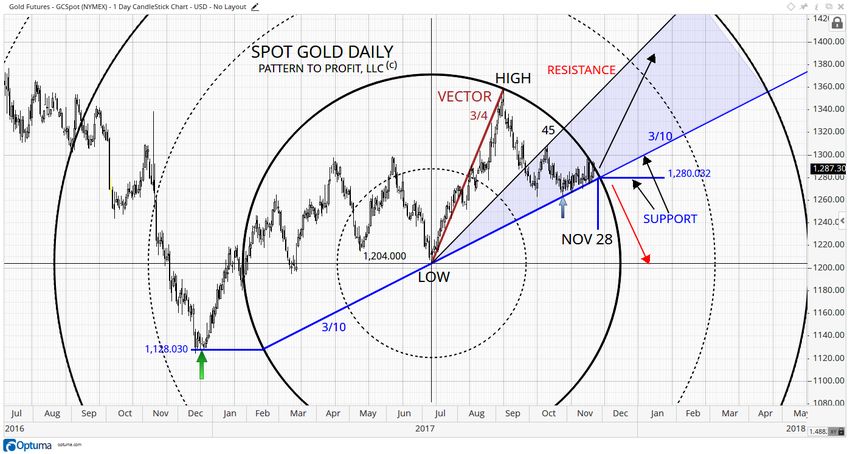
In the first chart, the Euro daily can clearly be seen bouncing right off one such average, a 128-simple
moving average (offset by +1). Its price value for that low on November 7th represented the average
closing prices since L3, exactly 128 trading days prior. The 128sma is still useful for support, as it
represents that entire distance in time (from L3 to L4) moving forward in time.
Why the low at L3? Notice that for uptrends from L1 & L2, the market rose above resistance from the
preceding high (black horizontal), then rather promptly broke back down and closed below (red X’s).
However, the uptrend from L3 stayed above its respective resistance (green check), establishing the
importance of that low.
Although the recent bounce seems impressive, confirmation of a resuming uptrend is offered by the
market breaking above the resistance level of 1.18005. This price level is also derived by using the
November 7 low, but this time combining it with the major high 42 trading days prior, along with a
42sma (red). 1.1805 is the value of that 42sma for November 7. The ‘square point’ is shown with a right
angle (90o) of red lines:

Pattern to Profit, LLC, www.patterntoprofit.com      2                                   November 25, 2017
© 2017 All rights reserved

        Downloaded from www.hvst.com by IP address 172.23.0.10 on 11/17/2020
Notice that the recent low of Tuesday, November 21 found support from the continuing 42sma, with
resistance offered to the three October highs.
These are all bullish indications, with the market expected to reach previous highs in the 1.2025 – 1.2100
range, at a minimum.
DAX Index
DAX Index holding above key support.
Watch for decisive rally above four-day high of 13,209 for next bullish signal.
After that DAX targets 13,700 or higher.
Germany’s benchmark DAX Index is in new high territory, ever since breaking above the previous all-
time high of 12,951.54 on June 20, 2017. It has been testing that price area as support since Wednesday,
November 15, 2017. The entire month of October 2017 saw the index hold above this support zone, most
noticeably without a single daily close below it. This is a most promising observation for the bulls as it
shows underlying strength. There has not yet been a daily close below 12,951.54 since the high was
exceeded.
The next chart offers a geometric perspective on the attempt by the DAX to gain its footing around
support. Here we utilize a vector circle derived from the preceding downtrend set to 45o.
Pattern to Profit, LLC, www.patterntoprofit.com 3 November 25, 2017
© 2017 All rights reserved
Downloaded from www.hvst.com by IP address 172.23.0.10 on 11/17/2020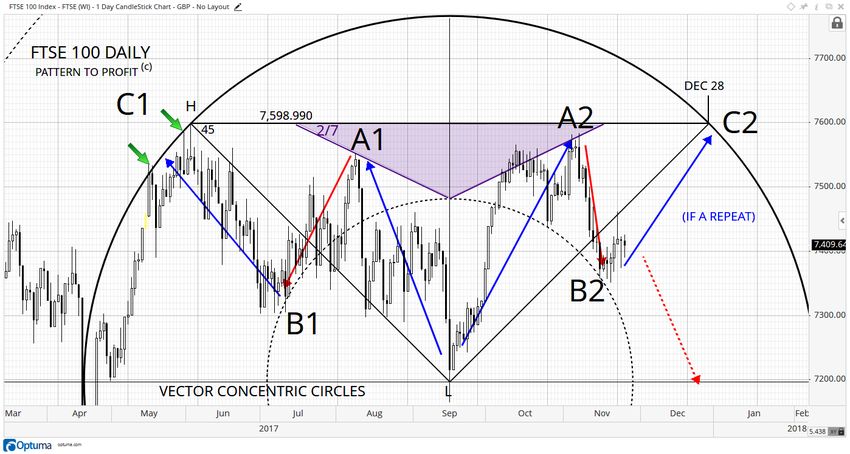
When aligning the price scale of the preceding downtrend to exactly 45o, the resulting circle becomes
support as seen by the recent low of 12,847.88 from Wednesday, November 15. The index bounced
perfectly off the circle (point B) and closed near its high, back safely above major support of 12,951.54
(prior resistance and the beginning of the 45o line).
Most encouraging for the bulls is that the market at all three points, (A, B, & C) demonstrated a refusal to
close below support shown at the horizontal line, thereby adding to its significance and increasing the
likelihood it will hold. At the same time, a decisive drop below it would be short-term bearish.
Clarification for these three points of support (along with the high area between A & B) is provided by
the 9ths fan on the next chart:

Pattern to Profit, LLC, www.patterntoprofit.com      4                                    November 25, 2017
© 2017 All rights reserved

        Downloaded from www.hvst.com by IP address 172.23.0.10 on 11/17/2020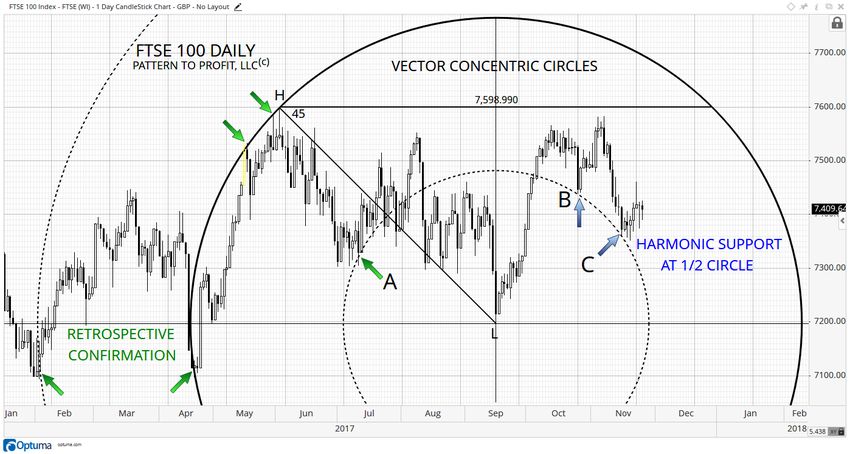
The 9ths fan starting from the vector low divides the 90o right angle of time and price into 9 equal
segments of 10o each. They are labeled as fractions which express their respective division of 90o.
Therefore, the 1/9 angle is 10o, the 2/9 angle is 20o, the 3/9 angle (also 1/3) is 30o, and so on.
All three lows (A, B, & C) are now revealed to be at intersections of fan lines with previously mentioned
support. More importantly, A & C share the commonality of a support level, as opposed to point B which
gets support from the circle. The current market at C is potentially repeating the price activity from A,
indicating the potential for a strong move upward, even if only for a short-term trend to the 5/9 fan line
resistance.
On the downside, in case support of 12,951.54 does not hold, the next support area occurs around the next
lower fan line of 3/9 in the 12,640 – 12,750 range, at least for the next two weeks.
FTSE 100 Index
FTSE tests key support and holds.
Watch for signs of strength indicating FTSE is moving off its support zone to higher prices.
First targets over next two weeks are at triangle resistance around 7,558 to 7,573.
Similar to what we see in the DAX, the FTSE 100 Index is in new high territory: roughly 300 points
above the previous all-time high of 7,122.74 from April 27, 2015. However, it is a little less than 200
points below the more recent all-time high of 7,598.99 from June 2 of this year. While still being closer to
the all-time high, does the market have what is needed to break into new high territory once again?
The following chart presents another vector circle set to 45o akin to the DAX charts, but with noticeably
different price dynamics, as the current market is still inside the circle, and below the vector high price:
Pattern to Profit, LLC, www.patterntoprofit.com 5 November 25, 2017
© 2017 All rights reserved
Downloaded from www.hvst.com by IP address 172.23.0.10 on 11/17/2020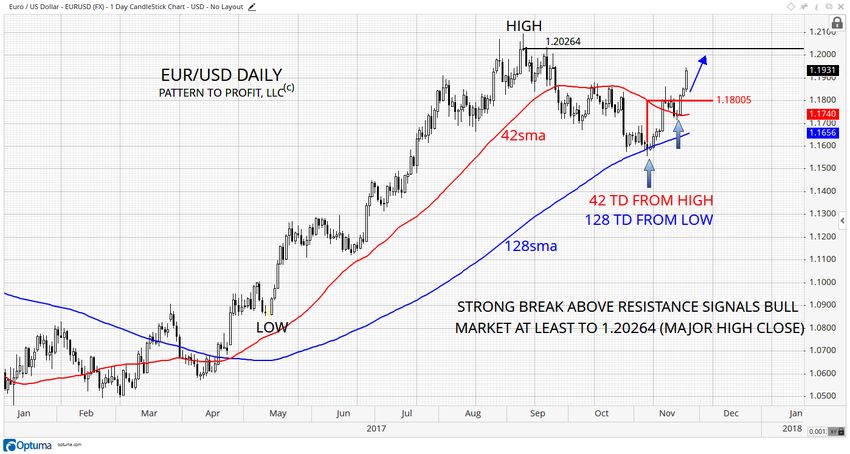
Prior support at points A & B are all on the half-circle (dashed). This is encouraging and shows recent
circle support at C. This geometric alignment helps identify a useful pattern, as demonstrated going
backwards from the central low (2/7 purple triangle added for the tops at A1 & A2):

According to this pattern, a move back up to circular resistance (C2) is expected. Unfortunately, there is
no guarantee of any pattern continuing. In addition, this geometry offers no resistance target other than
the main circle, and a time point of December 28 which is simply the next cycle point of the vector (H-L).
Additional analysis must now be included given the identification of potentially strong support:

Pattern to Profit, LLC, www.patterntoprofit.com      6                                  November 25, 2017
© 2017 All rights reserved

        Downloaded from www.hvst.com by IP address 172.23.0.10 on 11/17/2020
A triangle has been added to the chart composed of harmonically matching fractional angles, successively
cut in half to: 3/4, 3/8, and 3/16.
A 3/8 angle agrees with the recent lows at B, as well as the quick dip of last Thursday, November 23.
Continuing forward in price, it outlines potential support in the 7,380 – 7,416 range for the next two
weeks.
The overall shape conforms to important price points, thereby adding strength to the significance of
support at B and consequently the FTSE has a greater chance of moving up and away from that support
zone. Top triangle resistance for the next two weeks is around 7,558 to 7,573.
Note the intersections of the half-circle (dashed) with the triangle sides at A & B: both price levels
(dashed brown horizontal) are important immediate support and resistance levels of 7,354.43 and
7,458.62, respectively.
GOLD (XAU/USD)
Daily close above $1,295.38 signals a bullish breakout of bottoming consolidation pattern.
Next target would then be around $1,347.30 to $1,359.
Failure of support could see gold fall to $1,213.20.
Gold has been consolidating for almost two months now, including some larger daily ranges starting on
Friday, November 17. This higher volatility has finally produced two consecutive closing prices above the
cumulative average resistance line (thick dark red) noted in the chart below:
Pattern to Profit, LLC, www.patterntoprofit.com 7 November 25, 2017
© 2017 All rights reserved
Downloaded from www.hvst.com by IP address 172.23.0.10 on 11/17/2020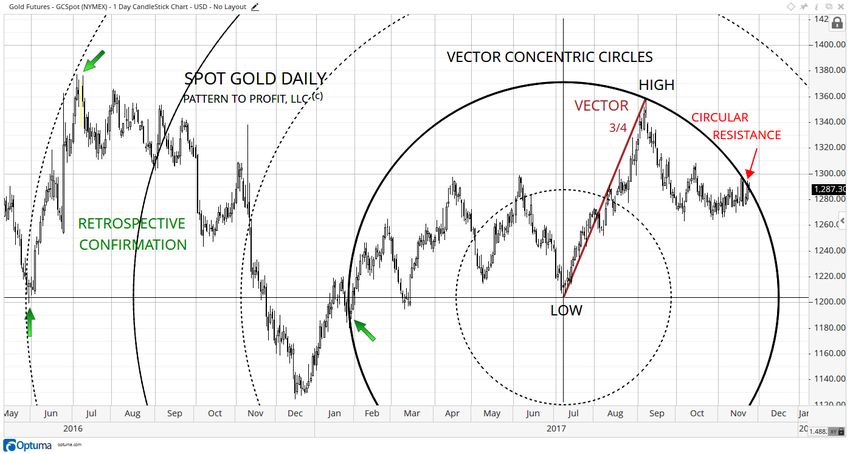
Gold is above both the fixed level of the uptrend average (+43 trading days, blue solid horizontal) of
$1,273.195, and the cumulative trend average (currently at $1,289.82) starting from the high of $1,358.50
on September 8, 2017. (The uptrend average can be verified quickly with a 43sma, offset by +1)
This is a bullish sign, but it must be maintained with continued closes above resistance of $1,289.82. If it
does so then the next main resistance area is from the close of the most recent swing high day of
$1,347.30 from early-September, and up to the peak of that day at $1,359.
On the downside, if the most recent swing low of 1,260.52 is broken gold could fall to around $1,213.20,
the close of the low day from early-July. The swing low from that day is at $1,204.69.
A geometric perspective can help further identify pressure points within the current consolidation zone,
which might indicate a high probability of when a breakout (or breakdown) is coming. A Vector
Concentric Circles tool is applied to the selected vector set at 3/4 (of 90o, or 67.50o), with a startling result
for the current market:

Pattern to Profit, LLC, www.patterntoprofit.com         8                                    November 25, 2017
© 2017 All rights reserved

        Downloaded from www.hvst.com by IP address 172.23.0.10 on 11/17/2020
With three points of retrospective confirmation (green arrows), meaning that it works going backwards
too (as it should), this geometry is stating that the current market highs are circularly related to those
previous points as well as the vector low and high.
The market could very well drop from here, and not break out of circular resistance. Or, it could find
support from a 3/10 angle (below chart), just like the entire consolidation has since October 27, 2017
(small blue arrow):

Pattern to Profit, LLC, www.patterntoprofit.com       9                                   November 25, 2017
© 2017 All rights reserved

        Downloaded from www.hvst.com by IP address 172.23.0.10 on 11/17/2020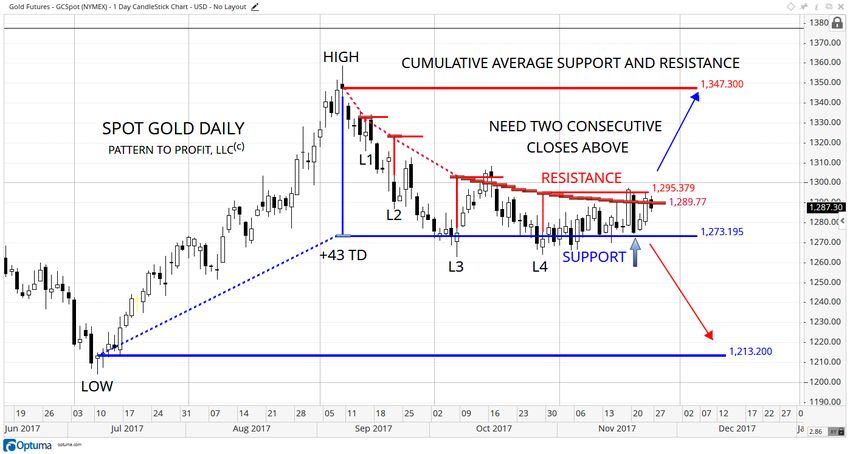
You can see that the 3/8 line along with circle resistance if converging, meaning a breakout of either the
circle or the line will happen within days. The 3/10 support line is validated by activity before the central
low, by identifying the support level of $1,1280.03 (intersecting the circle) for the major low area
between December 15 and 23rd 2016 (green arrow). Its matching level moving forward from the center
(intersecting the main circle) is $1,280.03. Gold must hold above that support if a continuation of the bull
trend is to occur.
If support from the 3/10 angle holds and gold strengthens, then the market is expected to eventually reach
top resistance of the 45o angle (black line), at a minimum.

                                         ---------------------

PATTERN TO PROFIT, LLC
                                General inquiries: info@patterntoprofit.com
Author:
Scott Hathaway, CFTe
Manager and Founding Partner
Pattern to Profit, LLC
scott@patterntoprofit.com
+760-285-7284

Editor:
Bruce Powers, CMT
Founding Partner
Pattern to Profit, LLC
bruce@patterntoprofit.com
+929-446-5470

DISCLAIMER

Pattern to Profit, LLC, any affiliates or employees or third party data provider, shall not have any liability for any
loss sustained by anyone who has relied on the information contained herein. Material is provided for informational
purposes only and does not constitute a recommendation. It has been obtained from sources believed to be reliable,
but accuracy is not guaranteed. The views expressed herein are presented as of the date hereof and are subject to
change based on subsequent developments. The securities mentioned in this report may not be suitable for all types
of investors; their value and the income they produce may fluctuate and/or be adversely affected by news,
fundamental company announcements, interest rates, exchange rates, or many other outside factors. Principals of
Pattern to Profit, LLC may or may not hold, or be short, securities discussed herein, or of any other securities at any
time. Past performance is not necessarily a guide to future performance.

Pattern to Profit, LLC, www.patterntoprofit.com           10                                       November 25, 2017
© 2017 All rights reserved

        Downloaded from www.hvst.com by IP address 172.23.0.10 on 11/17/2020
You can also read