Variation in the manna of Eucalyptus viminalis - Tasmanian ...
←
→
Page content transcription
If your browser does not render page correctly, please read the page content below

Variation in the manna of Eucalyptus viminalis

Department and University: School of Natural Sciences, University of Tasmania
 Supervisory team: Geoff While, Julianne O’Reilly-Wapstra and Peter Harrison

 Amy Wing
 May 2020

 A thesis submitted in partial fulfillment of the requirements of the degree Bachelor of
 Science with Honours
Declaration
I hereby declare that this thesis contains no material which has previously been accepted for
the award of any other degree or diploma and contains no copy or paraphrase of material
previously published or written by any other person, except where due reference is made in
the text of this thesis.

Statement on authority to access

This thesis may be made available for loan and limited copying in accordance with the
Copyright Act 1968.

Signed: Amy Wing
Date: 20/05/2020

 1
Acknowledgements
I would love to thank my three amazing supervisors, Geoff, Julianne and Peter. This project
was a blast, I loved all the knowledge and enthusiasm you all had towards me and my
project. Thank you Geoff for getting me into such an amazing project and team, despite the
fact I am not being a Lizard person. The immense support and advice on my work, no matter
the hour, was such a huge help. Thanks to Peter for all the expertise in all things statistics.
The hours upon hours you dedicated to helping me wrap my head around the data was
absolutely essential for what I achieved. And thank you to Julianne for being such a great
support and encouragement in my writing. Towards the end of this project, when we had to
all work at a distance, all those small words of encouragement helped me keep going. I was
honestly blessed to have all three of you as apart of my honours experience and I hope you
all know how much you are appreciated.
A huge thank you to Sally Bryant and the Tasmanian Land Conservancy for awarding me the
Bird Conservation Fund Scholarship. Thank you for taking on this bright and bubbly
character. Sally, your commitment to the protecting the forty-spotted pardalote and so
many other creatures is inspiring and it was lovely to spend time on Bruny Island with you as
I tried my best to absorb your extensive knowledge.
Thank you to Greening Australia and all the property owners that allowed me to come and
sample on their properties. There was so much enthusiasm and encouragement for my
research, and always a chatty face to almost all properties I rocked up too. Thank you to
Jimmy Collinson from Greening Australia for helping me find my common garden field trials.
As well as a big thank you to Roderic O’Connor and Adrian for allowing me onto their
beautiful property in Connorville, and to Geoff and Anthea Hendley for access to their farm
in Relbia. I would also love to thank all the property owners on Bruny Island and the overall
enthusiasm to my research. Thanks Tonia Cochran of Inala Nature Tours, Lauchlan Story,
Daniel Sprod, Ben Kienhuis and the managers at the Murryfield Station.
Thank you, David Nichols, and your team in the Central Science Laboratory for helping me
with the chemical analysis. It was fun being a lab coat wearing scientist, even if just for a few
days.
Thank you to the School of Natural Sciences for all the cake and tea sessions early on. There
is a great family feel within this group and you all helped me and my group feel so welcome
and comfortable here! Also thanks to David Green, Glen Bain, Paul Tilyard and Thomas
Baker for all the help in my field work and the many silly questions around paper work. Also,
a big shout out to Hugh Fitzgerald, for your extra help in my chemical analysis and
organising of field work, you went above and beyond, so thank you!
Thank you, Tanya Bailey, for your help with my sampling in Midlands, and for giving me a
place to stay. Our therapy discussions amongst the trees and all your time in the field will
always be remembered.

 2
Thank you to all my friends and volunteers who kept me company in the field, some days
with only a few hours’ notice. Sophia, Maryanne, Jake, Richard, Tom, Zoe and Melanie, you
were all such a huge help and made the hours in the sun even better!
A big thanks to my mid-year cohort, Zoë, Zach, Elizabeth, Laura and Fiona. Thanks for
coming along for this crazy adventure. None of us expected the turn of events that
happened due to COVID-19, but we managed to remain as a great group and support each
other throughout, and I hope we remain friends for a long time.
I’d like to thank my friends and family for the extra support throughout this project. Thanks
to my parents for all the encouragement throughout my whole science degree and the huge
amount of support from my partner, Tom, especially in those final few weeks. Finishing my
thesis in isolation was not easy, but I can thank every one of you for picking up the phone or
logging onto Zoom when I just needed a chat or study buddy.
And finally, thanks to the University of Tasmania and particularly the Natural Sciences for
accepting me as a honours student. I know I cannot have possibly remembered all the
people that helped me out this year, as there were just so many people who helped me and
made this experience great. I thank every single one of you as this will be an experience I
remember forever.

 3

Contents
ABSTRACT ................................................................................................................................... 5
Introduction................................................................................................................................ 6
 Eucalyptus woodlands as foundation species ................................................................................. 6
 The importance of sugary resources ............................................................................................... 7
 The important relationship between the Forty-Spotted Pardalote and Eucalyptus viminalis ........ 8
 What do we know about manna? ................................................................................................... 9
 Aims............................................................................................................................................... 10
Methods ................................................................................................................................... 12
 Part one: Common-garden field trials........................................................................................... 12
 Part two: Bruny Island................................................................................................................... 16
 Manna Analysis by Liquid-Chromatography Mass-Spectrometry ................................................ 18
 Tree traits and environmental variables ....................................................................................... 19
 Data Analysis................................................................................................................................. 19
 Common garden field trials........................................................................................................... 20
 Natural populations of E. viminalis at Bruny Island ...................................................................... 21
Results ...................................................................................................................................... 23
Discussion ................................................................................................................................. 34
 Variation in manna across the common garden field trials .............................................................. 35
 Variation in manna across the native distribution of E. viminalis .................................................... 36
 Manna quality and the forty-spotted pardalote distribution ........................................................... 38
 Future directions and Implications of research ................................................................................. 39
REFERENCES ............................................................................................................................. 41
SUPPORTING MATERIAL .......................................................................................................... 46
LITERATURE REVIEW ................................................................................................................ 47
 ...................................................................................................................................................... 55

 4
ABSTRACT
Plant resources are essential for animal distribution and survival in all communities.
Therefore, it is of uppermost importance that ecologists understand how resources respond
in changing conditions to aid in future conservation and management of natural spaces. This
is particularly so regarding foundation species, where subtle intraspecific changes in their
plant resources can have broad scale effects throughout the community.

The manna of Eucalyptus viminalis is an essential food source of the endangered forty-spotted
pardalote (Pardalotus quadragintus). Manna is not well understood or studied and the
potential response under climate change is unknown. This study aimed to explore the
mechanisms behind manna trait variation in a two separate approaches. 1) to explore if
manna exhibits variation influenced by genetic and environmental factors, by utilising two
common-garden field trials in the Tasmanian Midlands. 2) to explore manna variation across
native distributions of E. viminalis on Bruny Island and investigate relationships between
climatic and soil variables.

This research further reinforces the importance of sucrose and raffinose in manna, as well as
the composition of manna. Manna quality as well as sucrose and raffinose sugars varies
spatially across Bruny Island. Manna quality is influenced by the environmental variable
annual heat moisture index (AHM), across Bruny Island. This research did not find any
indication of genetic control over manna quality. These results indicate that manna may be
vulnerable to climate change, which could have devastating effects on the endangered
pardalote species. The results can be used to aid future management and conservation
efforts, as well as supplementary feeding trials.

 5

Introduction
The survival and success of all animal species relies on the resources they can acquire. This
includes resources for food, habitat and protection. These resources can vary either spatially
or temporally, in quality or in quantity, and variation resources has the potential to impact
animal use around the resource. Trait variation within plant resources, such as higher or
lower quality resources, may influence the behaviour of the herbivore using the plant
resource (Price 1987; Wallis et al. 2002). Intraspecific variation within resources has been
proven to influence herbivore behaviours and choice around resource use, which can span
many ecosystem levels within the community (Bailey et al. 2006; Barbour et al. 2009; Frye et
al. 2013). This behaviour and choice around resource uses by a single species can cause wider
spread influences on the community. Two examples of this is it can lead to plants resources
investing in defences against browsing (a variation in trait) (Gowda 1996) and it can lead to
increased competition for resources (a variation in abundance) (Arsenault and Owen‐Smith
2002). The ways in which species respond to variation in resources can have transformative
effects on the community and ecosystem around them, by influencing other species within
the community, and cascade through animal plant interactions within the community.

Trait variation in plant resources is controlled primarily by one of three factors. Traits can vary
based on genotype (the underlying genetic composition of an organism), due to
environmental variation (such as climatic factors of precipitation and aspect) and an
interaction between genotype and environment (for example, the response to the
environment depends on different genetic backgrounds)(Nicotra et al. 2010). Some resources
of the same species have high importance in the community structuring and composition then
others. These are known as foundation resources, and they play important roles in structuring
ecosystems, biodiversity and community productivity. Variations in resources, particularly
those that are genetically underpinned, can influence broad aspects of the community (Bailey
et al. 2009).

Eucalyptus woodlands as foundation species
Eucalyptus woodlands are a critical habitat in Australia, that are habitats for a large diversity
of species. They can form the basis of very productive communities and are considered a
foundation species in many of these systems (O'Reilly-Wapstra et al. 2004). Eucalypts can also

 6
play important roles in regulating forest structure function and stability by stabilizing
ecosystem functions (Barbour et al. 2009; Whitham et al. 2006) and intraspecific variation in
their trees resources can influence the wider community. Variation in eucalypt defensive
chemistry can be influenced by both genetic and genetic by environmental factors (O'Reilly-
Wapstra et al. 2005), making it a topic of interest in relation to community genetics.

Many studies in the Eucalyptus system have examined intraspecific variation in plant
defensive traits and shown that these traits are under genetic control (Lawler et al. 2000;
O'Reilly-Wapstra et al. 2002; O'Reilly-Wapstra et al. 2004) and genetic by environmental
interaction (Herrera and Bazaga 2011). Although the majority of intraspecific trait variation in
defensive compounds appears to have some element of genetic control (Herrera and Bazaga
2011; Lawler et al. 2000; O'Reilly-Wapstra et al. 2002; O'Reilly-Wapstra et al. 2004), some
eucalypt traits are also influenced by environmental effects (Macfarlane et al. 2004; McLean
et al. 2014; Nicotra et al. 2010).

While there has been a large amount of work in the past two decades on understanding how
eucalypt defensive traits vary within a species and the implications on feeding herbivores,
little work has examined intraspecific variation in positive tree traits that feed animals but do
not have a defensive role for the tree, such as sugars resources such as nectar, honeydew,
sap and manna. Does intraspecific trait variation in positive resources also major community
wide influences on the broader community?

The importance of sugary resources
Plant resources high in sugar content provide high levels of energy and nutrients to many
animals and bird species (Bolnick et al. 2011). Research into the important plant resources of
nectar show that trait variation can be influenced by genetic, environmental or genetic by
environmental interaction, but environmental factors mediate the majority of its traits
variation (Mitchell 2004; Parachnowitsch et al. 2019). Manna is a liquid sugary secretion that
oozes from wounds mostly caused by insect bites on the tree stems and hardens to an almost
solid state. It has only been observed within the Myrtaceae (Myrtle) family, on several species
of Eucalyptus (including, but not limited to, E. viminalis, E. Paucifora, E. panctata, E. maculate,

 7
E. manifera) and two Angophora species (A. floribunda and A. costata) (Basden 1965; Paton
1980; Steinbauer 1996). Manna is an important resource to woodland birds, particularly
species that rely on sugar rich compounds all year around. However, research is limited on
manna, and as a result even basic understanding such as how it arises or what it is influenced
by, is not yet understood. It was previously hypothesized that manna secretion was a
response to insect saliva on tree stems (Basden 1965), but recent research has shown that
manna secretion can be promoted by scalpel wounds as well (Case and Edworthy 2016).
Therefore, manna secretion is likely to be linked to sap, like other Eucalypt resources such as
extrafloral nectaries (nectar-secreting glands that develop outside of flowers, Bentley 1977)
or kino (a reddish-brown exudate occurs in response to wounds on tree; Tippett 1986), but
this is still unknown. Only a couple of studies have investigated manna’s chemical
composition, and as a result we know manna does vary interspecifically between trees and
intra-specifically between individuals within species (Basden 1965; Swart 2017). There is
intraspecific variation within one Eucalypt species in traits of sugar concentration and manna
quality (Swart 2017), however there is no research into what mechanisms relate to manna
variation within species.

Manna is an important resource of eucalypt systems, being consumed by a vast range of
animals including insects, marsupials and birds (Paton 1980; Paton 1982; Steinbauer 1996). It
also feeds marsupial species. Sugar gliders (Wallis and Goldingay 2014) have been seen
opportunistically eating this carbohydrate rich resource. Many insects from the Hymenoptera
family feed on manna when available, particularly ants, which feed on manna directly from
tree, or when fallen on ground (Paton 1980; Steinbauer 1996). Up until recently, the research
surrounding how manna was produced was uncertain. A recent study uncovered that manna
could be created by artificial wounds to tree stems (Case and Edworthy 2016). This rejected
previous hypothesis that manna was an enzymic reaction of the insect saliva on the exposed
wound of the stem (Basden 1965).

The important relationship between the Forty-Spotted Pardalote and Eucalyptus viminalis
The forty-spotted pardalote (Pardalotus quadragintus) has a close life history with Eucalyptus
viminalis trees. It lives and feeds from them and can also perform a rare action of inducing
manna secretion. The small habitat specialist has a hooked beak and scrapes at tree stems to

 8

produce manna, an action only first recorded in 2016. The small canopy gleaning bird returns
to the wound sites and collects manna secretions once hardened (Case and Edworthy 2016).
This is evidence of ‘farming’ and may have implications for the broader community, as manna
is consumed by a wide array of animals who opportunistically consume it. Therefore, the act
of producing manna, and therefore the presence of the pardalote in any given community,
may change the shape of the community, and influence the presence and abundance of other
species within.

Manna is an important resource to the pardalote and makes up a large proportion of its diet
(Bryant 2010; Case and Edworthy 2016). Manna makes up 80% of the diet of young fledglings
that are growing and still reliant on their parents. This makes manna as a resource particularly
important as the forty-spotted pardalote is an endangered species that has experience major
range restrictions and loss of population. As an endangered species, the health and survival
of offspring is absolutely crucial for their future.

What do we know about manna?
Manna is a sugary carbohydrate of great complexity. Around 60% of the compound is pure
carbohydrates, the remaining proportion is mostly water. Research on manna chemical sugar
compositions shows us that it does vary between tree species (Basden 1965) and within trees
of the same species (Swart 2017). Specifically, the manna of E. viminalis contains more than
20 different types of sugars and just 5 sugars make up 99% of the total sugar composition.
They are raffinose, sucrose, stachyose, fructose and glucose, and 5 sugars vary in proportion
between different trees. This is most evident when looking at raffinose and sucrose contents.
Previous research by Swart (2017) looked at the behaviours of pardalotes in association to
their tree use. She uncovered that the pardalotes have primary and secondary trees in which
they farm manna from, and that these trees have different sugar proportions. Primary trees,
in which pardalotes spent upwards of 80% of their time foraging in, had significantly higher
proportions of sucrose relative to raffinose, when compared to secondary trees (which
pardalotes spent less than 15% of time in) (Figure 1). Therefore, Swarts results shows a
preference of high sucrose and low raffinose in the manna. This is referred to as the sucrose
to raffinose ratio (SUC:RAF), and is an indicator of manna quality.

 9
Manna as a resource, and the variation within its traits, is still very misunderstood.
Understanding how manna varies and the mechanism that underpin it is crucial, as the forty-
spotted pardalote is a species a vulnerable species to the impacts of climate change (Foden
et al. 2013). It relies heavily on E. viminalis, and has already experienced significant population
declines (Bryant 2010). In order to make proactive decisions in conservation and management
around this vulnerable species, knowledge in an essential food source is critical moving
forward trying to protect this species.

Aims
The main aim of this research was to explore the intraspecific variation in manna quantity of
manna in E. viminalis and understand the genetic and environmental effects mediating this
variation. To do this, I separated the study into two approaches.

In part one I investigated variation in manna in two common garden field trials to determine
the degree to which variation in manna is genetically and environmentally influenced.

In part two I investigated how manna quality varies across a native distribution of E. viminalis
and assessed if variation in manna related to climatic and soil variables.

 10
Figure 1: Variation in manna quality between primary and secondary used trees of the forty-
spotted pardalote (Pardalotus quadragintus) on Bruny Island. Figure of (Swart) 2017.

 11
Methods
Part one: Common-garden field trials
To determine whether the quality and quantity of manna varied due to provenance (genetic),
site (environment), or their interaction (genetic by environment), I accessed two pre-
established common-garden field trials in the northern midlands of Tasmania (Connorville: -
41.828636°, 147.138727°; Relbia: -41.520906°, 147.240920°). The two trial sites were 35km
apart and occupied similar climates (mean annual temperature: Connorville 11.5°C, Relbia
12.2°C; mean annual precipitation: Connorville 626mm; Relbia 654mm) at different
elevations (Connorville: 179m; Relbia: 58m). The trials were established in September 2016
(Connorville) and June 2017 (Relbia) using open-pollinated seed (hereafter ‘families’)
collected from 8-10 trees from each of the seven provenances (i.e. the geographical location
of the germplasm) (Table 1). These provenances were sampled along a temperature and
precipitation gradient that transgressed the midlands of Tasmania (Whitmore 2015). One-
year old seedlings were planted into rip mounds (Connorville) and Wilko mounds (Relbia) as
single-tree plots in a randomised complete block design with 2 (Connorville) and 6 (Relbia)
replicates. As early establishment at Relbia was low and to keep sampling for manna balanced
across the two sites, I collected manna from plants from the two replicates in Relbia with the
highest survival (Replicates 2 and 5). This sampling strategy resulted in each family being
represented at least twice at Relbia.

 12
Table 1: Description of the seven populations planted in the common garden field trials.
Shown are the seven provenances and their maximum temperature of the warmest period
(TMXWP), mean annual precipitation (MAP) and annual heat moisture index (AHM)
calculated as (MAT + 10) / (MAP/1000) where MAT is the mean annual temperature of the
provenance. The grey shaded cells correspond to the northern and southern provenances
sampled outside the midlands of Tasmania.

 Region Provenance Code TMXWP (°C) MAP (mm) AHM

 Non-arid Brushy Lagoon BL 22.5 998.1 21.0

 (North) Nunamara N 22.1 1064.2 19.3

 Symmons Plains SP 24.2 616.7 35.0
 Arid
 Connorville C 24.4 611.5 34.8
 (Central)
 Ross R 23.8 509.1 41.5

 Non-arid Tooms Lake TL 20.5 557.9 35.5

 (South) Stonor S 21.4 604.8 33.1

Manna extraction:
Manna was extracted for each individual in the above-mentioned replicates at Connorville
and Relbia by making small lateral incisions in the branch with a scalpel (Figure 2A) following
the protocol outlined by Case and Edworthy (2016). Incisions were only made on healthy
stems between 1mm and 8mm in diameter, where up to four stems per individual that were
at least 1.5m above ground (where possible) were sampled for manna. On each stem, two
separate cuts more than 2 cm apart were made usually above a stem axis or below a leaf
petiole, giving a total of up to eight incisions per tree (i.e. four stems per individual and two
incisions per stem). A plastic zip-lock bag was then used to cover the stem and incision sites
(Figure 2B,C), with holes cut in the bottom of the bag to allow for ventilation and the release
of built up condensation. The bags were used to protect manna secretions from foragers, such
as ants and birds. However, in some instances, the bags did not protect the manna from ants
and other invertebrates and unavoidable foraging of manna was observed at Connorville. The

 13
stems were left for 24 hours before manna was collected into 50mm vials. Total secretions
from each tree were pooled into one vial and it was noted how many secretions were
produced by each tree and the stem diameters of where manna secretions formed. Vials of
manna were labelled with the individual plants unique identifier and placed in a -20°C freezer
at the end of the day to limit any deterioration of the manna before chemical processing could
occur.

To determine whether sugar composition of manna varied through time, manna samples
were collected across at least two sampling periods. In all cases, manna was extracted from
the same individuals across the sampling periods, with the exception at Relbia, where an
additional third replicate was sampled during the second sampling period. This was due to
low success rates extracting manna during the first sampling period, as to obtain a suitable
representative sample size across provenances. A third sampling period was undertaken at
only Connorville following a heavy two-day rain event (total precipitation 28ml), providing an
opportunity to test whether success in extracting manna may be coincidental with increased
soil moisture. For Connorville specifically, 7 trees produced manna in all three time points, 8
trees produced manna across two time points and 19 trees produced manna once. For Relbia,
a total of 5 trees produced manna over the two sampling periods and a further 24 trees
produce manna a single time. Sixty-three trees produce manna over all sampling periods from
both field trials. The total number of samples collected from each population within each
common garden site is detailed in Table 2. Of the 63 trees that produced manna, thirteen of
the samples were not collected due to the manna sample being either too small to collect (n
= 10), contaminated by dirt and animal faeces (n = 1), or dropped in the wind (n = 2).

 14
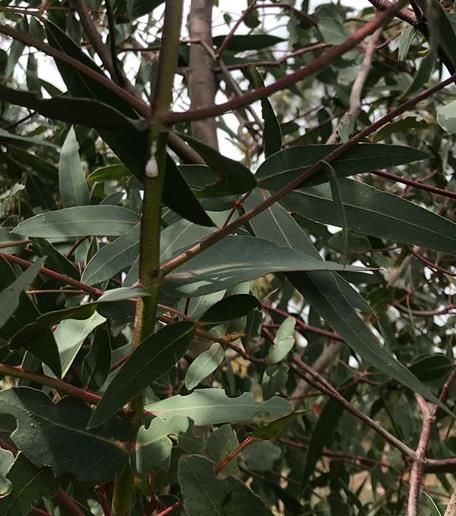
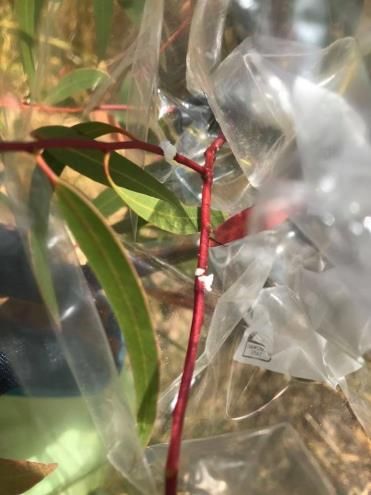
A B C

Figure 2: Example of the manna extraction procedure. Using a scalpel blade, an incision was made to
the stem of Eucalyptus viminalis (A). The branch, including the incision site, was bagged to protect the
manna from degradation and harvesting by insects (B). The incision site was left for 24 hours, where
the crystalised manna was collected (C).

Table 2: The manna sample success from each provenance across the Connorville and Relbia
common garden field trials in the Tasmanian Midlands. Including the number of Eucalyptus viminalis
trees sampled and success rates of manna extraction for each provenance. The grey shaded cells
correspond to the northern and southern provenances sampled outside the midlands of Tasmania.

 Connorville Relbia

 Provenance Trees sampled Manna success Sample size Manna success

 Bushy Lagoon (BL) 9 5 14 4

 Nunamara (N) 12 5 15 1

 Stonor (S) 6 2 15 3

 Connorville (C) 15 7 21 1

 Ross (R) 10 4 20 9

 Symmons Plains (SP) 10 7 18 6

 Tooms Lake (TL) 12 4 16 5

 Total 74 34 119 29

 Success rate 45.9% 24.4%

 15
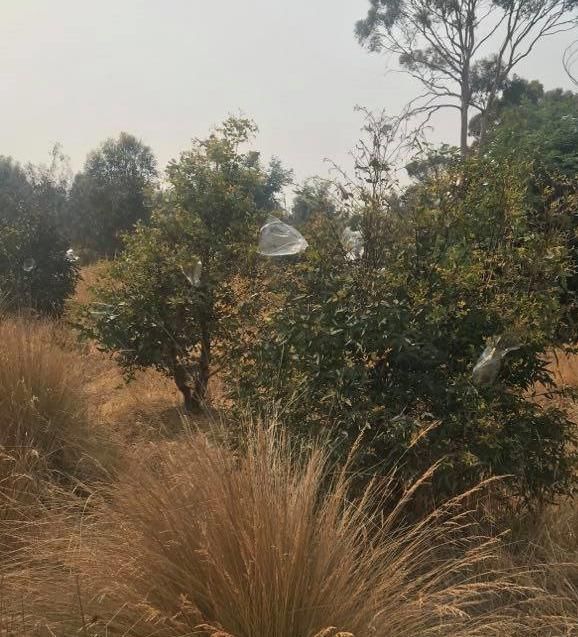
Part two: Bruny Island
To determine whether manna quality varies across the native stands of E. viminalis, I assessed
manna quality across ten sites on Bruny Island in February 2020. Bruny Island was selected
because it represents a stronghold for the forty-spotted pardalote, supporting around 450
individuals, which constitutes a third of all known occurrences of this species. Sites were
distributed evenly across North and South Bruny (five sites within each region, Figure 3) and
selected to reflect varying soil types and aridity gradients. At least five of the selected sites
had (or had in the past few years) forty-spotted pardalotes nesting within trees at that site
(Bryant 2010). Trees within each of the ten sites were sampled at two canopy heights or 100m
apart. Unlike the common garden field trials where manna was sampled directly from tree
branches on site, two small branches were collected from within individual tree canopies on
Bruny island using an extendable pruning pole, up to a maximum height of 10 metres. The
branch was labelled with a unique identifier and placed in a bucket of water as soon as
possible before being transported back to the University of Tasmania. Branches were then
stored in buckets of water and incisions made with a scalpel on multiple stems from each
branch (see ‘Manna extraction’ in Part 1 above). Incisions were checked every 24 hours for
visible manna secretions. Manna from separate stems of each tree were placed in separate
vials to see if manna varied between branches on the same tree. If no manna had been
produced, repeat cuts were made and checked every 24 hours. This continued until manna
was extracted from at least one branch per tree, or the branch wilted. Dates were noted from
which manna secretions were collected. A total of 66 trees were sampled within an eight-day
period, 48 trees successfully produced manna.

 16
Figure 3: Distribution of sampled populations of Eucalyptus viminalis on Bruny Island. Black
points indicate the sampled trees within locations which were grouped by region, where the
red circles correspond to the populations sampled on North Bruny (N1-N5) and blue circles
correspond to the sampled South Bruny (S1-S5) populations.

 17
Manna Analysis by Liquid-Chromatography Mass-Spectrometry
All manna samples produced in part one and part two were processed at the University of
Tasmania’s Central Science Laboratory. Sugars were extracted and analysed by Liquid-
Chromatography-Mass Spectrometry (LC-MS). The manna sample in each vial was weighed
and total weight recorded in milligrams (mg) to five decimal places and recorded for overall
weight. A subsample of between 1.00 and 2.00mg (maximum of 2.00mg and minimum of
0.01mg) from each vial was taken and placed into a 2mL LC-MS vial. Manna was dissolved
with equal proportions of distilled water (eg. 1mg of manna with 1mL of distilled water). The
solution was vortexed for 5 seconds until manna was dissolved. Sugars were analysed by LC-
MS following the below methods. I focussed on the five main sugar groups; raffinose, sucrose,
stachyose, fructose and glucose, which had previously been shown to make up 99% of the
total sugar composition (Swart 2017). Glucose and galactose were unable to be differentiated
due to their similar molecular structure (Gaucher and Leary 1998) and were therefore
grouped together.

LC-MS was conducted at the University of Tasmania’s Central Science Laboratory, using a
Waters Acquity H-Class UPLC instrument coupled to a Waters Xevo TQ triple quadrupole mass
spectrometer. Waters a Acquity UPLC BEH Amide column (50 x 2.1 mm, 1.7um) was used and
the mobile phase used two solvents of 0.4% (v/v) Ammoniun hydroxide in water (solvent A)
and Acetonitrile (solvent B). The UPLC program ran for 6 minutes at 20% A:80% B to 45%
A:55% B, which was followed by immediate re-equilibration to starting conditions for three
minutes. The column was held at 50°C, and sample compartment at 6°C. Flow rate was 0.35
mL min-1 with and injection volume of 1 uL.

The mass spectrometer was operated under negative ion electrospray mode with a needle
voltage of 2.7kV. Analytes were detected using single ion monitoring with [M-H]- deproinated
molecular species. To detect C6 monosaccharides, (m/z) 179.05 with a cone voltage of 17V
was used. For disaccharides, (m/z) 341.10 at 24V, trisaccharides, (m/z) 503.15 at 30V and
finally, tetrasaccharides used (m/z) 665.20 at 36V. Dwell time was 0.057 seconds and the ion
source temperature 130°C. Desolvation gas was N2 at 950 L h-1 (with a temperature of 450°C
) and the cone gas flow was 100 L h-1. Data were processed using MassLynx software (Nichols,
D. pers comm).

 18
Individual sugars (raffinose, stachyose, glucose, fructose, sucrose) were identified and
quantified (into parts per million, PPM) using the external calibration approach. Five
individual calibration standards of each sugar were produced at known concentrations in
distilled water and analysed in sequence with every 20 samples. Unidentified tetrasaccharides
(in addition to stachyose) were quantified as “Stachyose equivalents” using the Stachyose
external calibration curve. A small number of trees (N=8) found traces of tetrasaccharides,
and therefore, due to the low sample size it was not included in statistical analysis.

Tree traits and environmental variables
To determine whether sugar composition of manna traits co-varied with tree size, tree
heights of individuals within the field trials were measured using height poles (in cm), and
individuals across Bruny Island were measured for tree trunk size at diameter at breast height
(1.3m, DBH) .To examine how variation in manna quality co-varied with home-site
environment, I obtained data for each provenance (field trials) and population (Bruny Island)
for key climate and soil traits thought to mediate variation in plant traits (Harrison 2017;
Prober et al. 2016), downloaded from the Atlas of Living Australia (https://spatial.ala.org.au/,
accessed 24 March 2020) using the ALA4R package in R (R Core Team 2013). This included
three bioclimatic variables (maximum temperature at warmest period [TMXWP], mean
annual precipitation [MAP], mean annual temperature [MAT]), a measure of home-site aridity
 +10
(annual heat moisture index [AHM]) estimated as (AHM= /1000 ) following Wang et al.

(2006), and four soil attributes (total phosphorous [PTO], total nitrogen [NTO], plant
extractable depth [DPE], soil organic carbon [SOC]; (Viscarra Rossel et al. 2015)) calculated as
the mean value within a 2 m soil profile.

Data Analysis
Manna sugar composition obtained from the common garden field trials and natural field
population were analysed separately using R version 3.6.2. Raw sugar outputs were in in
present amounts (PPM), and the total of all sugar outputs (total PPM) gives total sugar
concentration within the manna sample. For data analysis, sugars were standardised across
samples as the proportion of each sugar relative to the total sugars within given sample. Swart
(2017) identified the ratio of sucrose to raffinose (hereafter SUC:RAF) as an important

 19
predictor variable associated with tree preference by the forty-spotted pardalotes. Thus I also
calculate SUC:RAF as the proportion of SUC divided by the summed proportion of SUC and
RAF. Prior to analyses, data was explored Zuur et al. (2010). Univariate and bivariate outliers
were detected using a modified z-score test and Mahalanobis distance, respectively. Outliers
were checked for data entry errors and removed where necessary to limit adverse effects of
leverage and influence. This procedure removed 4 and 9 points from the common garden
field trial and Bruny Island data sets, respectively.

Common garden field trials
To explore associations between mannaa produced by the sampled E. viminalis individuals
over time points (t), I used a Spearman’s Rank correlation test. This was pursued by
comparing the sugars within a site for the following contrasts: t0 vs. t1 (both field trials), t0 vs.
t2 (Connorville only) and t1 vs. t2 (Connorville only). As sugar quality was significantly positively
associated among the time periods (see ‘Results’), duplicated samples across the time periods
were removed.

To test whether the proportion of each sugar and the SUC:RAF ratio varied among sampled
provenances, site and the interaction of provenance by site, I fitted the following model:
Y = µ + provenance + site + prov*site + height + ε
(Model 1)

where µ is the mean response, provenance, site and their interaction are fixed effects, and
height is the normalised height of the tree fitted as a covariate. This presence/absence of
manna was fitted using a generalized linear model (GLM) assuming a Bernoulli error with a
logit link function. Model assumptions of normality and homoscedasticity were visually
assessed following Zuur et al. (2016) using diagnostic plots produced from simulated model
residuals using the DHARMa package (Hartig 2019). Statistical significance of fixed effects
were assessed using a likelihood ratio test implemented using the ‘drop1’ function.

As the proportional data followed a beta distribution (i.e. bounded between the open interval
(0,1); (Douma and Weedon 2019; Ferrari and Cribari-Neto 2004), models were fitted using
generalized additive models (GAM) with a logit link function using the ‘gam’ function the mgcv
package (Wood 2017). As no smoother terms were incorporated into the model, the GAM

 20
was effectively a penalised GLM (Wood 2017). In cases where the proportion of a sugar was
at the boundary of the beta distribution, the sugar values were re-scaled following Smithson
and Verkuilen (2006). Model assumptions of normality and homoscedasticity were visually
assessed using diagnostic plots produced by the ‘gam.check’ function following Zuur et al.
(2016). Significance of fixed effects were assessed using a likelihood ratio test implemented
using the ‘anova.gam’ function As I a priori hypothesised that manna would vary by home-
site environment (where the seed was originally sourced from), I tested associations between
provenance mean sugar and home-site climate and soil using a Spearman’s Rank correlation
test.

Natural populations of E. viminalis at Bruny Island
To test whether the proportion of a sugar varied within a tree, I assessed the association
between manna samples collected across different branches (9 pairs) using a Spearman’s
Rank correlation test. Following this, duplicated manna samples within a tree were removed.

To test whether the probability of obtaining manna among sampled populations and their
test environment, I fitted the following model:

Y = µ + population + DBH + ε
(Model 2)

where µ is the mean response, population is a fixed effect, and DBH is the normalised
diameter at breast height (1.3m) fitted as a covariate. As above-mentioned, success was fitted
using a generalized linear model (GLM) assuming a Bernoulli error with a logit link function.
Model assumptions and statistical significance of the fixed effect of population and covariate
of DBH were assessed following the same procedure as above. To test whether the proportion
of each sugar and the SUC:RAF ratio varied among populations and covaried with tree growth
(DBH), Model 2 was fitted using a generalized additive models (GAM) with a logit link function.
Model assumptions and significance of the population and DBH terms were assessed as
above. To test whether the proportion of each sugar covaried with population home-site
climate and soil, I extracted the marginal least-square means from Model 2 using the
emmeans package (Lenth 2019) and fitted separate beta regression GAMs, fitting the

 21
marginal least-square mean as the response and each climate and soil variable as the
predictor.

 22
Results
Common garden field trials
One-hundred and ninety-two Eucalyptus viminalis trees were sampled across the Connorville
and Relbia common garden field trials planted in the Tasmanian Midlands. There was low
success in extracting manna across the 2-3 attempts, with 45.9% and 24.4% success at
Connorville and Relbia respectively (Table 2). The manna from Connorville on average
consisted of 64.62% raffinose, 33.23% sucrose, 1.26% stachyose and less than 1% glucose and
fructose combined (Table 3). This was similar to Relbia, with raffinose making up 60.05%,
followed by sucrose at 37.31% and stachyose at 1.79%. Glucose and fructose again made up
less than 1% of the manna. The results of exploration into any variation over the different
time periods showed significant correlation for the main sugar types (FRU, SUC, RAF and
SUC:RAF; Table 4). This positive correlation between attempts suggests that the variation in
sugar does not change the provenance mean rank across time periods.

There was variation between sugar content across the field trails, and between provenances
at each site. Relbia has a higher overall means of SUC:RAF than Connorville, of 0.3828 and
0.3394 respectively (Table 3). Provenance variation across field trials was also observed, most
notably provenance C, which has a SUC:RAF difference of 0.2%, attributed to around 20%
variations in SUC and RAF at Connorville compared to Relbia. Despite these observed
patterns, there were no differences in the concentrations between site ( 12 = 1.11, =
0.292), provenance ( 52 = 7.69, = 0.174), or a significant provenance by site interaction
( 62 = 4.63, = 0.592). Exploration of the environmental data of maximum temperature
at warmest period (TMXWP) and annual heat moisture index (AHM) indicated that there was
no significant association between climate and SUC:RAF across provenances for either
common garden trial (Table 5).

 23
Table 3: Summary of sugar proportions within the manna of Eucalyptus viminalis in the
common-garden field trials of Connorville and Relbia of the Tasmanian Midlands. Includes
breakdown of samples within each provenance established in the common gardens.
 Total
 Individuals
 Prov manna GLU (%) FRU (%) STA (%) SUC (%) RAF (%) SUC:RAF
 sampled
 success
 Connorville
 BL 4 9 0.24 0.56 1.31 41.23 56.66 0.4210
 N 4 12 0.57 0.69 1.02 34.16 63.57 0.3493
 S 1 6 0.25 0.47 1.03 35.91 62.34 0.3655
 C 5 15 0.27 0.34 1.85 21.47 76.08 0.2209
 R 4 10 0.75 0.79 1.08 30.44 66.94 0.3121
 SP 5 10 0.51 0.62 1.23 30.17 67.47 0.3086
 TL 3 12 0.00 0.18 1.27 39.25 59.29 0.3982
 Overall Means: 0.37 0.52 1.26 33.23 64.62 0.3394

 Relbia
 BL 3 15 0.41 0.52 1.92 33.99 63.16 0.3497
 N 0 15
 S 3 12 0.55 0.74 1.74 39.44 57.54 0.4060
 C 2 20 0.00 0.36 1.31 42.15 56.19 0.4286
 R 6 13 0.33 0.52 1.94 34.02 63.19 0.3499
 SP 4 14 0.65 0.74 1.69 28.93 67.99 0.2979
 TL 4 12 0.03 0.33 2.12 45.32 52.20 0.4648
 Overall Means 0.33 0.56 1.79 37.31 60.05 0.3828

Table 4: Spearman’s rank correlation test across attempts at the Connorville common
garden field trials: Sugars included are fructose (FRU), glucose (GLU), stachyose (STA), sucrose
(SUC) and raffinose (RAF).

 Sugar type RHO P-value
 FRU 0.767 0.016

 GLU 0.000 1.000
 STA 0.450 0.224
 SUC 0.667 0.050
 RAF 0.700 0.036
 SUC:RAF 0.667 0.050

 24
Table 5: Associations between climate variables and the sucrose to raffinose ratio at the
common-garden field trial sites Connorville and Relbia of the Tasmanian midlands: Including
variables of maximum temperature of the warmest period (TMXWP) and annual heat
moisture index (AHM).

 Connorville Relbia

 RHO P-value RHO P-value

 TMXWP -0.643 0.1194 -0.2 0.704

 AHM -0.5 0.253 0.257 0.623

 25
B
 A

 C D

Figure 4: Proportion of sugar contents within total manna sugar composition of Eucalyptus
viminalis provenances grown at the Connorville and Relbia common-garden field trials in
the Tasmanian Midlands: A and B provides visual representation of the sugar proportions in
manna at Connorville and Relbia. Sugars included are fructose (FRU), glucose (GLU), stachyose
(STA), sucrose (SUC) and raffinose (RAF). C and D are boxplots of the sucrose to raffinose ratio
variation between provenances across the two field trials.

 26
Natural populations of E. viminalis at Bruny Island

Seventy-four Eucalyptus viminalis trees were sampled across Bruny island, of which 78.7%
successfully produced manna to cuts on tree stems. Thirteen trees did not produce any
manna. Success in extracting manna did not vary between populations (see Table 6, Figure 7)
( 72 = 5.758, = 0.568 . The size of tree, DBH, was not associated with the probability of
success of manna extraction ( 12 = 1.605, = 0.205).

Of the five sugar types analysed, raffinose (RAF) makes up the highest proportion of manna
analysed at Bruny Island, at 57.98%. This was followed by sucrose (SUC) at 39.15% (Table 6;
Figure 8), the two sugars making up around 97% of the total sugar content in manna. The
sugars stachyose (STA; 2.45%), fructose (FRU; 0.27%) and glucose (GLU; 0.15%) make up a
small proportion of the overall manna composition. When exploring whether there is
variation in manna within a tree, the results showed high association between branches for
SUC, SUC:RAF and a close to significant correlation for RAF.(Table 7).

The sugar content in manna varied between populations on Bruny Island. Manna
concentration, or total sugars present within the manna, was on average, 845 PPM. However,
I found variation in manna concentration between populations, from high concentrations in
S2 and low concentrations in N4 and N5 (Figure 7). In relation to specific sugar proportions,
of the five sugars, two (SUC: 72 = 23.29, = 0.002 and RAF: 72 = 26.83, < 0.001)
showed significant variation between populations (Table 8). The SUC:RAF also showed
significant variation between populations ( 72 = 24.73, < 0.001)(Table 8; Figure 10). The
SUC:RAF also exhibited significant variation at a broader spatial scale, at a regional scale
between north and south (Table 8; Figure 8).

The results indicate manna quality is associated with the climate variable annual heat
moisture index (AHM). Figure 9shows the significant association (X12 = 5.075, P = 0.078)
between SUC:RAF and AHM. As AHM increases, so does manna quality. Maximum
temperature at warmest period (TMXWP) was explored for associations, but the relationship
was non-significant (X12 = 2.49, P = 0.114). The results in this study show no significant
associations between manna quality and soil variables (Table 10). The soil variables of total
phosphorous in soil (PTO, X12 = 0.195, P = 0.659), total nitrogen in soil (NTO, X12 = 0.91,

 27
P = 0.34), plant extractable depth (DPE, X12 = 0.216, P = 0.642) and soil organic carbon
(SOC, X12 = 0.079, P = 0.778) all showing non-significant associations.

Table 6: Mean sugar composition and tree diameter at breast height for each sampled
population across Bruny Island. Shown are the number of individual trees sampled per
population (sample size), number of individuals that produced manna (manna success), the
mean proportion of each sugar relative to the total sugar content within a manna sample,
expressed as a percentage (Fructose [FRU], Glucose [GLU], Stachyose [STA], Sucrose [SUC],
Raffinose [RAF], and sucrose to raffinose ratio [SUC:RAF)). DBH refers to the diameter at
breast height (1.3 m) and are the mean of the successful manna producing individuals.
Populations N1 and S1 were removed from data set due to only having one manna sample
produced.

 Sample Manna DBH
Population GLU (%) FRU (%) STA (%) SUC (%) RAF (%) SUC:RAF
 size success (cm)
N2 10 9 0.14 0.31 2.05 36.08 61.42 0.3701 52.5
N3 8 7 0.22 0.30 2.78 48.85 47.85 0.5048 28.6
N4 4 4 0.06 0.18 2.50 44.38 52.89 0.4563 34.0
N5 4 3 0.42 0.44 2.19 37.87 59.08 0.3908 31.5
S2 9 8 0.04 0.19 2.39 34.67 62.71 0.3552 60.0
S3 4 2 0.14 0.42 2.66 42.07 54.71 0.4352 31.3
S4 4 3 0.15 0.17 3.02 31.61 65.06 0.3269 26.8
S5 5 2 0.10 0.30 2.49 31.90 65.21 0.3288 19.6
Overall Mean 0.15 0.27 2.45 39.15 57.98 0.4030 39.2

Table 7: Association between manna samples within individual trees Results from the
Spearman’s rank correlation between branch 1 and branch 2 showing the correlation
coefficient (RHO) and the probability of observing this coefficient given the data. Sugars are
abbreviated as follows: Fructose (FRU), glucose (GLU), stachyose (STA), sucrose (SUC),
raffinose (RAF) and sucrose to raffinose ratio (SUC:RAF).
 FRU GLU STA SUC RAF SUC:RAF
 RHO 0.518 0.576 0.536 0.964 0.714 0.821
 P-value 0.234 0.176 0.215 >0.001 0.071 0.025

 28
Table 8: The significance of sugar variation amongst populations on Bruny Island. Results
from ANOVA showing significant values for variation in sugar quantity of sucrose (SUC),
raffinose (RAF) and the sucrose to raffinose ratio (SUC:RAF), between populations.

 Sugar type chi square P-value
 FRU 4.083 0.770
 GLU 7.980 0.334
 STA 1.952 0.963
 SUC 23.29 0.002
 RAF 26.825
Figure 5: Percentage of manna extraction success across sampled populations of Eucalyptus
viminalis on Bruny Island.

Figure 6: Proportion of sugar contents within total manna sugar composition across populations of
Eucalyptus viminalis on Bruny Island: Visual representation of how the five sugars vary among native
stands of Eucalyptus viminalis on Bruny Island. Sugars represented include fructose (FRU), glucose
(GLU), stachyose (STA), sucrose (SUC) and raffinose (RAF).

 30
Figure 7: Variation in the total amount of sugar across populations of Eucalyptus viminalis
on Bruny Island: Total sugar refers to the total amount (in PPM) of sugar within samples. The
green triangles indicate above mean results of total sugars, and the red circles indicate below
mean results. The larger the shape (triangle or circle), the further from the mean result the
population is.

 31
Figure 8: Variation in sucrose to raffinose ratio of Eucalyptus viminalis manna across
populations on Bruny Island, Tasmania. Northern region in red and southern region in blue.
Significant associations were seen on both regional ( X12 = 5.78, P = 0.0162) and population
levels ( X17 = 24.734, P < 0.001).

 32
Figure 9: Association between manna quality (SUC:RAF) and annual heat moisture index
(AHM) of populations of Eucalyptus viminalis on Bruny Island: With 95% confidence
intervals. AHM is Incorporates annual mean temperature with annual precipitation and gives
better representation of soil moisture than precipitation alone.

Table 10: Associations between manna quality and soil variables: ANOVA of sucrose to
raffinose ratio and the soil variables of total phosphorous in soil (PTO), total nitrogen in soil
(NTO), plant extractable depth (DPE) and soil organic carbon (SOC)

 Chi square P-value
 PTO 0.195 0.659
 NTO 0.91 0.34
 DPE 0.216 0.642
 SOC 0.079 0.778

 33
Discussion
This research explored how manna quality of Eucalyptus viminalis varies over the Tasmanian
landscape, and the mechanisms that may underpin this variation. Two key findings are
evident. First, two key sugars (sucrose and raffinose) and their ratio (indicating manna quality)
varies spatially across Bruny Island. Second, manna quality relates to the environmental
variable annual heat moisture index (AHM), across Bruny Island.

This research provides insights on the composition of manna. Past research has identified five
dominant sugar groups (fructose, FRU; glucose, GLU; stachyose, STA; sucrose, SUC; raffinose,
RAF) comprise the majority of manna composition and the results of this study has further
reinforced this. The sugar most prominent in manna across this study (as well as in previous
research) is raffinose (RAF), varying from between 58-80% across three previously researched
species of eucalyptus and an angophorous species. Of the previous research, E. viminalis has
the highest proportion of SUC in manna compared to all other investigated species, ranging
between 6% and 26.4% (Table 11). This study found SUC to vary anywhere between 21.5% (in
the field trials, table 5) and 48.9% (on Bruny Island, table 7). This high sucrose proportion may
be an important factor in why the pardalote species formed such an intimate relationship
with E. viminalis. Other Birds and animals do feed on manna, but the forty-spotted pardalote
is currently the only species known to rely on it so heavily.

Table11: Percentage manna composition comparison from previous research: Results from
this study are separated from Bruny Island and averaged across the common-garden field
trials. Other data is from Swart (2017) unpublished data and Basden (1965).

 Source Common gardens Bruny Island, Swart Basden Basden Basden (1965)
 (This study) (This study) (2017) (1965) (1965)
 Species E. viminalis E. viminalis E. viminalis E. maculata E. punctata Angophorous
 costata.
 Stachyose 1.53 2.45 3.9 - 2 10
 Raffinose 62.3 58 68.6 80 80 65
 Sucrose 35.3 39 26.4 6 10 20
 Glucose &
Variation in manna across the common garden field trials
The aim of the common-garden trials was to understand if quality in manna varies across
different provenances of E. viminalis, different environments and the interaction between
provenance and environment. Common garden trails provide an excellent framework to tease
apart the effects of genetics and environment on plant traits. Differences in manna quality
between provenances planted in a randomised common garden trial, may indicate a genetic
influence of manna variation. Furthermore, differences in manna traits across sites could
indicate environmental influence of manna variation. This study found no significant
differences between provenances, sites and no significant interaction between provenance
and site in manna quality of E. viminalis.

Manna quality showed high consistencies across different sampling periods. This was to
explore temporal variation in manna at the common garden field trials. This consisted of three
separate sampling periods throughout summer at the Connorville field trial. Past research
suggests seasonality in manna quantity (Spring and early summer saw greater quantities of
manna than winter, coinciding with rapid tree leaf growth (Basden 1965), however, this study
only looked at variation over a 6-week period, and found no results. This is potentially due to
the low sample size, the difficulty extracting manna, or the time of sampling (early to mid-
summer).

At this stage it is difficult to interpret these results due to low sample sizes. The low success
rate of extracting manna from the common garden trials may have affected the ability to
robustly test the genetic, environment and interactive effects. The method of manna
extraction by using a scalpel blade was adopted from (Case and Edworthy 2016). During the
study, some areas of manna extraction varied. Across the native Bruny Island sampling,
manna extraction occurred off-site, where branches were brought back to the university, and
many stems were cut on each branch to increase the likelihood of getting a manna secretion.
On top of that, repeated cuts occurred on stems over a number of days, further increasing
the chances of manna success. This was different from the method used in the common
garden field trials, where up to four branches and eight stems were cut on each tree and only
on one instance. This meant there were both less cuts and less attempts at gaining manna.

 35
This may help explain the large decrease in manna success from the native stands (71%) and
the field trials (45.9% and 24.4%).

There are potentially other reasons why manna success was so low at the field trials. One
explanation is the age of trees, as the native tree stands were significantly older than the
common garden trees. It is currently unknown whether manna is connected to any life history
stages. The trees within the field trials were on the cusp of flowering and budding, and it was
potentially the first reproductive season many of these trees had. If manna was linked to tree
maturity, many trees within the field trials may simply have been too young to produce
manna samples.

Manna quality showed high consistencies across different sampling periods. This was to
explore temporal variation in manna at the common garden field trials. This consisted of three
separate sampling periods throughout summer at the Connorville field trial. Past research
suggests seasonality in manna quantity (Spring and early summer saw greater quantities of
manna than winter, coinciding with rapid tree leaf growth (Basden 1965), however, this study
only looked at variation over a 6-week period, and found high consistencies, indicating no
variation. This is potentially due to the low sample size, the difficulty extracting manna, or the
time of sampling (early to mid-summer).

Variation in manna across the native distribution of E. viminalis
The composition of manna on Bruny Island was dominated by SUC and RAF sugars, and manna
quality showed significant variation across populations on Bruny Island. Manna quality, SUC
and RAF portions showed significant variation across populations and manna quality also
varied across region. These results could indicate a relationship between manna traits and
climatic variables. This study found a positive association between manna quality and the
annual heat moisture index (AHM) of populations on Bruny Island AHM incorporates average
temperature and precipitation variables instead of the two alone, to represent soil moisture
content (Wang et al. 2006). AHM may also be a more sufficient variable to use in relation to
effects from climate change (Castellanos-Acuña et al. 2018; Wang et al. 2006), as the
predictions of changes in precipitation are small by comparison to changes in temperature
(Flato et al. 2000).

 36
You can also read


