Validation of a temperature-dependent elasto-viscoplastic material model for a talcum-filled polypropylene/polyethylene co-polymer using glove box ...
←
→
Page content transcription
If your browser does not render page correctly, please read the page content below
Validation of a temperature-dependent elasto-viscoplastic
                                                               material model for a talcum-filled
                                                    polypropylene/polyethylene co-polymer using glove box
                                                                     flap component tests
arXiv:1906.10348v1 [physics.app-ph] 25 Jun 2019

                                                      D. Degenhardta,b , J. Langerc , L. Grevea , T.K. Ellera , M. Andresa , P. Horstb
                                                           a Volkswagen  AG, Group Research, P.O. Box 1777, 38436 Wolfsburg, Germany
                                                         b TU   Braunschweig, IFL, Herrmann-Blenk-Str. 35, 38108 Braunschweig, Germany
                                                          c Leibniz Universität Hannover, IKM, Welfengarten 1, 30167 Hannover, Germany

                                                  Abstract
                                                  In the automotive industry, thermoplastic polymers are used for a significant num-
                                                  ber of interior and exterior parts. These components have to pass all underlying
                                                  crash and safety relevant tests, where a proper performance is desired in the range
                                                  of low to high ambient temperatures. Today, the vehicle design is heavily aided
                                                  by numerical simulation methods for advancing towards a prototype free vehicle
                                                  development. This requires an accurate modeling of the temperature- and rate-
                                                  dependent, elasto-viscoplastic mechanical response of the polymer structures. In
                                                  this work, the validation of a novel elasto-viscoplastic temperature-dependent ma-
                                                  terial model is performed using glove box flap segments subjected to impact loading
                                                  by a spherical punch in a custom-build loading frame. The proposed material model
                                                  shows a very good prediction of the experimental results.

                                                  Keywords: temperature-dependency, fracture modeling, polymer, validation,
                                                  component testing

                                                      Email address: david.degenhardt@volkswagen.de (D. Degenhardt)

                                                  Preprint submitted to arXiv                                                   June 26, 2019
Nomenclature

Abbreviations

 Abbreviation        Meaning
 BT                  bi-axial tension
 FE                  finite element
 HA                  Hasek
 MMM                 modular material model
 PE                  polyethylene
 PP                  polypropylene
 PT                  punch test
 PTFE                polytetrafluoroethylene
 RT                  room temperature
 SH                  shear
 UC                  uni-axial compression
 UT                  uni-axial tension

Latin designations

 Symbol     Dimension          Description
 c          —                  fracture or hardening parameter
 d          mm                 displacement
 f          —                  scaling factor
 g          MPa                plastic potential
 k          —                  strain rate hardening function
 l          mm                 length
 t          ms                 time
 v          mm ms-1            velocity
 w          mm                 width

 E          MPa                elastic modulus
 F          N                  force
 R          GPa or mm          hardening function or radius
            ◦
 T            C                temperature

 FRAC       —                  maximum accumulated damage parameter

Greek designations

 Symbol     Dimension          Description
 γ          —                  yield function parameter
 δ          —                  flow rule parameter

                                        2
ε          —                 true strain
 ε̇         s−1               strain rate
 ε̄         —                 equivalent strain
 η          —                 stress triaxiality
 θ          —                 Lode angle
 θ̄         —                 normalized Lode angle
 ν          —                 Poisson’s ratio
 σ          MPa               true stress or yield strength
 σ̄         MPa               equivalent stress
 σ          MPa               Cauchy stress tensor

Subscripts and superscripts

 Symbol     Dimension         Description
 xe         —                 elastic
 xp         —                 plastic

 xc         —                 compressive
 xf         —                 fracture
 xm         —                 hydrostatic
 xqs        —                 quasi-static
 xt         —                 tensile
 xvM        —                 von Mises

Symbols and operators

 Symbol     Dimension         Description
 ∆          —                 differential operator

                                        3
1. Introduction

Polymers in the automotive industry are attractive as they can be used for model-
ing of complex structures while being cost-efficient [1]. For the prediction of the
material behavior of unstiffened thermoplastic polymers, there are several features
that have to be accounted for. Such properties include, among others, the rate- and
temperature-dependency of the mechanical properties, the yield strength difference
in tension and compression and the plastic softening driven by volume dilatation
[2, 3, 4, 5].

A phenomenological temperature-dependent material model capturing the afore-
mentioned polymer-specific phenomena was developed by Degenhardt et al. [6].
It relies upon a profound material characterization at the three main supporting
temperatures −35 ◦ C, 20 ◦ C and 90 ◦ C, considering several stress states such as
uni-axial tension (UT), uni-axial compression (UC), bi-axial tension (BT) and shear
(SH). The temperature-dependent material model is built on the basis of the mod-
ular material model (MMM) developed by the Volkswagen Group Research, which
has been previously used for modeling polymers and several metals [7, 8, 9, 10, 11].
As a dynamic UserMaterial library, the MMM is linked to the explicit crash code
Virtual Performance Solution [12].

In this work, the temperature-dependent material model is validated using a com-
ponent test: punch test with a glove box flap component. The material model is
validated at a combination of stress states and ambient temperatures which were
not used for model calibration. The strategy for validating the material model reads
as follows:

   • Comparison of material properties of UT specimens extracted from the glove
     box flap component and from the plates used for calibration, revealing some
     differences of the mechanical properties with regard to the fracture behavior.
     These effects will be taken into account by adjustment of the fracture model.
   • Execution of punch tests with glove box flap components at different ambient
     temperatures
   • Conduction of finite element (FE) simulations of the component impact test

   • Comparison of the force-displacement curves as well as the initial fracture
     positions of the physical experiments and the corresponding simulations

2. Material description

In this work, the investigated glove box flap component is made of a 20 wt% talcum-
filled semi-crystalline polypropylene (PP) / polyethylene (PE) co-polymer. The use
of the talcum filler aims to reduce costs while increasing crystallinity and stiffness as
well as decreasing the tenacity and impact strength [13]. The blend is widely used
in the automotive industry for several interior parts as well as paneling. Consisting

                                           4
of little quantities of PE (≤ 5 wt%), the blend behavior is estimated to be similar
to a pure PP but with increased ductility because of the weaker PE.

Depending on the manufacturing process, unstiffened polymers may also exhibit
anisotropic behavior and thickness sensitivity [14]. The reason for the anisotropic
behavior is that the polymer chains have a high degree of molecular orientation in
the mold flow direction. Moreover, preliminary experiments have shown that the
strength loss between specimens tested along (UT11) and perpendicular (UT22)
to the mold flow direction is around 15%, compare Figures 1a and 1b. For a
more conservative material design, the UT22 material properties are used for model
calibration. The loss in fracture strain due to the thickness effect from 2.3 mm to
3.3 mm is around 30% for UT22 at room temperature.

Figure 1: Thickness study of the talcum-filled PP/PE co-polymer for specimens in (UT11, a)
and perpendicular to (UT22, b) the mold flow direction

The thickness sensitivity, also illustrated in Figures 1a and 1b, comes into place
because of the skin-core effect. In 1972 Kantz et al. [15] first saw that the skin-core
morphology of their injection-moulded PP samples is influenced by molecular prop-
erties such as the molecular weight, and also by the processing conditions. They
showed that the melt temperature affects the crystallite orientation which is the ma-
jor parameter for several material properties, such as the tensile and impact strength
or the shrinkage. The observations were later confirmed by Altendorfer and Seitl in
1986 [16], who focused on the influence of the molecular weight and the molecular
weight distribution of injection-moulded samples. They varied the molecular weight
and the molecular weight distribution of their PP samples and concluded that the
skin-core morphology varies depending not only on the flow direction but also de-
pending on the molecular characteristics. Consequently, the skin-core effect causes

                                              5
the polymer chains in the skin zone to have a high degree of molecular orientation
in the flow direction of the melt due to the molecular motions forming new crystal
structures. This results in a higher strength under tensile load in this direction and
after Karger-Kocsis and Friedrich also in a higher resistance against fatigue rupture
[17].

As a result, when increasing the specimen thickness and assuming a constant width
of the skin layers, the ratio of skin to core zones decreases, leading to a lower over-
all strength. Therefore, polymers may diverge from the assumed isotropic material
behavior, depending on their flow direction, flow velocity and cooling rate from the
melt as well as their thickness.

3. Brief review of the material model
The temperature-dependent material model proposed in [6] is a generalized con-
stitutive model representing the deformation and fracture behavior of the PP/PE
co-polymer mentioned above for the crash-relevant temperature range from −35 ◦ C
to 90 ◦ C. For capturing the temperature-dependency, a non-linear interpolation
concept is introduced. The philosophy of the material model development is briefly
explained in the following, from material characterization to parameter identification
to model/test comparison. An overview of the process steps is given in Figure 2.
Generally, the material model is calibrated in two steps.

In a first step, a profound material characterization is performed at the three main
supporting temperatures −35 ◦ C, 20 ◦ C and 90 ◦ C. The material tests UT, UC, SH,
BT and plane strain tension using the Hasek (HA) test [18] are conducted. During
the experiments, the global measurements are the force and the displacement. In the
UT tests, the local strain field is measured in addition. This is highly recommended
because the fracture criterion is calibrated using the strain field as foundation. The
optimal parameters for the material model are identified by a minimization of tar-
get functions considering both the global forces and displacements as well as the
local strains. Consequently, the optimal parameter set often tends to be a trade-off,
however, this way the best fit of both quantities is met, resulting in a well-founded
set of parameters. For the material model calibration a total of 35 modeling pa-
rameters per main supporting ambient temperature are identified. This includes,
among others, the parameters for the linear isotropic elasticity E and ν e , for the
extended Raghava isotropic yield function σ̄(σ) with non-associated parabolic flow
rule g(σ), for the analytical hardening law Rqs with non-linear rate-dependent term
kε̇ as well as parameters for the rate-dependent fracture strain ε̄f , depending on the
normalized Lode angle parameter θ̄ and the stress triaxiality η.

In a second step, the non-linear interpolation for the temperature-dependency is cal-
ibrated with additional UT tests at seven ambient temperatures between the main
supporting temperatures. From the additional UT tests alone, a majority of param-
eters are provided including the elastic modulus E, the non-linear plastic Poisson’s

                                          6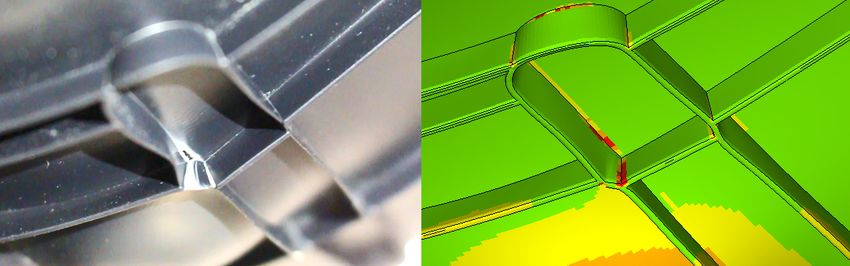
ratio ν p , the hardening function R and the equivalent fracture strain ε̄f in UT. The
remaining parameters, which are solely available at the main supporting tempera-
tures, are interpolated linearly.

                           Main supporting points                             Additional supporting points

  Temperatures            −35 ◦ C, 20 ◦ C, and 90 ◦ C                     −20 ◦ C, −5 ◦ C, 10 ◦ C, 30 ◦ C
                                                                           45 ◦ C, 60 ◦ C and 75 ◦ C

     Material
                                   HA                BT
 characterization

                        UT       UC                                                         UT
                                                     SH
                                              Yield/flow                  Elastic    Poisson’s ratio
                          σ̄(σ) σ̄vM                                         modulus
                                                                          E          νp

                          g(σ)
                                           δ γ
    Parameter                                        σm                                 T               εpvol

  identification      Hardening           Strain rate                     Hardening          Fracture strain
                      Rqs                  kε̇ hardening                  R                  ε̄f


                                                               ε̄˙p
                                     ε̄               ln       ε˙0                      εp              T

                      F                   F                                                      Experiment
                                                                          F                      Simulation
    Model/Test                                   UC
                              UT                                                   −35 ◦ C

    comparison                       s                    s                                   20 ◦ C
                      F                   F                                            UT              90 ◦ C
       and
                               BT,               SH
    validation                 HA
                                     s                    s                                             s

Figure 2: Review of the numerical model from [6]

                                                 7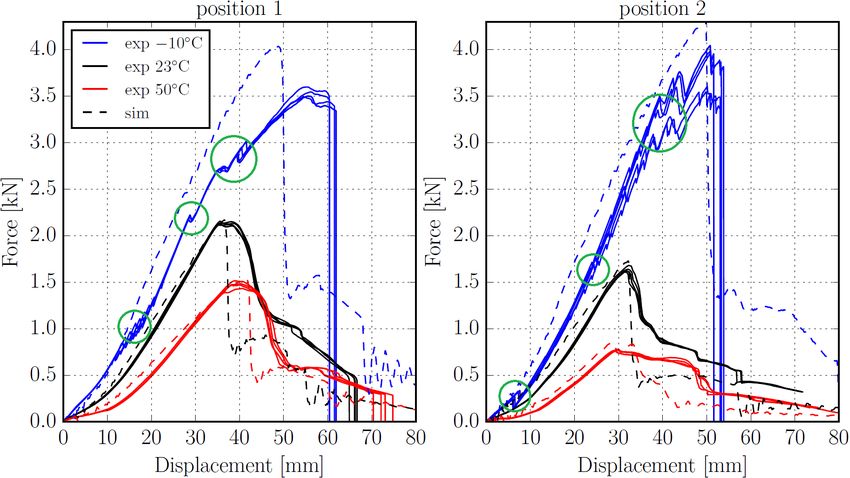
In the material model, the parameter FRAC is defined as maximum accumulated
damage of each finite element. The calculation of the fracture indicator is given in
Equation (1) with more details in [7]. An undamaged material has a FRAC-value of
0. At FRAC=1 fracture initiates, triggering element elimination in the FE-model.
                                               ∆ε̄p
                                      Z
                          FRAC =                                                (1)
                                        ε̄f η, θ̄, c1-4 , ε̄˙p

4. Experimental work

4.1. Overview
For the validation of the temperature-dependent material model, an idealized knee-
impact of a glove box flap, Figure 3a, is investigated. From this component, the
two highlighted cutouts, the glove box flap and the UT specimen, are extracted by
milling. The glove box flap cutouts are used for punch tests (PT). The shape of
this part is large enough to represent the component complexity while it is small
enough to fit into a temperature chamber during testing. The UT specimen is
extracted from an area with constant thickness and without reinforcing ribs. It is
taken from the component in order to check whether the material properties of the
components match the material behavior of UT specimens from the plates, which
were used for model calibration, Figure 3b. The temperature-dependent material
model was calibrated using UT specimens extracted from 2.3 mm thick plates with
a more than five times wider sprue gate than in the component. Both sprue gate
lengths are marked in Figure 3. The tested configurations are summarized in Table 6.

                                                                width of
                                                                sprue gate         99
                                                    17

glove box flap cutout
UT specimen cutout

                                              a)                                      b)
Figure 3: Extraction of a) cutouts and UT specimens out of a glove box flap and b) UT speci-
mens out of a plate used for material characterization

                                              8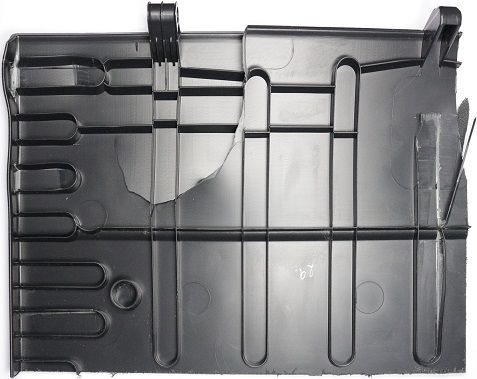
Table 6: Tested configurations

                        Test type       Label       Test velocity [mm s-1 ]     Temperature [◦ C]
                uni-axial tension        UT                     1.4             -35,   20,      90
                   punch test            PT                     1.0             -10,   23,      50

4.2. Uni-axial tension tests
For the tensile test component cutouts, the UT cubic spline specimen geometry
from [6] was used. The experimental results from the component UT cutouts as
well as from the calibration test from plates are given in engineering stress-strain
diagrams in Figure 4 for the main supporting temperatures.

             40
σeng [MPa]

             30
                               Simulation                                                            -35◦ C
             20                Experiment, components
             10                Experiment, plates
              0
              0.0               0.1             0.2             0.3           0.4         0.5
             20
σeng [MPa]

             15
                                                                                                     20◦ C
             10
              5
              0
              0.0               0.3           0.6              0.9            1.2        1.5
              8                                         εeng [-]
                6
   σeng [MPa]

                4                                                                                    90◦ C

                2
                0
                    0               3           6                  9          12          15
                                                        εeng [-]

Figure 4: Comparison of the simulation and the experimental data of the UT tests with speci-
mens from plates and from components

The elastic modulus, the yield stress as well as the hardening behavior from the com-
ponent UT cutouts are almost identical compared to the calibration tests with the
specimens from plates. However, the fracture strains of the component UT spec-
imens are significantly lower, even though the same specimen geometry, boundary
and loading conditions were applied as for the UT specimens from plates. Possible
reasons for the deviation in fracture strain are:

             • The component specimens have a pattern on one side, which could contribute

                                                            9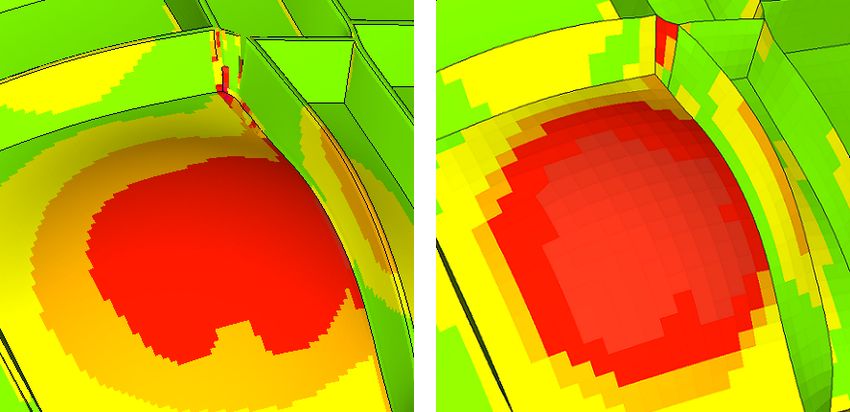
to an earlier crack initiation due to initial indentations, Figure 5. The speci-
      mens from plates were smooth on both sides.
   • The UT specimens from the component have a thickness of 2.9 mm compared
     to the 2.3 mm thick specimens from the plates. Therefore, the aforementioned
     skin-core effect could play a role, explaining the slightly lower strength in the
     component specimens.
   • The smaller sprue gate during the manufacturing of series components could
     lead potentially more damage for the polymer chains due to higher shear
     stresses in the manufacturing process.

Figure 5: Pattern of the UT specimen component cutout

4.3. Glove box flap component test
In Figure 6, the experimental set-up of the component test is shown. For clamping,
a custom holder was designed and built. It allows for the punch to penetrate the
component in a defined position while the fracture initiation and propagation is cap-
tured with an optical measurement system. The punch has a diameter of 60 mm and
is made from polytetrafluoroethylene (PTFE) to achieve low friction (
insertion element for holder
upper clamps
component
component holder
lower clamp
PTFE punch sleeve
steel punch core
z adapter for punch
insertion element for punch
x y
Figure 6: Experimental set-up of the validation tests
The tests were performed at either room temperature (RT), or for testing at el-
evated and low temperatures, inside a temperature chamber. RT is defined as
23 ◦ C. For the tests other than RT, the ambient temperature inside the chamber,
the temperature of the clamps and the specimen temperature were controlled and
recorded. Instead of measuring the actual specimen that was being tested, a dummy
specimen that was close to the tested specimen and that had been placed inside
the chamber for the same duration was measured. The ambient temperature, the
temperature of the tools and the (dummy) specimen temperature were within the
tolerance of ±2 ◦ C from the start until the end of the test. After heating/cooling
the temperature chamber to its target temperature, each individual specimen was
preheated/cooled inside the temperature chamber for a time period of 20 minutes
prior to testing.
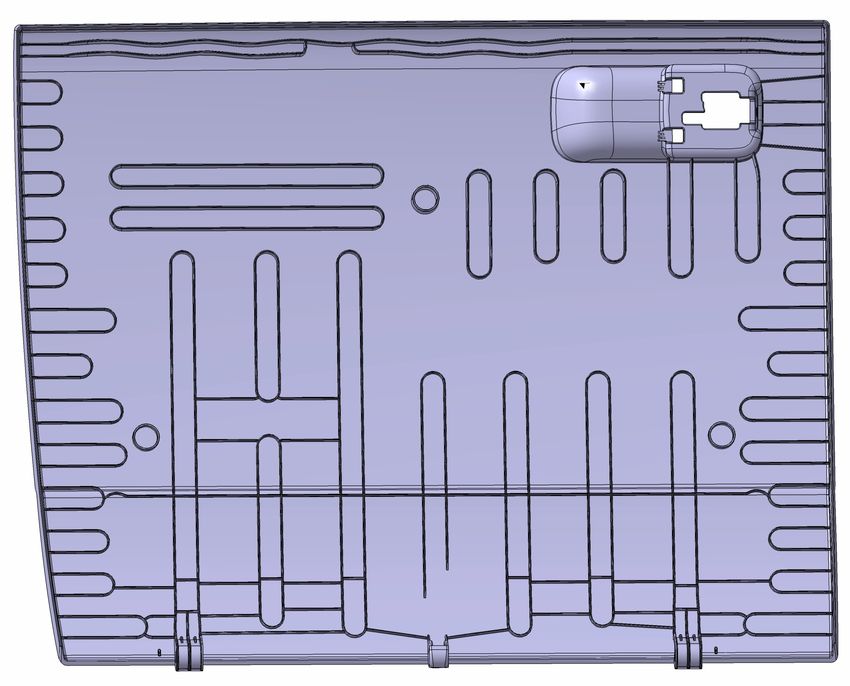
Two punch positions were investigated, as shown in Figure 7. It should be noted
that the punch is moving in positive z-direction, i.e. coming from the side that is
visible to the passenger. For position 2, the fracture initiation point is close to the
punch position. In comparison, for position 1, the fracture occurs further away from
the first contact point.
11z
fracture initiation point for position 1 y
x
position 1
x
position 2
x
fracture initiation point for position 2
Figure 7: Punch positions on the glove box flap component
FRAC: Max. accumulated damage [-]
0.0
0.1
0.2
0.3
0.4
0.5
0.6
0.7
0.8
0.9
1.0
a) b)
Figure 8: Slipping/rotation of clamping system
During the experiments, a tilt of the right clamp was observed, see Figure 8b. The
FE model is shown in Figure 8a, colors indicate the accumulated damage of each
element. The movement of the right clamp allowed the component to undergo
slightly greater deformation. In order to capture this phenomenon, the right clamp
in the FE model was given a rotational degree of freedom at the upper right corner,
where it is bolted to the upper plate of the holder. This allows the lower right
clamp to slip against the lower clamp and account for the slippage in the experi-
ments. The orange line marks the orientation of the right clamp in the undeformed
12state. The slight offset due to the slippage is visualized with the red line, marking
the orientation of the right clamp in the deformed state at the onset of fracture.
In Figure 9, the experimental results of the validation tests at −10 ◦ C, 23 ◦ C and
50 ◦ C are presented for punch positions 1 and 2. Generally, the force slope and the
maximum force increase at decreasing temperature while the fracture displacement
decreases. At −10 ◦ C, fracture occurs fairly early during the experiment at the
clamps, seen by the small drops in the force-displacement curve far before reaching
the force maximum. The intermediate drops in the blue force-displacement curves
(−10 ◦ C) marked with circles outline crack initiations in the experiments. As seen
from the damaged part from punch position 2, Figure 10, the early crack initiations
must have occured at the ribs next to the clamps, which broke off during the
experiment. Analogously, for punch position 1 at −10 ◦ C, the same rib broke,
causing the drops in the force-displacement curves. During the experiments at 23 ◦ C
and 50 ◦ C, the first fracture occurs at the central ribs as indicated in Figure 7, at the
force maximum. Overall, in both positions and at all three ambient temperatures,
a good test repeatability was achieved.
Figure 9: Force-displacement curves of the component tests and corresponding simulations for
both punch positions
13a) b) c)
Figure 10: Fracture at the ribs next to the clamps at −10 ◦ C for punch position 2
a) Broken rib on the right clamp
b) Damaged surface on the other side of a)
c) Material damage on the left clamp
In order to outline the crack growth during the RT tests with punch position 1, the
force-displacement curve is shown in Figure 11, indicating points where distinctive
fracture changes occur in the glove box flap during the test. The corresponding
fracture frames are shown in Figure 12. First, fracture occurs in point A, where
the inner edge of the rib starts to open. The crack propagates along the edge of
the diagonal rib, see point B. After the rib breaks completely, the crack quickly
grows along both directions perpendicular to the ribs. A force plateau is reached
after the crack is stopped at an additional rib, point C, before the second rib breaks
resulting in complete fracture, point D. For the other ambient temperature tests
with punch position 1 the first fracture occurs at the same location. In position 2,
initial fracture starts at the rib close to the punch position, Figure 7, for all three
ambient temperatures, growing further along the longitudinal rib. An overview
on the different fracture progressions at the two impact positions at the ambient
temperatures −10 ◦ C, 23 ◦ C and 50 ◦ C is given in Figure 13.
142.5
exp 23◦C A B
2.0
1.5
Force [kN]
C
1.0
0.5 D
0.0
0 10 20 30 40 50 60 70
Displacement [mm]
Figure 11: Force-displacement curve of the component test with punch position 1 at 23 ◦ C
A
z z
B
x y
y
x
D
C
z z
y y
x x
Figure 12: Fracture propagation of the component test with punch position 1 at 23 ◦ C
15Position 1
T = −10◦ C T = 23◦ C T = 90◦ C
Position 2
T = −10◦ C T = 23◦ C T = 90◦ C
Figure 13: Crack patterns in the test series of the component for both punch positions at the
ambient temperatures −10 ◦ C, 23 ◦ C and 50 ◦ C
5. Model validation
In the simulation model, a fine volume discretization of 0.5 mm was used, leading
to 1.2 million volume elements for the glove box flap component. The FE model
is composed of (mostly) hexahedral elements, where at least 3 elements over the
thickness have been used, see Figure 14. The force-displacement curves from the
experiments and simulations are compared as well as the crack paths. Therefore,
the contact force at the punch and the punch displacement are measured in the
simulation model.
z z
y y x
x
Figure 14: FE volume element simulation model
165.1. UT test
As mentioned in Section 4, the fracture properties (i.e. the fracture strains) of
the component differ from what was found in the plates used for material model
calibration. To account for the smaller fracture strains in the components, a scaling
factor ff is introduced in the numerical simulations. The purpose of this parameter is
to scale down the achievable fracture strain ε̄f,scaled of the elements in order to reach
a FRAC-value of 1.0 at the point where the UT tests of the specimens extracted
from components fracture, see Figure 4:
ε̄f,scaled = ff ε̄f (2)
All other parameters of the material model (elasticity, plasticity, hardening, soften-
ing, etc.) are not influenced by this measure. This way, the simulation model curves
originally representing the fracture behavior from plates can be adjusted to now rep-
resent the component behavior. The UT specimens extracted from the component
were tested at the same main supporting temperatures as used for model calibration.
Therefore, the scaling factor ff can be easily determined for these temperatures, see
Table 7. For 20 ◦ C, the difference in fracture strain between the component and
the plates is over 50%. As outlined by the thickness sensitivity study in Section 2, a
majority of this loss happens due to the thickness effect. The remaining difference
could be explained by the pattern of the component specimens and the difference
in sprue gate areas. For the other ambient temperatures, −35 ◦ C and 90 ◦ C, the
thickness influence is significantly smaller, indicating that the properties of the skin
and the core have more closely converged.
Table 7: Scaling factors for main supporting ambient temperatures
Temperature T −35 ◦ C 20 ◦ C 90 ◦ C
Scaling factor ff 0.80 0.45 0.80
5.2. Glove box flap component test
In Figure 15, the initial fracture in the component experiment at 23 ◦ C is shown
for punch position 1, compared to the simulation model after 15 mm punch dis-
placement. At this point, first fracture occurs in the experiments. At the same
time, the first elements in the simulation have reached a FRAC-value of 1.0 in the
rib and were eliminated from the simulation. Even though the punch penetrates
the component at a position away from the rib, see Figure 7, first fracture occurs
in the rib. This is well captured by the material model when using a fine volume
discretization. At the other ambient temperatures −10 ◦ C and 50 ◦ C initial fracture
occurs at the same rib.
17FRAC: Max. accumulated damage [-]
0.0
0.1
0.2
0.3 FRAC=
0.4 0.94
0.5
0.6
0.7
0.8
0.9
1.0 FRAC=1.00
a) b)
Figure 15: Comparison of initial fracture in the component experiment (a) and the simulation
(b) at position 1 and 23 ◦ C
For punch position 2, the onset of fracture is shown in Figure 16 for the exper-
iments and simulations at −10 ◦ C. The initial fracture location is well predicted
by the simulation. Again, fracture is initiated in a rib. From there, the initial
crack starts growing parallel to the rib until global fracture for all three ambient
temperatures −10 ◦ C, 23 ◦ C and 50 ◦ C. Simulation and experiment correlate well
with regard to initial fracture, but also fracture propagation. However, in order to
capture the post-fracture behavior precisely, an additional model is required. This
can be seen in the deviation of experiment and simulation in Figure 9 after the force
maximum has been reached.
FRAC: Max. accumulated damage [-]
0.0
0.1
0.2 FRAC=0.83
0.3
0.4
0.5
0.6 FRAC=1.00
0.7
0.8
0.9
1.0
a) b)
Figure 16: Comparison of initial fracture in the component experiment (a) and the simulation
(b) at punch position 2 and −10 ◦ C
5.3. Shell vs. volume discretization
In Figure 17, the 0.5 mm volume element discretization is compared to the ele-
mentation using 2 mm shell elements. Even with the coarse shell elementation, the
fracture location in the rib is detected as critical, however, because the strains are
18not localizing enough in the sharp edge, the first cracks occur at the position close
to the punch, rather than in the edge as in the experiment. A finer shell element
size may help to identify the rib as position of initial fracture.
FRAC: Max. accumulated damage [-]
0.0
0.1
0.2 FRAC=1.00 FRAC=0.92
0.3
0.4
0.5
0.6
0.7
0.8
0.9
1.0
FRAC=0.87 FRAC=0.99
a) b)
Figure 17: Comparison of 0.5 mm volume (a) and 2.0 mm shell (b) discretization, punch position
1 at 23 ◦ C
6. Conclusions and recommendations
In this work, the temperature-dependent material model proposed in [6] is validated
using glove box flap component punch tests. Therefore, a custom holder was de-
signed and built. In the experiments, two punch positions at three different ambient
temperatures were investigated.
In order to verify the material properties of the component, UT specimens were
extracted and compared to specimens milled from plates, which were used for the
material model calibration. The preliminary UT tests outlined that the component
UT specimens show a smaller fracture displacement than the UT specimens from
plates, varying with ambient temperature. The smaller fracture displacement is ac-
counted for in the simulation model by introducing a scaling factor for the fracture
strain applied for all elements in the initial state. This way, the simulation model
curves originally representing the material behavior from plates can be adjusted to
represent the component behavior. With this consideration, the material model
captures the stiffness, the hardening, the force-maximum and the fracture strain
for all ambient temperature component experiments with very good accuracy. For
−10 ◦ C, cracks occur at the clamps shortly after loading, however, they do not
change the global fracture behavior. Generally, the temperature-dependent mate-
rial model proves to be a good model to represent the material behavior of series
production components.
19With shell elements of 2 mm element length or greater, the stresses in sharp edges
may be underestimated. When using fine volume discretization, the material model
captures the material behavior even at sharp edges with high notch stresses. It is
then possible to predict the behavior up to the point of initial fracture.
References
References
[1] H. A. Maddah, Polypropylene as a promising plastic: A review, in: American
Journal of Polymer Science, Vol. 6 of 1, Scientific & Academic Publishing,
2016, pp. 1–11.
[2] I. H. Hall, The effect of strain rate on the stress-strain curve of oriented poly-
mers. I. presentation of experimental results, in: Journal of Applied Polymer
Science, Vol. 12 of 4, 1968, pp. 731–738.
[3] M. C. Boyce, D. M. Parks, A. S. Argon, Plastic flow in oriented glassy polymers,
in: International Journal of Plasticity, Vol. 5 of 6, Elsevier, 1989, pp. 593–615.
[4] P. G. Santangelo, K. L. Ngai, C. M. Roland, Temperature dependence of relax-
ation in polypropylene and poly(ethylene-co-propylene), in: Macromolecules,
Vol. 29 of 10, American Chemical Society, 1996, pp. 3651–3653.
[5] Y. Zhou, P. Mallick, Effects of temperature and strain rate on the tensile be-
havior of unfilled and talc-filled polypropylene. part I: Experiments, in: Polymer
Engineering and Science, Vol. 42 of 12, 2002, pp. 2449–2460.
[6] D. Degenhardt, L. Greve, M. Andres, T. Eller, J. Copik, P. Horst, Temperature-
dependent elasto-viscoplastic deformation and fracture model for a talcum-
filled PP/PE co-polymer (submitted paper), in: International Journal of Plas-
ticity, Elsevier, 2019.
[7] L. Greve, D. Degenhardt, T. Eller, Charakterisierung, Modellierung und
Parametrierung von unverstärkten Polymeren für die Crashsimulation (Char-
acterization, modeling and parameterization of unstiffened polymers for crash
simulation (in German)), in: International VDI Conference PIAE, Mannheim,
2018.
[8] L. Greve, C. Fehrenbach, Mechanical testing and macro mechanical finite el-
ement simulation of the deformation, fracture, and short circuit initiation of
cylindrical lithium ion battery cells, in: Journal of Power Sources, Vol. 214,
2012, pp. 377–385.
[9] T. Eller, L. Greve, M. Andres, M. Medricky, A. Hatscher, V. Meinders, A. H.
van den Boogaard, Plasticity and fracture modeling of quench-hardenable
boron steel with tailored properties, 6th Edition, Vol. 214, Journal of Materials
Processing Technology, 2014, pp. 1211–1227.
20[10] L. Greve, G. Krabbenborg, T. Eller, M. Andres, B. Geijselaers, Characterization
and modeling of the deformation and fracture behavior of an aluminum sheet
alloy depending on the state of bake hardening and pre-strain, in: 35th IDDRG
Conference, Linz, 2016.
[11] T. Eller, K. Ramaker, L. Greve, M. Andres, J. Hazrati, A. van den Boogaard,
Plasticity and fracture modeling of three-layer steel composite Tribond 1200
for crash simulation, in: 36th IDDRG Conference, Munich, 2017.
[12] V. P. Solution, Engineering systems international (2017).
[13] O. Ammar, Y. Bouaziz, N. Haddar, N. Mnif, Talc as reinforcing filler in
polypropylene compounds: Effect on morphology and mechanical properties,
in: Polymer Sciences, Vol. 3 of 18, 2017.
[14] E. Hnatkova, Z. Dvorak, Effect of the skin-core morphology on the mechan-
ical properties of injection-moulded parts, in: Materials and technology, 2nd
Edition, Vol. 50, Institute of Metals and Technology, 2016, pp. 195–198.
[15] M. R. Kantz, H. D. Newman, F. H. Stigale, The skin-core morphology and
structure-property relationships in injection-molded polypropylene, in: Journal
of Applied Polymer Science, 5th Edition, Vol. 16, Wiley, 1972, pp. 1249–1260.
[16] F. Altendorfer, S. Seitl, Laminated structure of moulded parts from partly
crystalline polypropylene, in: Kunststoffe, 76, International Polymer Science
and Technology, 1986, p. 47.
[17] J. Karger-Kocsis, K. Friedrich, Effect of skin-core morphology on fatigue crack
propagation in injection moulded polypropylene homopolymer, in: International
Journal of Fatique, Vol. 11, Elsevier, 1989, pp. 161–168.
[18] V. Hasek, Untersuchung und theoretische Beschreibung wichtiger Einflugrößen
auf das Grenzformänderungsschaubild (Research and theoretical description
concerning the influences on the FLDs (in German)), in: Blech Rohre Profile,
Vol. 25, 1978, pp. 213–220.
[19] J. S. Walker, Physics, 5th Edition, Pearson Education, New Jersey, 2016.
21You can also read