Using a Convolutional Neural Network and Convolutional Long Short-term Memory to Automatically Detect Aneurysms on 2D Digital Subtraction ...
←
→
Page content transcription
If your browser does not render page correctly, please read the page content below

JMIR MEDICAL INFORMATICS                                                                                                                   Liao et al

     Original Paper

     Using a Convolutional Neural Network and Convolutional Long
     Short-term Memory to Automatically Detect Aneurysms on 2D
     Digital Subtraction Angiography Images: Framework Development
     and Validation

     JunHua Liao1,2*, BSc; LunXin Liu1*, MD; HaiHan Duan3, MSc; YunZhi Huang4, PhD; LiangXue Zhou1, MD; LiangYin
     Chen2, PhD; ChaoHua Wang1, MD
     1
      Department of Neurosurgery, West China Hospital, Sichuan University, Chengdu, China
     2
      College of Computer Science, Sichuan University, Chengdu, China
     3
      School of Science and Engineering, The Chinese University of Hong Kong, Shenzhen, China
     4
      School of Automation, Nanjing University of Information Science and Technology, Nanjing, China
     *
      these authors contributed equally

     Corresponding Author:
     ChaoHua Wang, MD
     Department of Neurosurgery
     West China Hospital
     Sichuan University
     No. 37 Guoxue Lane, Wuhou District
     Chengdu, 610041
     China
     Phone: 86 18628169123
     Email: wangchaohuaHX@163.com

     Abstract
     Background: It is hard to distinguish cerebral aneurysms from overlapping vessels in 2D digital subtraction angiography (DSA)
     images due to these images’ lack of spatial information.
     Objective: The aims of this study were to (1) construct a deep learning diagnostic system to improve the ability to detect posterior
     communicating artery aneurysms on 2D DSA images and (2) validate the efficiency of the deep learning diagnostic system in
     2D DSA aneurysm detection.
     Methods: We proposed a 2-stage detection system. First, we established the region localization stage to automatically locate
     specific detection regions of raw 2D DSA sequences. Second, in the intracranial aneurysm detection stage, we constructed a
     bi-input+RetinaNet+convolutional long short-term memory (C-LSTM) framework to compare its performance for aneurysm
     detection with that of 3 existing frameworks. Each of the frameworks had a 5-fold cross-validation scheme. The receiver operating
     characteristic curve, the area under the curve (AUC) value, mean average precision, sensitivity, specificity, and accuracy were
     used to assess the abilities of different frameworks.
     Results: A total of 255 patients with posterior communicating artery aneurysms and 20 patients without aneurysms were included
     in this study. The best AUC values of the RetinaNet, RetinaNet+C-LSTM, bi-input+RetinaNet, and bi-input+RetinaNet+C-LSTM
     frameworks were 0.95, 0.96, 0.92, and 0.97, respectively. The mean sensitivities of the RetinaNet, RetinaNet+C-LSTM,
     bi-input+RetinaNet, and bi-input+RetinaNet+C-LSTM frameworks and human experts were 89% (range 67.02%-98.43%), 88%
     (range 65.76%-98.06%), 87% (range 64.53%-97.66%), 89% (range 67.02%-98.43%), and 90% (range 68.30%-98.77%),
     respectively. The mean specificities of the RetinaNet, RetinaNet+C-LSTM, bi-input+RetinaNet, and bi-input+RetinaNet+C-LSTM
     frameworks and human experts were 80% (range 56.34%-94.27%), 89% (range 67.02%-98.43%), 86% (range 63.31%-97.24%),
     93% (range 72.30%-99.56%), and 90% (range 68.30%-98.77%), respectively. The mean accuracies of the RetinaNet,
     RetinaNet+C-LSTM, bi-input+RetinaNet, and bi-input+RetinaNet+C-LSTM frameworks and human experts were 84.50% (range
     69.57%-93.97%), 88.50% (range 74.44%-96.39%), 86.50% (range 71.97%-95.22%), 91% (range 77.63%-97.72%), and 90%
     (range 76.34%-97.21%), respectively.

     https://medinform.jmir.org/2022/3/e28880                                                          JMIR Med Inform 2022 | vol. 10 | iss. 3 | e28880 | p. 1
                                                                                                                   (page number not for citation purposes)
XSL• FO
RenderX
JMIR MEDICAL INFORMATICS                                                                                                               Liao et al

     Conclusions: According to our results, more spatial and temporal information can help improve the performance of the
     frameworks. Therefore, the bi-input+RetinaNet+C-LSTM framework had the best performance when compared to that of the
     other frameworks. Our study demonstrates that our system can assist physicians in detecting intracranial aneurysms on 2D DSA
     images.

     (JMIR Med Inform 2022;10(3):e28880) doi: 10.2196/28880

     KEYWORDS
     convolutional neural network; convolutional long short-term memory; cerebral aneurysm; deep learning

                                                                          C-LSTM networks can perform pattern recognition analyses
     Introduction                                                         on medical time series data and have obtained high accuracies
     The prevalence of cerebral aneurysms in the general population       in the classification of medical signals [11,12].
     is approximately 2% to 3% [1]. When an intracranial aneurysm         Recent studies have used deep learning methods for detecting
     ruptures, it may bleed into the brain parenchyma, causing a          cerebral aneurysms in 2D DSA images, but these works have
     hemorrhage of the cerebral parenchyma, or, more commonly,            some limitations. Podgoršak et al [13] modified the Visual
     it bleeds into the subarachnoid space and causes a subarachnoid      Geometry Group network—a network used for
     hemorrhage (SAH). An SAH is a catastrophic event with a              classification—into a network suitable for semantic
     mortality rate of 25% to 50%. Nearly 50% of SAH survivors            segmentation tasks for detecting aneurysms. The data set of
     have permanent disabilities; only approximately one-third of         their study was composed of positive case data for aneurysms,
     patients with SAH have good prognoses [2,3]. Hence, it is            and its false-positive rate has not been evaluated. Jin et al [14]
     crucial to detect and treat aneurysms as early as possible. The      used a bidirectional C-LSTM network to segment aneurysms;
     gold standard for diagnosing cerebral aneurysms is digital           although the network’s patient-level sensitivity was 97.7%, the
     subtraction angiography (DSA). The application of 3D DSA             average number of false positives per sequence was as high as
     has dramatically improved the diagnostic accuracy for                3.77. Liao et al [15] used a C-LSTM network to extract time
     aneurysms. However, as many hospitals lack the technical and         information when detecting aneurysms but did not consider the
     reconstitution equipment for 3D DSA, especially in low-income        relationships among DSA images from different aspects of the
     countries, radiologists in these hospitals have to diagnose          same patient. Duan et al [16] combined frontal and lateral DSA
     cerebral aneurysms by using 2D DSA images. Unlike 3D                 images for detection but did not use the timing information of
     images, 2D DSA images lack spatial information, and it is            the DSA sequence. This method requires an additional
     difficult for radiologists to distinguish aneurysms from             false-positive correction algorithm for correcting the results.
     overlapping vessels in 2D DSA images. Therefore, the                 Therefore, the existing deep learning–based aneurysm detection
     assessment of these 2D DSA images is usually subjective and          methods still need to be improved.
     may be influenced by the experience of radiologists.
                                                                          To solve the aforementioned problems, we combined a CNN
     In recent years, image recognition via deep learning for             for acquiring spatial information and a C-LSTM network for
     diagnostic imaging has achieved good performance in various          learning temporal information to detect aneurysms in 2D DSA
     medical fields, such as skin cancer, retinopathy, pneumonia,         images.
     and gastric cancer [4]. Deep learning represents a new machine
     learning method that enables a machine to analyze various            Posterior communicating artery (PCoA) aneurysms are one of
     training images, so that it can extract specific clinical features   the most common aneurysms encountered by neurosurgeons
     [5]. Based on the cumulative clinical features, a machine can        and neurointerventional radiologists and are the second most
     prediagnose newly acquired clinical images.                          common aneurysms overall (25% of all aneurysms), representing
                                                                          50% of all internal carotid artery (ICA) aneurysms [17]. Hence,
     A convolutional neural network (CNN) is a type of deep learning      to solve the problem of data deficiency, we focused on PCoA
     model for processing data that have a grid pattern, such as          aneurysms to (1) construct a deep learning diagnostic system
     images. CNNs were inspired by the organization of the animal         to improve the ability to detect PCoA aneurysms on 2D DSA
     visual cortex [6,7] and designed to automatically and adaptively     images and (2) validate the efficiency of the deep learning
     learn spatial hierarchies of characteristics from low- to            diagnostic system in 2D DSA aneurysm detection.
     high-level pictures. CNNs have achieved good performance in
     several medical fields, such as lesion detection [8] and             This deep learning diagnostic system includes a region
     classification [9].                                                  localization stage (RLS) and an intracranial aneurysm detection
                                                                          stage (IADS). The RLS is used to automatically locate a specific
     Convolutional long short-term memory (C-LSTM) networks               detection area, and in the IADS, the system conducts aneurysm
     [10] have advantages over feedforward neural networks, as they       detection for the area images outputted in the RLS. The
     can discover the hidden structures of medical time signals.          cascading framework flowchart is shown in Figure 1.

     https://medinform.jmir.org/2022/3/e28880                                                      JMIR Med Inform 2022 | vol. 10 | iss. 3 | e28880 | p. 2
                                                                                                               (page number not for citation purposes)
XSL• FO
RenderX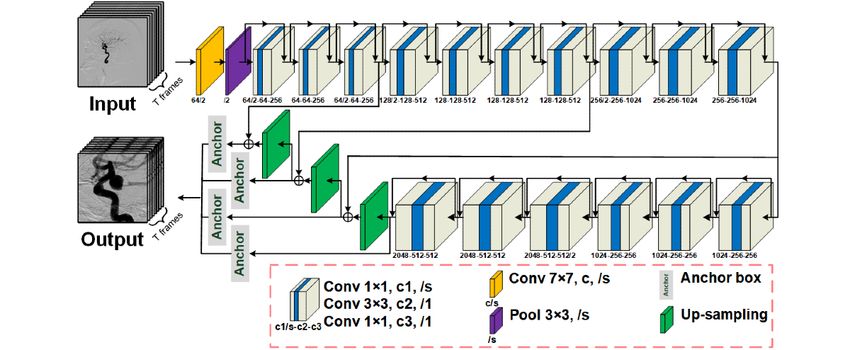
JMIR MEDICAL INFORMATICS                                                                                                                         Liao et al

     Figure 1. The flowchart of the deep learning diagnostic system. “Xit” represents the tth frame in the digital subtraction angiography sequence of the
     ith patient. C-LSTM: convolutional long short-term memory; FPN: feature pyramid network; IADS: intracranial aneurysm detection stage; ResNet:
     residual deep neural network; RLS: region localization stage.

     The main contributions of this paper can be summarized as                   frontal DSA images; (2) patients with arteriovenous
     follows. First, the bi-input network framework of the IADS                  malformations, arteriovenous fistulas, or moyamoya disease;
     increases the amount of information and then combines                       (3) patients with treated aneurysms; and (4) patients with
     spatial-temporal information through feature pyramid networks               aneurysms in other locations.
     (FPNs) [18], with a residual deep neural network (ResNet) [19]
                                                                                 The obtained images were in DICOM format, which requires
     and bidirectional C-LSTM network acting as the backbone.
                                                                                 a large memory space. To decrease the computational load and
     This greatly improves the accuracy and efficiency of aneurysm
                                                                                 improve usability, we converted the images to PNG format in
     detection. Second, our proposed method can achieve low
                                                                                 model training and testing.
     false-positive rates without the need for a false-positive
     correction algorithm.                                                       Two experienced radiologists identified 6 to 12 frameworks for
                                                                                 2D DSA images, which provided sufficient visualization of the
     Methods                                                                     PCoA region. Manual annotations were performed for the
                                                                                 identification of aneurysms, vessel overlaps, and PCoA regions.
     Ethics Approval                                                             To augment the training data, each image was rotated randomly
     This retrospective study was approved (number 20220310005)                  between 0° and 359°. The data set was divided into the following
     by the institutional review board of West China Hospital,                   three parts: the training set, validation set, and test set. The
     Sichuan University, Chengdu, China, with a waiver of written                training set was used to train the algorithm, the validation set
     informed consent.                                                           was used for model selection, and the test set was used for the
                                                                                 assessment of the final chosen model. To obtain a reliable and
     Study Design                                                                stable model, this study adopted 5-fold cross-validation, during
     A total of 586 patients who underwent DSA examination and                   which the data set was divided into 5 parts; 4 parts were used
     had identified PCoA aneurysms from January 2014 to December                 for training and 1 part was used for validation. The mean value
     2019 in West China Hospital were included in this study. All                of the 5 results was used as the algorithm accuracy. The
     of the PCoA aneurysms were double confirmed via 3D DSA.                     advantage of cross-validation is that it can make full use of
     The main inclusion criterion stipulated that patients were                  limited data to find suitable model parameters and prevent
     diagnosed with PCoA aneurysms via DSA. The exclusion                        overfitting. Raw 2D DSA images usually have large resolutions.
     criteria consisted of the following: (1) patients lacking lateral           Initially, the detection of intracranial aneurysms was based on
                                                                                 original 2D DSA images, and the large resolution of the original
     https://medinform.jmir.org/2022/3/e28880                                                                JMIR Med Inform 2022 | vol. 10 | iss. 3 | e28880 | p. 3
                                                                                                                         (page number not for citation purposes)
XSL• FO
RenderX
JMIR MEDICAL INFORMATICS                                                                                                                           Liao et al

     2D DSA images resulted in extra time consumption and                         sequence as input. The ResNet-50–based [19] FPN sends the
     interference. Specifically, researchers have attempted to avoid              features extracted from each frame to anchor boxes [20] to
     large resolution–related problems by manually locating detection             predict the PCoA region. The detector outputs 6n parameters
     areas requiring considerable amounts of work. In our case, we                in which “6” represents the bounding box’s x-coordinate,
     used the RLS to automatically locate specific detection regions              y-coordinate, width, height, classification label, and confidence
     of raw 2D DSA sequences, as shown in Figure 2. This method                   for classification and “n” refers to the n objects detected in the
     can be used to reduce the interference in aneurysm detection.                RLS. The bounding box with the highest prediction confidence
     In theory, region localization can be performed to locate any                was applied to other frameworks in the DSA sequence, and it
     ICA region, but we could only prove the feasibility of using the             outputted the PCoA region sequence. Moreover, to connect with
     RLS to identify PCoA regions due to the limitations of the data              the IADS, each frame of the output sequence was resized to
     set. As shown in Figure 2, this architecture uses a raw 2D DSA               288×288 pixels during the RLS.
     Figure 2. The network architecture of the RLS. “Conv f×f, c, /s” represents a 2D convolutional layer with a kernel size of f×f, a c number of channels,
     and an s number of strides, which is defaulted to 1. “Pool f×f, /s” denotes the maximum pooling layer, which has a filter size of f and an s number of
     strides. The “anchor” is used to predict the PCoA region, and “up-sampling” refers to nearest neighbor up-sampling with an up-sampling rate of 2.
     PCoA: posterior communicating artery; RLS: region localization stage.

     ResNet was the winner of the 2015 ImageNet Large Scale Visual                Detecting objects at different scales, particularly small objects,
     Recognition Challenge for image classification [19]. It has                  is challenging. FPNs combine low-resolution, semantically
     several advantages over traditional CNNs, as follows: (1) it                 strong features with high-resolution, semantically weak features
     accelerates the training speed of deep networks; (2) instead of              via a top-down pathway and lateral connections. FPNs have
     widening the network, it increases the depth of the network,                 rich semantics at all levels and are built quickly from a
     resulting in fewer extra parameters; (3) the residual block inside           single-input image scale without sacrificing representational
     ResNet uses jump connections to alleviate the problem of                     power, speed, or memory [18].
     gradient disappearance resulting from the increase in the depth
                                                                                  Object detection algorithms have 2 classic structures—1-stage
     of the deep neural network; and (4) it achieves higher accuracy
                                                                                  and 2-stage algorithms. Compared to the 1-stage algorithm, the
     in network performance, especially in image classification [19].
                                                                                  2-stage algorithm has 1 more step for solving the problem of
     Due to the excellent performance of ResNet, it has been widely
                                                                                  class imbalance. Therefore, the 2-stage algorithm is more
     used in various medical imaging tasks [21-23].
                                                                                  time-consuming. Lin et al [25] constructed RetinaNet by
     C-LSTM is a variant of long short-term memory (LSTM) that                    combining ResNet, FPNs, and fully convolutional networks
     has a convolution operation inside of the LSTM cell. Both                    [26]. The RetinaNet algorithm solves the problem of class
     models are special kinds of recurrent neural networks that are               imbalance by using the focal loss function instead of the
     capable of learning long-term dependencies. The main difference              proposal extraction step, thereby greatly improving the detection
     between C-LSTM and LSTM is the number of input dimensions.                   speed with high accuracy. Because of the excellent performance
     Using LSTM to process image sequences with temporal                          of RetinaNet, it is widely used in object detection tasks involving
     information requires converting 3D data to 2D data, which                    medical images [27-29].
     inevitably results in the loss of information. C-LSTM networks
                                                                                  We compared the following three structures in the IADS: (1)
     inherit the advantages of traditional LSTM networks and are
                                                                                  RetinaNet [25], which uses single-frame images as input; (2)
     very suitable for the analysis of spatiotemporal data due to their
                                                                                  RetinaNet+C-LSTM [15], which is based on RetinaNet and
     internal convolution structure. Therefore, many studies use
                                                                                  uses C-LSTM to extract bidirectional time information and take
     C-LSTM to process medical image sequences [11,12,24].
                                                                                  frontal or lateral DSA sequences as input; and (3)

     https://medinform.jmir.org/2022/3/e28880                                                                  JMIR Med Inform 2022 | vol. 10 | iss. 3 | e28880 | p. 4
                                                                                                                           (page number not for citation purposes)
XSL• FO
RenderX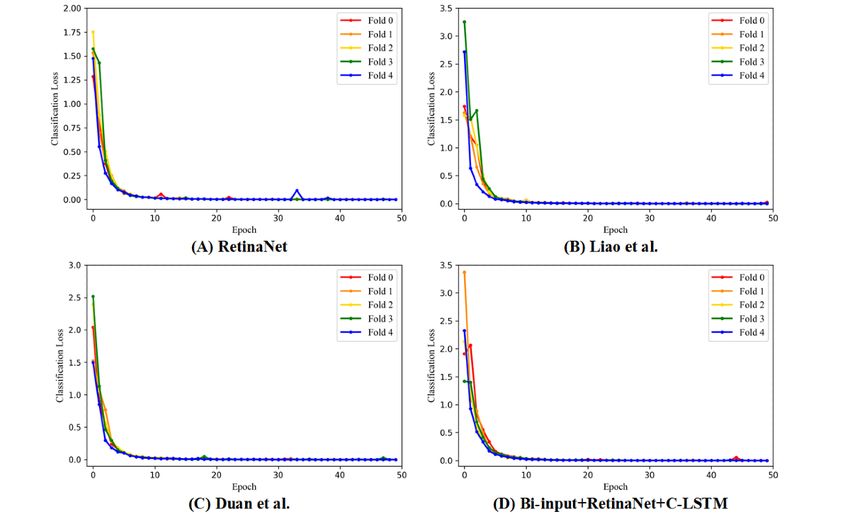
JMIR MEDICAL INFORMATICS                                                                                                                           Liao et al

     bi-input+RetinaNet [16], which combines frontal and lateral                  channels, respectively. It should be noted that the number of
     DSA sequences together as input.                                             channels in the C-LSTM network was set as half of the input.
                                                                                  After extracting the temporal information, we concatenated the
     As shown in Figure 3, the target sequence of the PCoA region
                                                                                  features of the forward C-LSTM network and the reverse
     and its corresponding frontal or lateral sequence were
                                                                                  C-LSTM network and sent them to the FPN for further
     concatenated as a 6-channel image sequence in which the target
                                                                                  extraction. Anchor boxes identified intracranial aneurysms and
     sequence occupies the first 3 channels. ResNet-50 extracted
                                                                                  overlapping blood vessels based on the features extracted by
     individual spatial features from each 6-channel frame in the
                                                                                  the FPN. To make the detection results more reliable, the
     input sequence. In total, 3 feature layers were selected for
                                                                                  detector only outputted the predicted objects with a confidence
     temporal feature extraction by using bidirectional C-LSTM,
                                                                                  level of >0.6.
     namely C3, C4, and C5, which had 512, 1024, and 2048
     Figure 3. The network architecture of the IADS. “Xit” represents the tth frame in the DSA sequence of the ith patient. “Conv: f×f, /s” represents a
     convolutional layer with a kernel size of f×f and an s number of strides, where s is defaulted to 1. The channel of the convolutional layer defaults to
     256. “C3,” “C4,” and “C5” represent the 3-layer features of ResNet-50. “Up-sample” refers to nearest neighbor up-sampling with an up-sampling rate
     of 2. The “anchor” denotes the anchor box, which uses the features to output the detection result. C-LSTM: convolutional long short-term memory;
     Conv 2D: 2D convolution; DSA: digital subtraction angiography; FPN: feature pyramid network; IADS: intracranial aneurysm detection stage; ResNet:
     residual deep neural network.

     All models were trained and tested with a Keras [30] deep                    of a serious imbalance in the ratio of positive to negative
     learning framework on an NVIDIA GTX 1080Ti graphics                          samples in object detection tasks. The focal loss was defined
     processing unit (11GB GDDR5X; NVIDIA Corporation). We                        as follows:
     used the data in the training set to train the region localization
     and intracranial aneurysm detection algorithms, and the initial
     learning rate of each step in the training process was set to
                                                                                  where “FL” denotes focal loss, “α” denotes the balanced
     3×10⁻⁶ for the RLS and 1×10⁻⁴ for the IADS. The Adam                         parameter used to balance the proportional inequality of positive
     optimization method [31] was adopted, and the learning rate                  and negative samples, “γ” denotes the downweighted rate, “p”
     was dynamically adjusted with the training progress. If the                  represents prediction confidence, and “y {±1}” is the ground
     variation in the range of loss in 2 consecutive epochs was less              truth class. When γ was >0, the loss function reduced the loss
     than 1×10⁻⁴, then the learning rate was reduced by a factor of               of easy-to-classify samples and thus focused more on difficult
     10. This method achieved the local optimum of the training                   and misclassified samples. Specifically, we used an α of .25
     process.                                                                     and a γ of 2.0 in the training process.
     The loss function for object classification used focal loss [25].            Smooth L1 loss [25] was used as the loss function for bounding
     This loss function reduced the weight of the large number of                 box regression. As a commonly used loss function in regression
     simple negative samples in training, thereby solving the problem             tasks, smooth L1 loss can limit the gradient value from the

     https://medinform.jmir.org/2022/3/e28880                                                                  JMIR Med Inform 2022 | vol. 10 | iss. 3 | e28880 | p. 5
                                                                                                                           (page number not for citation purposes)
XSL• FO
RenderX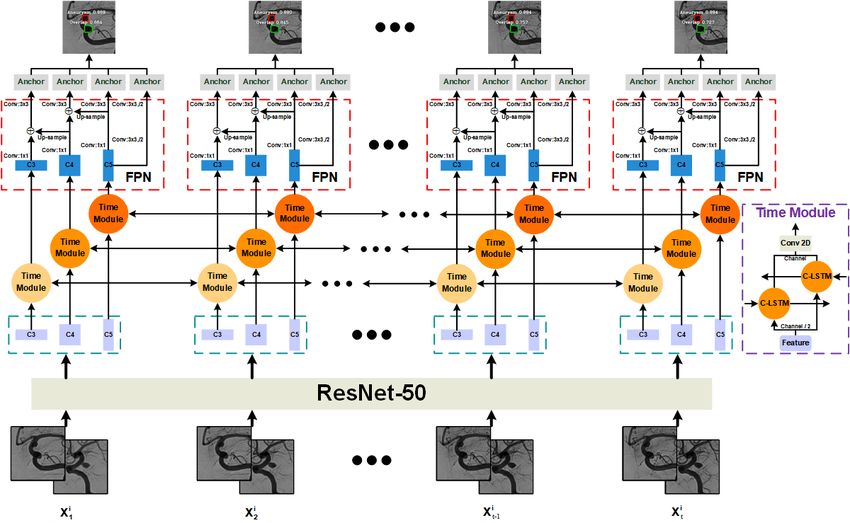
JMIR MEDICAL INFORMATICS                                                                                                             Liao et al

     following two aspects to prevent training failure: (1) when the     this method accurately located the PCoA regions from the
     difference between the predicted value and the ground truth was     original DSA images.
     too large, the gradient value was not too large, and (2) when
                                                                         Of the 275 patients included in this study, 255 had PCoA
     the predicted value was very close to the ground truth, the
                                                                         aneurysms, and 20 did not have aneurysms. A flowchart of the
     gradient value was small enough. This loss function was defined
                                                                         enrolled patients is shown in Figure 4.
     as follows:
                                                                         The AUC values and the ROC curves of RetinaNet [25], Liao
                                                                         et al [15], Duan et al [16], and the bi-input+RetinaNet+C-LSTM
     in which                                                            framework are shown in Figure 5. The focal loss and the smooth
                                                                         L1 loss also showed that the aforementioned frameworks had
                                                                         sufficient convergence (Figures 6 and 7). Compared to the
                                                                         average AUC values of RetinaNet [25] (0.920), Liao et al [15]
                                                                         (0.920) and Duan et al [16] (0.916), the
     where “SL” denotes smooth L1 loss, “t” denotes the bounding
                                                                         bi-input+RetinaNet+C-LSTM framework had the largest average
     box of the predicted object, “v” represents the bounding box of
                                                                         AUC value (0.936). The 5-fold cross-validation mAP values of
     the ground truth, and “σ” is the weighted factor. A σ of 3.0 was
                                                                         the aforementioned frameworks are listed in Table 1. The mAP
     used in the training process.
                                                                         represents the average area under the precision-recall curves
     Statistical Analysis                                                that were drawn based on the results of aneurysm and blood
     Statistical analyses were performed by using statistical software   vessel overlap predictions.
     (SPSS version 22.0; IBM Corporation). We used the 5-fold            The sensitivity, specificity, and accuracy results of RetinaNet
     cross-validation strategy with mean average precision (mAP)         [25], Liao et al [15], Duan et al [16], the
     values to assess the accuracy of intracranial aneurysm and          bi-input+RetinaNet+C-LSTM framework, and the human
     overlap classification. The bounding box regression task was        experts with 20 years of experience are listed in Table 2.
     evaluated based on the smooth L1 loss. A confusion matrix,
     receiver operating characteristic (ROC) curves, and area under      Compared to the other frameworks’ results, the
     the curve (AUC) values were used to assess the abilities of         bi-input+RetinaNet+C-LSTM framework had the best
     different frameworks. For ROC curves, comparisons of AUC            performance. The mean sensitivity, specificity, and accuracy
     values (with SEs and 95% CIs) were made by using a                  of the bi-input+RetinaNet+C-LSTM framework were 89%
     nonparametric approach [32]. A total of 20 patients with PCoA       (range 67.02%-98.43%), 93% (range 72.30%-99.56%), and
     aneurysms (test set) and 20 patients without aneurysms were         91% (range 77.63%-97.72%), respectively.
     used to evaluate the performance of each framework and the          The confusion matrix of each framework is shown in Figure 8;
     human experts, who had 20 years of experience. True positives,      both the bi-input+RetinaNet+C-LSTM and RetinaNet
     true negatives, false positives, and false negatives were used to   frameworks had the highest true-positive rate, but the
     calculate sensitivity, specificity, and accuracy, which were        false-positive rate of the bi-input+RetinaNet+C-LSTM
     determined based on the optimal threshold from the Youden           framework was much smaller than that of the other frameworks.
     index. The adjusted Wald method was used to determine the           Therefore, the bi-input+RetinaNet+C-LSTM framework had
     95% CIs of the accuracy, sensitivity, and specificity values from   the best performance compared to that of the other frameworks.
     the contingency tables [33].
                                                                         The original images of the DSA sequence and their
     Results                                                             corresponding results for the RLS and IADS are presented in
                                                                         Figure 9, which shows the detection results for different sizes
     During the RLS, the system only needs to perform the simple         of aneurysms. Most of the results had a confidence level of up
     task of determining the valid coarse regions. The accuracy of       to 1.0. This proves that our proposed method performs well in
     region localization for the test set was 100%, which proves that    the detection of multiscale aneurysms.

     https://medinform.jmir.org/2022/3/e28880                                                    JMIR Med Inform 2022 | vol. 10 | iss. 3 | e28880 | p. 6
                                                                                                             (page number not for citation purposes)
XSL• FO
RenderX
JMIR MEDICAL INFORMATICS                                                                                                                          Liao et al

     Figure 4. Flowchart of enrollment information for included patients. AVF: arteriovenous fistula; AVM: arteriovenous malformation; DSA: digital
     subtraction angiography; PCoA: posterior communicating artery.

     Figure 5. The 5-fold cross-validation results for the ROC curves and AUC values of the different frameworks. The results of different cross-validation
     models are shown in different colors. A: RetinaNet [25]. B: Liao et al [15]. C: Duan et al [16]. D: Bi-input+RetinaNet+C-LSTM. The ROC curves of
     fold 0 and fold 2 in graph C overlap, and the ROC curves of fold 1 and fold 4 in graph D overlap. AUC: area under the curve; C-LSTM: convolutional
     long short-term memory; ROC: receiver operating characteristic.

     https://medinform.jmir.org/2022/3/e28880                                                                 JMIR Med Inform 2022 | vol. 10 | iss. 3 | e28880 | p. 7
                                                                                                                          (page number not for citation purposes)
XSL• FO
RenderX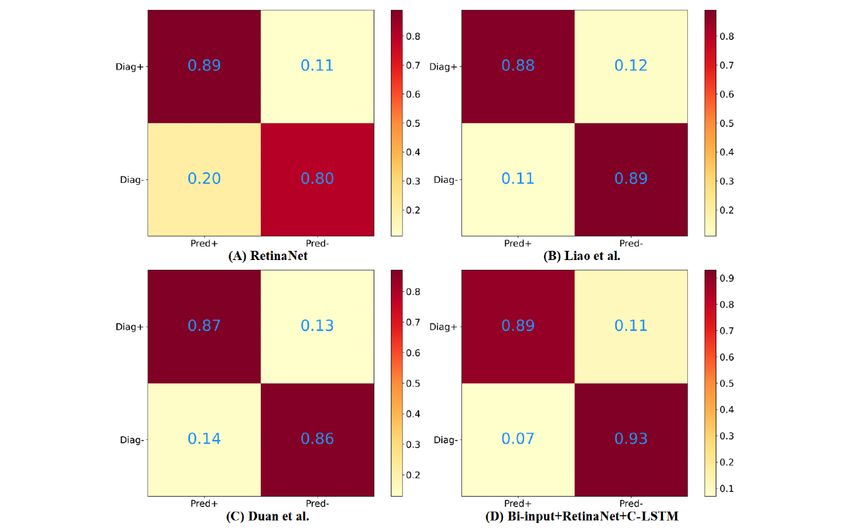
JMIR MEDICAL INFORMATICS                                                                                                                            Liao et al

     Figure 6. The 5-fold cross-validation results of the focal loss of each framework. Different color curves indicate different cross-validation models. A:
     RetinaNet [25]. B: Liao et al [15]. C: Duan et al [16]. D: Bi-input+RetinaNet+C-LSTM. C-LSTM: convolutional long short-term memory.

     Figure 7. The 5-fold cross-validation results of the smooth L1 loss of each framework. Different color curves indicate different cross-validation models.
     A: RetinaNet [25]. B: Liao et al [15]. C: Duan et al [16]. D: Bi-input+RetinaNet+C-LSTM. C-LSTM: convolutional long short-term memory.

     https://medinform.jmir.org/2022/3/e28880                                                                   JMIR Med Inform 2022 | vol. 10 | iss. 3 | e28880 | p. 8
                                                                                                                            (page number not for citation purposes)
XSL• FO
RenderX
JMIR MEDICAL INFORMATICS Liao et al
Table 1. The mean average precision (mAP) values from the 5-fold cross-validation.
Frameworks Fold 1, mAP Fold 2, mAP Fold 3, mAP Fold 4, mAP Fold 5, mAP
RetinaNet [25] 0.4006 0.6553 0.5687 0.6941 0.7569
Liao et al [15] 0.5082 0.6968 0.5852 0.6479 0.7681
Duan et al [16] 0.4982 0.7157 0.4666 0.7925 0.8294
Bi-input+RetinaNet+C-LSTMa 0.4435 0.6523 0.5254 0.6506 0.7408
a
C-LSTM: convolutional long short-term memory.
Table 2. The performance of each framework.
Frameworks Sensitivity (%), mean (range) Specificity (%), mean (range) Accuracy (%), mean (range) Time cost (s)
RetinaNet [25] 89 (67.02-98.43) 80 (56.34-94.27) 84.50 (69.57-93.97) 0.24
Liao et al [15] 88 (65.76-98.06) 89 (67.02-98.43) 88.50 (74.44-96.39) 2.21
Duan et al [16] 87 (64.53-97.66) 86 (63.31-97.24) 86.50 (71.97-95.22) 0.33
Bi-input+RetinaNet+C-LSTMa 89 (67.02-98.43) 93 (72.30-99.56) 91 (77.63-97.72) 2.72
Human experts 90 (68.30-98.77) 90 (68.30-98.77) 90 (76.34-97.21) N/Ab
a
C-LSTM: convolutional long short-term memory.
b
N/A: not applicable.
Figure 8. The results of the confusion matrix for each framework. The upper left corners represent true positives, the upper right corners represent
false negatives, the lower left corners represent false positives, and the lower right corners represent true negatives. A: RetinaNet [25]. B: Liao et al
[15]. C: Duan et al [16]. D: Bi-input+RetinaNet+C-LSTM. C-LSTM: convolutional long short-term memory; Diag+: diagnosed with tumor; Diag-:
diagnosed without tumor; Pred+: predicted tumor; Pred-: no predicted tumor.
https://medinform.jmir.org/2022/3/e28880 JMIR Med Inform 2022 | vol. 10 | iss. 3 | e28880 | p. 9
(page number not for citation purposes)
XSL• FO
RenderXJMIR MEDICAL INFORMATICS Liao et al
Figure 9. A sample of the original images of the DSA sequence and their corresponding results in the RLS and IADS. A, D, and G represent the raw
DSA sequences, and B, E, and H represent the experimental results of the RLS. The results of the IADS are shown in C, F, and I. The red bounding
boxes denote the aneurysms, and the green bounding boxes represent the overlapping blood vessels. DSA: digital subtraction angiography; IADS:
intracranial aneurysm detection stage; RLS: region localization stage.
which frame might be more important for detection.
Discussion Bidirectional temporal information processing allows each frame
Principal Findings in DSA sequences to combine both past and future information,
and each frame can apply the same weight in the diagnosis
We used the RLS to help decrease the computational load and process. Although processing time information increases
reduce the interference of unrelated tissues, such as bones and detection times, accuracy is more important than speed when
small vessels. This step can reduce time consumption and help it comes to medical imaging tasks. Even if the detection time
neural networks focus on the PCoA region. Moreover, as the increases, the model can still complete the detection within 3
2D DSA images may have had different scales, we used the seconds, which is acceptable. Therefore, it was reasonable for
RLS to standardize the images to the same scale. In the clinical us to add a bidirectional C-LSTM network to process
diagnosis process, experienced neurosurgeons and information.
neurointerventional radiologists observed the whole DSA
sequence and distinguished overlapping arteries from aneurysms In the real diagnosis process, physicians often combine the
based on the flow of contrast agents through blood vessels. frontal and lateral sequences to make decisions because some
Inspired by this process, we introduced temporal information aneurysms are difficult to identify in images taken from 1 angle.
processing, which has been widely used in text understanding, Based on this idea, we combined the frontal sequences with the
to improve our diagnostic system. As classic time-processing lateral sequences together (bi-input) to increase the amount of
neural networks, such as LSTM networks, only focus on 1D spatial information and further improve the performance of the
information, they inevitably result in information loss (ie, the diagnostic system. According to the results of this study, the
loss of spatial details) when a 2D image is flattened to 1D bi-input+RetinaNet+C-LSTM framework improved the
information. To address this problem, we chose the C-LSTM sensitivity to 89% and the specificity to 93%, and its accuracy
network, which is specifically designed for 3D data. C-LSTM was the highest (91%) among all models. In addition, the
networks use 3D data as input to process 2D image sequences bi-input+RetinaNet+C-LSTM framework also had the highest
combined with temporal information. Monodirectional average AUC value and the best confusion matrix. Hence, the
processing methods only allow later features to obtain bi-input+RetinaNet+C-LSTM framework had the best
information from previously inputted images, which results in performance among all models, and its results were similar to
the imbalance of information. As such, it is difficult to specify those of experienced human experts.
https://medinform.jmir.org/2022/3/e28880 JMIR Med Inform 2022 | vol. 10 | iss. 3 | e28880 | p. 10
(page number not for citation purposes)
XSL• FO
RenderXJMIR MEDICAL INFORMATICS Liao et al
We labeled some overlapping blood vessels that were easily the bi-input+RetinaNet+C-LSTM had the best performance
confused with aneurysms, which also indirectly reduced the when compared to that of the other frameworks. Our study
rate of false positives to some extent. However, adding the demonstrated that our system can assist physicians in detecting
overlap labels also caused fluctuations in the mAP values. The intracranial aneurysms on 2D DSA images.
reason for this may have been that the physicians only labeled
Our experiment had some limitations. First, our data set is
aneurysms and some overlaps, such as the segment of the ICA
comparatively small and only includes PCoA aneurysms. In the
near the clinoid process. It was difficult to label all of the
future, we will include cerebral aneurysms in different locations.
overlaps, since our main task was to look for aneurysms, and
Second, the cascading network framework is relatively complex.
labeling overlaps requires considerable amounts of work. In our
Therefore, an end-to-end network should be considered. In
framework’s predictions, some overlapping blood vessels were
future work, we will attempt to find a method that compensates
identified by the framework but may not have been marked,
for the loss of information in the process of converting 2D
and some overlaps were annotated but not detected, which
information to 1D information and use a transformer [34] to
resulted in a large fluctuation in mAP values.
process time information.
Conclusion
According to our results, more spatial and temporal information
can help improve the performance of the frameworks. Therefore,
Acknowledgments
This work is supported in part by the Research and Development Projects in Sichuan Province (grant 2021YFS0204), in part by
the National Natural Science Foundation of China (grant 62072319), and in part by the Key Research and Development Program
of Science and Technology Department of Sichuan Province (grant 2020YFS0575).
Conflicts of Interest
None declared.
References
1. Wong JHY, Tymianski R, Radovanovic I, Tymianski M. Minimally invasive microsurgery for cerebral aneurysms. Stroke
2015 Sep;46(9):2699-2706. [doi: 10.1161/STROKEAHA.115.008221] [Medline: 26304867]
2. Wardlaw JM, White PM. The detection and management of unruptured intracranial aneurysms. Brain 2000 Feb;123 (Pt
2):205-221. [doi: 10.1093/brain/123.2.205] [Medline: 10648430]
3. Keedy A. An overview of intracranial aneurysms. Mcgill J Med 2020 Dec 01;9(2):141-146 [FREE Full text] [doi:
10.26443/mjm.v9i2.672]
4. Esteva A, Kuprel B, Novoa RA, Ko J, Swetter SM, Blau HM, et al. Dermatologist-level classification of skin cancer with
deep neural networks. Nature 2017 Feb 02;542(7639):115-118 [FREE Full text] [doi: 10.1038/nature21056] [Medline:
28117445]
5. Krizhevsky A, Sutskever I, Hinton GE. ImageNet classification with deep convolutional neural networks. 2012 Presented
at: Advances in Neural Information Processing Systems 25: 26th Annual Conference on Neural Information Processing
Systems 2012; December 3-6, 2012; Lake Tahoe, Nevada, United States p. 1-9 URL: https://papers.nips.cc/paper/2012/
file/c399862d3b9d6b76c8436e924a68c45b-Paper.pdf
6. Hubel DH, Wiesel TN. Receptive fields and functional architecture of monkey striate cortex. J Physiol 1968
Mar;195(1):215-243 [FREE Full text] [doi: 10.1113/jphysiol.1968.sp008455] [Medline: 4966457]
7. Fukushima K, Miyake S. Neocognitron: A self-organizing neural network model for a mechanism of visual pattern
recognition. In: Competition and Cooperation in Neural Nets. 1982 Presented at: U.S.-Japan Joint Seminar; February 15-19,
1982; Kyoto, Japan p. 267-285. [doi: 10.1007/978-3-642-46466-9_18]
8. Lakhani P, Sundaram B. Deep learning at chest radiography: Automated classification of pulmonary tuberculosis by using
convolutional neural networks. Radiology 2017 Aug;284(2):574-582. [doi: 10.1148/radiol.2017162326] [Medline: 28436741]
9. Yasaka K, Akai H, Abe O, Kiryu S. Deep learning with convolutional neural network for differentiation of liver masses at
dynamic contrast-enhanced CT: A preliminary study. Radiology 2018 Mar;286(3):887-896. [doi: 10.1148/radiol.2017170706]
[Medline: 29059036]
10. Shi X, Chen Z, Wang H, Yeung DY, Wong WK, Woo WC. Convolutional LSTM network: a machine learning approach
for precipitation nowcasting. 2015 Dec Presented at: The 28th International Conference on Neural Information Processing
Systems; December 7-12, 2015; Montreal, Canada p. 802-810.
11. Novikov AA, Major D, Wimmer M, Lenis D, Buhler K. Deep sequential segmentation of organs in volumetric medical
scans. IEEE Trans Med Imaging 2019 May;38(5):1207-1215. [doi: 10.1109/TMI.2018.2881678] [Medline: 30452352]
12. Liu X, Liu T, Zhang Z, Kuo PC, Xu H, Yang Z, et al. TOP-Net prediction model using bidirectional long short-term memory
and medical-grade wearable multisensor system for tachycardia onset: Algorithm development study. JMIR Med Inform
2021 Apr 15;9(4):e18803 [FREE Full text] [doi: 10.2196/18803] [Medline: 33856350]
https://medinform.jmir.org/2022/3/e28880 JMIR Med Inform 2022 | vol. 10 | iss. 3 | e28880 | p. 11
(page number not for citation purposes)
XSL• FO
RenderXJMIR MEDICAL INFORMATICS Liao et al
13. Podgoršak AR, Bhurwani MM, Rava RA, Chandra AR, Ionita CN. Use of a convolutional neural network for aneurysm
identification in digital subtraction angiography. 2019 Mar 13 Presented at: SPIE Medical Imaging 2019: Computer-Aided
Diagnosis; February 16-21, 2019; San Diego, California, United States. [doi: 10.1117/12.2512810]
14. Jin H, Yin Y, Hu M, Yang G, Qin L. Fully automated unruptured intracranial aneurysm detection and segmentation from
digital subtraction angiography series using an end-to-end spatiotemporal deep neural network. 2019 Mar 15 Presented at:
SPIE Medical Imaging 2019: Image Processing; February 16-21, 2019; San Diego, California, United States. [doi:
10.1117/12.2512623]
15. Liao J, Duan H, Dai H, Huang Y, Liu L, Chen L, et al. Automatic detection of intracranial aneurysm from digital subtraction
angiography with cascade networks. 2019 Aug Presented at: The 2nd International Conference on Artificial Intelligence
and Pattern Recognition; August 16-18, 2019; Beijing, China p. 18-23. [doi: 10.1145/3357254.3357258]
16. Duan H, Huang Y, Liu L, Dai H, Chen L, Zhou L. Automatic detection on intracranial aneurysm from digital subtraction
angiography with cascade convolutional neural networks. Biomed Eng Online 2019 Nov 14;18(1):110 [FREE Full text]
[doi: 10.1186/s12938-019-0726-2] [Medline: 31727057]
17. Ojemann RG, Crowell RM. Surgical management of cerebrovascular disease. Ann Surg 1984;199(3):49A. [doi:
10.1097/00000658-198403000-00022]
18. Lin TY, Dollár P, Girshick R, He K, Hariharan B, Belongie S. Feature pyramid networks for object detection. 2017 Nov
09 Presented at: 2017 IEEE Conference on Computer Vision and Pattern Recognition (CVPR); July 21-26, 2017; Honolulu,
Hawaii, USA. [doi: 10.1109/cvpr.2017.106]
19. He K, Zhang X, Ren S, Sun J. Deep residual learning for image recognition. 2016 Dec 12 Presented at: 2016 IEEE Conference
on Computer Vision and Pattern Recognition (CVPR); June 27-30, 2016; Las Vegas, Nevada, USA. [doi:
10.1109/cvpr.2016.90]
20. Ren S, He K, Girshick R, Sun J. Faster R-CNN: Towards real-time object detection with region proposal networks. IEEE
Trans Pattern Anal Mach Intell 2017 Jun;39(6):1137-1149. [doi: 10.1109/TPAMI.2016.2577031] [Medline: 27295650]
21. Zhang K, Liu X, Liu F, He L, Zhang L, Yang Y, et al. An interpretable and expandable deep learning diagnostic system
for multiple ocular diseases: Qualitative study. J Med Internet Res 2018 Nov 14;20(11):e11144 [FREE Full text] [doi:
10.2196/11144] [Medline: 30429111]
22. Ko H, Chung H, Kang WS, Kim KW, Shin Y, Kang SJ, et al. COVID-19 pneumonia diagnosis using a simple 2D deep
learning framework with a single chest CT image: Model development and validation. J Med Internet Res 2020 Jun
29;22(6):e19569 [FREE Full text] [doi: 10.2196/19569] [Medline: 32568730]
23. Liang B, Yang N, He G, Huang P, Yang Y. Identification of the facial features of patients with cancer: A deep learning–based
pilot study. J Med Internet Res 2020 Apr 29;22(4):e17234. [doi: 10.2196/17234]
24. Huang P, Yu G, Lu H, Liu D, Xing L, Yin Y, et al. Attention-aware fully convolutional neural network with convolutional
long short-term memory network for ultrasound-based motion tracking. Med Phys 2019 May;46(5):2275-2285. [doi:
10.1002/mp.13510] [Medline: 30912590]
25. Lin TY, Goyal P, Girshick R, He K, Dollár P. Focal loss for dense object detection. 2017 Dec 25 Presented at: 2017 IEEE
International Conference on Computer Vision (ICCV); October 22-29, 2017; Venice, Italy. [doi: 10.1109/iccv.2017.324]
26. Long J, Shelhamer E, Darrell T. Fully convolutional networks for semantic segmentation. 2015 Oct 15 Presented at: 2015
IEEE Conference on Computer Vision and Pattern Recognition (CVPR); June 7-12, 2015; Boston, Massachusetts, USA p.
3431-3440. [doi: 10.1109/cvpr.2015.7298965]
27. Jung H, Kim B, Lee I, Yoo M, Lee J, Ham S, et al. Detection of masses in mammograms using a one-stage object detector
based on a deep convolutional neural network. PLoS One 2018 Sep 18;13(9):e0203355. [doi: 10.1371/journal.pone.0203355]
[Medline: 30226841]
28. Umer J, Irtaza A, Nida N. MACCAI LiTS17 liver tumor segmentation using RetinaNet. 2021 Jan 20 Presented at: 2020
IEEE 23rd International Multitopic Conference (INMIC); November 5-7, 2020; Bahawalpur, Pakistan. [doi:
10.1109/inmic50486.2020.9318116]
29. Gräbel P, Özkan Ö, Crysandt M, Herwartz R, Baumann M, Klinkhammer BM, et al. Circular anchors for the detection of
hematopoietic cells using Retinanet. 2020 May 22 Presented at: 2020 IEEE 17th International Symposium on Biomedical
Imaging (ISBI); April 3-7, 2020; Iowa City, Iowa, USA. [doi: 10.1109/isbi45749.2020.9098398]
30. Keras: The Python Deep Learning library. The SAO/NASA Astrophysics Data System. URL: https://ui.adsabs.harvard.edu/
abs/2018ascl.soft06022C/abstract [accessed 2022-03-11]
31. Kingma D, Ba J. Adam: A method for stochastic optimization. arXiv. Preprint posted online on December 22, 2014 [FREE
Full text]
32. DeLong ER, DeLong DM, Clarke-Pearson DL. Comparing the areas under two or more correlated receiver operating
characteristic curves: A nonparametric approach. Biometrics 1988 Sep;44(3):837-845. [doi: 10.2307/2531595]
33. Agresti A, Coull BA. Approximate is better than “Exact” for interval estimation of binomial proportions. Am Stat
1998;52(2):119-126. [doi: 10.1080/00031305.1998.10480550]
34. Vaswani A, Shazeer N, Parmar N, Uszkoreit J, Jones L, Gomez AN, et al. Attention is all you need. arXiv. Preprint posted
online on December 6, 2017 [FREE Full text]
https://medinform.jmir.org/2022/3/e28880 JMIR Med Inform 2022 | vol. 10 | iss. 3 | e28880 | p. 12
(page number not for citation purposes)
XSL• FO
RenderXJMIR MEDICAL INFORMATICS Liao et al
Abbreviations
AUC: area under the curve
C-LSTM: convolutional long short-term memory
CNN: convolutional neural network
DSA: digital subtraction angiography
FPN: feature pyramid network
IADS: intracranial aneurysm detection stage
ICA: internal carotid artery
LSTM: long short-term memory
mAP: mean average precision
PCoA: posterior communicating artery
ResNet: residual deep neural network
RLS: region localization stage
ROC: receiver operating characteristic
SAH: subarachnoid hemorrhage
Edited by C Lovis; submitted 23.03.21; peer-reviewed by SM Mir Hosseini, G Ahmadi, JA Benítez-Andrades; comments to author
21.05.21; revised version received 27.06.21; accepted 16.01.22; published 16.03.22
Please cite as:
Liao J, Liu L, Duan H, Huang Y, Zhou L, Chen L, Wang C
Using a Convolutional Neural Network and Convolutional Long Short-term Memory to Automatically Detect Aneurysms on 2D Digital
Subtraction Angiography Images: Framework Development and Validation
JMIR Med Inform 2022;10(3):e28880
URL: https://medinform.jmir.org/2022/3/e28880
doi: 10.2196/28880
PMID:
©JunHua Liao, LunXin Liu, HaiHan Duan, YunZhi Huang, LiangXue Zhou, LiangYin Chen, ChaoHua Wang. Originally published
in JMIR Medical Informatics (https://medinform.jmir.org), 16.03.2022. This is an open-access article distributed under the terms
of the Creative Commons Attribution License (https://creativecommons.org/licenses/by/4.0/), which permits unrestricted use,
distribution, and reproduction in any medium, provided the original work, first published in JMIR Medical Informatics, is properly
cited. The complete bibliographic information, a link to the original publication on https://medinform.jmir.org/, as well as this
copyright and license information must be included.
https://medinform.jmir.org/2022/3/e28880 JMIR Med Inform 2022 | vol. 10 | iss. 3 | e28880 | p. 13
(page number not for citation purposes)
XSL• FO
RenderXYou can also read