Urban waterborne public transport systems: An overview of existing operations in world cities - Harsha Cheemakurthy Michael Tanko Karl Garme ...
←
→
Page content transcription
If your browser does not render page correctly, please read the page content below

Urban waterborne public transport
systems: An overview of existing
operations in world cities

Harsha Cheemakurthy
Michael Tanko
Karl Garme

TRITA-AVE 2017:92
ISSN1651-7660
ISBN 978-91-7729-648-5

KTH Royal Institute of Technology
School of Engineering Sciences
Department of Aeronautical and Vehicle Engineering
Centre for Naval Architecture

TABLE OF CONTENTS

SUMMARY .......................................................................................................... 1
OVERVIEW OF URBAN FERRY SERVICES ............................................................... 3
LARGE SCALE WATER TRANSIT NETWORKS ........................................................ 15
  AMSTERDAM ....................................................................................................... 15
  AUCKLAND ........................................................................................................... 17
  BRISBANE ............................................................................................................. 19
  HONG KONG ........................................................................................................ 21
  ISTANBUL ............................................................................................................. 23
  IZMIR .................................................................................................................... 25
  LONDON ............................................................................................................... 27
  NEW YORK............................................................................................................ 29
  SAN FRANCISCO ................................................................................................... 31
  SEATTLE ................................................................................................................ 33
  STAVANGER ......................................................................................................... 35
  SYDNEY ................................................................................................................. 37
  VENICE.................................................................................................................. 39
MEDIUM SCALE WATER TRANSIT NETWORKS .................................................... 43
  COPENHAGEN ...................................................................................................... 43
  GOTHENBURG ..................................................................................................... 45
  HAMBURG ............................................................................................................ 47
  RIO DE JANIERO ................................................................................................... 49
  STOCKHOLM ........................................................................................................ 51
  VANVOUVER ........................................................................................................ 53
SMALL SCALE WATER TRANSIT NETWORKS ....................................................... 55
  BOSTON ................................................................................................................ 55
  OSLO ..................................................................................................................... 57
  ROTTERDAM ........................................................................................................ 59
WELLINGTON ....................................................................................................... 61
CONCLUSION AND FUTURE RESEARCH .............................................................. 63
REFERENCES ..................................................................................................... 67
CASE REFERENCES ............................................................................................ 69
IMAGE REFERENCES.......................................................................................... 77

SUMMARY
This report aims to collate information on existing waterborne public transport systems in
order to provide a resource for cities that may be considering implementing a water transit
network. Stockholm County Council has recently expressed interest in expanding its existing
inland waterway network to facilitate increased passenger transport capacity within the city
and surrounding districts. This report introduces waterway public transportation systems
currently operating in 23 cities around the world to provide an overview of the current state
of urban water transit globally. Key operational metrics have been identified and described
which have been chosen in order to be most relevant in assessing water transport options for
cities. Information regarding system organization, route structure, schedules, and vessels
have been compiled. In addition, operational factors contributing to the success of existing
water transit systems have also been highlighted as per existing literature. Such
characteristics introduced in the report overview include transport integration within the
wider public transport network, public perception and feasibility of implementation, land use
implications, and the role of water transport in tourism and leisure travel. Efforts toward
incorporating environmental sustainability are also briefly addressed. Cities have been
divided into three broad categories based on the geographic size and passenger carrying
capacity of each water transit system. There were 13 cities identified as large scale, 6 as
medium scale and 4 as small scale, or in nascent stages of development. Facilities on board
vessels and also terminal infrastructure are compared, as well as any unique features or
operating characteristics, which are highlighted. Finally, the systems are mapped a scale in
order to compare route structures and scope of operation.

                                              1
2
OVERVIEW OF URBAN FERRY SERVICES
Cities are increasingly looking at new ways to expand their public transport offering.
Development of transport networks on urban waterways is one method that is being
considered. Stockholm is one such city with an interest to further develop its water transport
links to islands within the inner city and the more distant archipelago areas. This report
details the efforts of cities which have developed urban water transport networks for
passenger transport. Building on the work of previous studies in urban water transport, this
report seeks to further shed light on contemporary water transit systems; what they look like,
what they add to a city’s infrastructure and transport network and how they are being used.
It is the hope that this report will be a useful resource to cities that are looking to implement
new waterborne transport service, or expand existing small scale water transport networks
to a larger scale. In order to define the scope of investigation and inform the selection of the
cases that have been chosen, it is first necessary to explore the key characteristics of water
transit systems.

Route and service type
The first key characteristic is route type. While traditional ferry services have usually
operated in a cross-river only configuration, contemporary ferry systems have evolved to
incorporate a range of route designs. This report identified ferries in urban waters that can
be seen to operate in three different route types:
Type A refers to routes where boat services traverse along a river or water body stopping at
multiple destinations connecting points of interest along a waterfront. Such services have
been referred to also as linear ferry systems (Thompson et al. 2006; Soltani et al. 2015; Tanko
& Burke 2015). The Älvsnabben service (Line 285) in Gothenburg can be seen operating in
this type of configuration (Figure 1). As will be shown, this is increasingly becoming the
favoured route type of contemporary water transit services which seek to maximise
efficiencies and stimulate waterfront development by providing waterfront transit stops.
Among the cities identified in this report that can be seen operating this route type, some
have focused predominantly on one side of the waterway, while others incorporate a more
cross river zig zag pattern, depending on the land use context of each respective city.
While this operating model results in increased passenger capture capacity and frequent
stops, there are obvious issues in terms of increased journey times. This is especially the case
with water transit often being subject to longer terminal stopping times. Some cities have
implemented split route configurations, where some services run express and bypass
terminals in order to minimise stopping times such as in Brisbane (Figure 2).

                                               3
Figure 1 Route A type in Gothenburg, Sweden

Figure 2 Full route (blue) and inner city express route (red) in Brisbane. Source: Translink (2017)

                                                4
In other cases the cities have divided the one primary linear route into a more complex set of
coordinated, complimentary routes that require transfer between vessels to reach
destinations, such as in Hamburg (Figure 3).

                      Figure 3 Coordinated water transit routes in Hamburg

Routes of Type A can also run parallel to land based transit avoiding congestion and often
deliver comparable travel times, especially during peak periods (Tanko et al. forthcoming).
Regarding the land use planning implications, this style of route also has been shown to
facilitate Transit Oriented Development (TOD), where terminal nodes on the route serve to
stimulate economic development and increase land values around terminals, as was shown in
Brisbane (Tsai et al. 2015) and New York (Camay et al 2012; New York City Economic
Development Corporation 2013).
Type B refers to shorter routes with two or three stops either in a simple river crossing or
triangular three-point stop configuration. This was previously the most common form of ferry
that was developed primarily in the absence of land based transport connection. A good
example is Copenhagen, which operates high frequency cross river services in the inner-city
area between popular destinations (Figure 4). In some cases these routes form part of an
essential transport connection, where they are subsidised and used for free such as in
Gothenburg and Brisbane. Due to the short travel times the design of vessels themselves
usually cater for a quick turnaround and capacity rather than on board amenities. In
Gothenburg, the Älvsnabbare service between Stenpiren and Lindholmspiren features wide
open spaces to maximize on board accommodation of commuters and cyclists on a
particularly busy cross river route with a departure frequency of every 7 minutes and travel
time of 5 minutes. Since the travel time is short the time at the terminal plays an important
part in the overall journey time. In order to reduce this terminal time this route has
implemented double ended vessels (Figure 5). For this route type the speed of vessels is not
as critical if considering the alternate land based option could take much longer to commute
via the road network (Stenius et al. 2014)

                                               5
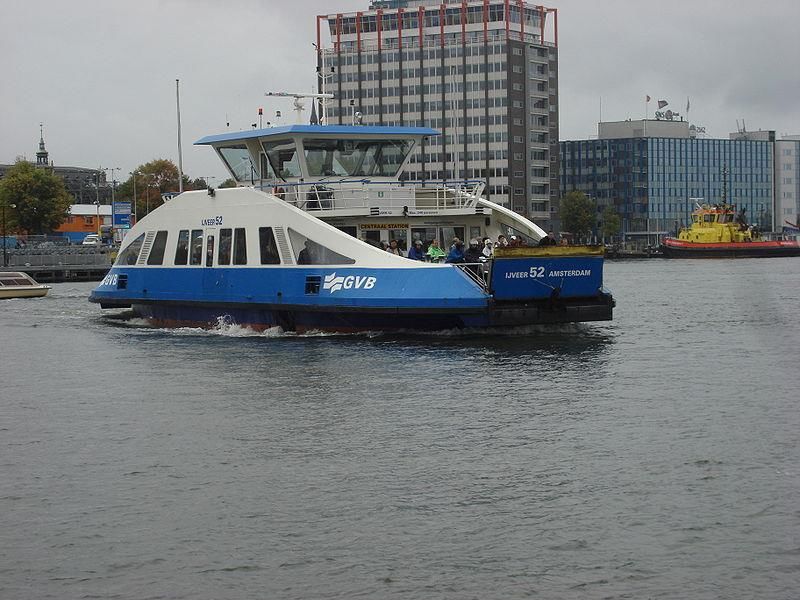
Figure 4 Example of Type B cross river routes in Amsterdam Source: GVB/Google Maps

       Figure 5 Älveli and Älvfrida vessels in Gothenburg. Source: Styrsöbolaget (2015)

Finally, an important performance driver for such routes is a high frequency service. In
Brisbane, Hong Kong, New York, Stavanger and Venice, services of this route type have a
frequency of less than 10 min in peak periods. In cities with high night traffic like in
Amsterdam, there are also late services on popular routes.

                                               6
Type C routes are those which link suburbs with the inner-city area. An example of this is Line
89 in Stockholm which connects the suburban Ekerö area 25km outside the city centre
(Figure 6). These ferries don’t usually operate at high frequencies since the journeys are
typically long. In contrast with B type routes the design focus on such routes tends towards
service amenity and providing facilities like comfortable seating, tables, toilet and having food
available on board. An issue with these routes is achieving a constant demand outside peak
commuting periods to sustain all day operation as a regularly scheduled public transport
service. In some cases, services only operate in the morning and afternoon peak periods
leaving a non-service gap in between, such as in Auckland and San Francisco. These routes
may face greater scrutiny for running vessels at less than capacity, with greater challenges in
creating a long term economically viable service.
Figure 6 Route comparison: Type C (Yellow), Type A (Blue), Type B (Red) in Stockholm
Type C routes can be found in many cities and there have been some interesting strategies to
counteract the lack of passenger demand outside peak hours. In Wellington, for example,
ferries operate on different routes based on the time of day and season. In Hamburg, ferries
transform into lecture halls during off peak hours to cater for a different purpose and
clientele. In this report, we focus on ferry service connecting suburban areas within the city
limits, and therefore intercity (or intercountry) travel is outside the scope of this analysis.
We now look toward other factors worth considering in the development of urban water
transport systems. The first of these, which has already been briefly mentioned is scheduling
of services, and how the network is planned
7Scheduling
A particular challenger facing planners of water transit is balancing the demand for services
and coordinating an appropriate schedule. Ferry services that are not frequent enough will
create problems to offering a convenient transport alternative for passengers. Route type
and length, as well as population density, will largely determine the frequencies of service
that can be economically offered. As noted, Type B routes linking inner city areas may be able
to run at headways of as little as 5 minutes. Other routes that are part of a wider network
may require more considered planning. In Sydney, for example, there is a significant
challenge in scheduling the ferry network and facilitating the changing of passengers
between routes in a complicated network characterised by one key transfer hub. Sandell
(2015) has suggested that by implementing a pulse timetable where ferry services meet at
timed intervals at this central hub, it could greatly increase origin-destination pairings, with
only little increase in cost (Figure 7). In the Water365 project in Stockholm it has been
suggested that suburban shuttles (of the Type C route) could feasibly operate with twice the
capacity of inner city routes while having a departure frequency of 20 minutes (Stenius et al.
2014).
Figure 7 Pulse timetable ferry network design. Source: Sandell (2015)
8Transit network integration
One of the key aspects that has been identified in the success of contemporary water
transport services is the connection with existing public transport networks (Soltani et al.
2015). It was found in this report that water transport services vary from fully integrated into
the existing public transport network with terminals facilitating interchange between services
(Brisbane, Gothenburg), to separate ferry services operated by private companies outside of
the public transport network and on a non-scheduled basis (Hong Kong). Considering the
public transport ticketing system, one can find integration in Stockholm, Gothenburg,
Vancouver and Rio de Janeiro. While it is perceived convenient for a passenger to have a
combined ticket pass, the viability of intermodal integration needs to be investigated from an
economic point of view for running the vessels, especially for Type C routes.
Terminal design
Closely linked with the need for water transit to be linked with the wider public transport
network is the importance of terminal location, design and infrastructure. A key factor is the
conscious planning of ferry terminals with other transit options, with ease of transfer
between modes being facilitated. The design of the terminals is also important for other
reasons. In coordination with vessel design, terminals should be designed in order to reduce
the time taken to load and unload passengers. Some further performance factors of
terminals are availability of facilities like seating and shelter, ticket machine availability, real-
time information systems and disability access. Despite these ideal specifications, terminals
may be limited to more pragmatic designs in accordance with their route type they support.
For example, longer distance routes might require more seating spaces with food kiosks and
toilet facilities, while route types A and B would likely require more focus on reducing the
time spent at terminals. In routes relying on short turnaround times, as noted, there is move
toward double ended vessels. However, for the most part, docks facilitating side loading are
common and have been effectively implemented. For reference, a 1.5 minute estimated
embankment time at full capacity has been recommended for future service design in
Stockholm (Stenius el al. 2014).
In terms of the structure itself, while most cities have fixed wharfs, Rotterdam and Hamburg
have floating wharfs which might be suitable for making docks more integrated with other
transport as they can be easily towed to a new location. However, there is an ongoing debate
about whether temporary terminal facilities will encourage supportive land use development
as much as fixed terminals (Thompsons et al. 2006). Tidal considerations are also relevant in
cities such as Hamburg where careful planning needs to be made for not only terminal
infrastructure but also logistical operation to account for tidal variation. Seasonal variation in
some cities may not dictate terminal type as greatly as other cities, for example, where
Stockholm’s water level sees an annual fluctuation of about 10 cm in its water levels. Finally,
the effects of flooding need to be considered in any structural design according to the local
weather conditions.
9Accessibility, comfort and public perception
One of the identified motivations towards developing water borne transport services is that
research has shown that comfort of journey is an increasingly important factor for
commuters. Assessment of water transport has shown that commuters are often more
satisfied with the comfort of services compared to other modes (Queensland Government,
2015), and empirical studies have suggested that there is a premium value attached to water
transport services, where commuters will prefer boat transport despite a longer travel time
compared to a bus (Tanko et al. forthcoming). However, even in cities with extensive public
transportation networks, the actual mode share of waterborne transport is usually low. For
example, in Sydney the mode share of ferry transport is only 3% of all public transport
journeys despite having a total of 14.8 million trips a year (Sydney Ferries 2012). To increase
ridership and make waterways more popular, cities have adopted different strategies, with
some promoting high speed express services (Sydney) or additional on board facilities and
Wi-Fi (Rotterdam). Auckland has a focus on providing infrastructure catering for the needs of
the physically challenged where there are separate access points and seating to make the
travel experience easy and comfortable. Gothenburg caters to the needs of cyclists where
ferries have a wide-open space for accommodating bicycles. On board food and drinks and
premium seating on London’s Thames Clippers river transit service has proven popular with
commuters seeking respite from overcrowding on London Underground rail services.
However, such efforts to bolster the appeal of water transit are still being debated, with
some arguing that such facilities detract from the focus of providing a useful and efficient
service. As water transport usually entails longer travel times this poses practical challenge to
balance acceptable travel times while providing better service amenities. Efforts to identify
the specific factors valued by water transport passengers and how to weigh these benefits
against travel time is the focus of ongoing research of the authors. If suitable design changes
are implemented and attractive facilities provided, the longer travel time can potentially be
seen as an opportunity to facilitate positive utility of travel, which is an emerging transport
concept that studies how passengers derive benefits from their travel.
From a ferry terminal facility point of view, a passenger can reasonably expect sheltered
seating areas, information centres, toilets, and perhaps food kiosks. Many modern piers
include these facilities as part of the design. Branding of these piers with a uniform design
language consistent with the wider public transport network is also important for increasing
awareness of services and legibility. For instance, the addition of river services to the London
Underground map was part of a plan to increase awareness of water transit options (Figure
8). Finally, an important aspect regarding public perception is the perceived safety of water
transit compared to other modes. Cities like Hamburg are seen to emphasize this and ferries
are equipped with life boats, life jackets and modern radar and Automatic Identification
Systems (AIS) systems.
10Figure 8 River transfer points highlighted on London Underground map. Source: TfL (2017)
Vessel design
Vessel design depends on several factors such as operating route, traffic volume and climate.
Ideally a vessel should be stable during loading operations and during motion against all wave
headings, have low resistance, and be accessible for all passengers. Around the world, vessels
are a mix of monohulls (Copenhagen, Gothenburg and Hamburg) and catamarans (Brisbane,
Amsterdam, London and Auckland. Those in Rotterdam and Brisbane have slender hulls
designed to generate minimal wake, which is beneficial where wake wash and erosion is a
potential limitation to operation in urban waterways. The hull material is also an important
factor and needs special attention based on local conditions. While a lighter hull entails
having a larger capacity, lower fuel costs and cheaper construction, on the other hand it
suffers from poor stability as the draught becomes dependent on the payload. Given present
technology, heavier hulls are the material of choice recommended for year-round ice
operations, while light hulls are favoured for efficiency gains in non-ice conditions. As such,
materials vary from hardened steel in Stavanger, to a combination of an aluminium hull and
fibre superstructure in Sydney and Brisbane. Furthermore, for a vessel that operates year-
round in ice conditions, service operation would need to be more robust in the absence of
appendages such as open water propellers and rudder stocks which are susceptible to
damage. Such implementations can be seen in new vessels at Gothenburg that use azimuthal
shrouded propellers.
As part of the Waterway365 (Stenius et al 2014) project in Stockholm a number of potential
designs have been investigated for suitability. One concept, the CityBoat design for inner city
transport, favoured a monohull design. The form of the hull, with focus on stem angle, rake
angle and flare angle are important considerations in terms of achieving a low resistance
profile, particularly in ice conditions. New innovative designs are also continuingly being
developed and refined. For example, the BB Green electric vessel design currently under trial
in Stockholm has a hull that uses an air cushion to reduce drag and wake formation (BBGreen
112016). But there is further scope for investigation regarding the choice of hull as there are
other factors that need to be considered. This is part of ongoing research within the
Waterway365 project at KTH.
Another important consideration in vessel design is the internal passenger spaces. General
arrangements including places for seated and standing passengers, areas for bicycles, safety
box, driver compartment, luggage stowage and toilet are potential factors to consider. While
the number of passengers and bicycles for each trip are variable, it is important to maintain a
high cabin ratio for sustainable operations. In Stockholm, the public transport authority SLL
states requirements of 150 passengers, 40 bikes and room for 50 additional standing
passengers, which would form the basis for computing minimum dimensions of a suitable
vessel. Such specification could aid in the development of modular design concepts for
different internal arrangements for different route types and dictate customized design
details such as foldable seats or collapsible cycle racks.
Operating costs
The operating costs and manpower used is also an area with a potential for improvement in
water transport. Due to regulations, typically a ferry in Stockholm needs two or more
operators and, in general, the salary of a sea operator is higher than his land based
counterpart. It therefore may be possible to lower operational costs if the manpower on
board vessels could be reduced. There have been some efforts in reducing the crew size in
other cities and can be seen in Gothenburg where ferries are designed to work with a crew
size of two. Hamburg currently operates vessels by the captain alone who also operates the
hydraulic gangway for passenger loading and unloading. Amsterdam is currently testing and
developing self-driving boats, although the practical application in passenger vessels is still a
future prospect.
In terms of propulsion technologies there is also scope for improvement, and there are a
number of positive initiatives within water transport. In Hamburg and Stockholm older
vessels have been modified to run on hybrid electric power. Hybrid vessels in Sydney and San
Francisco have been seen to use solar power in addition to conventional power. In Stavanger,
new hybrid electric boats added to the fleet are being designed such that their power
systems have a DC grid that adds flexibility in terms of later conversion to hybrid or purely
electric power. In Hamburg, a hydrogen fuel cell based ferry has been introduced. However,
while some ferries now run with low or zero emissions, it is nevertheless important to
consider the entire life cycle from battery production to disposal and its impact on the
environment.
In addition to environmental considerations, economic sustainability is a practical factor that
needs to be considered. A proposal has been to replace existing diesel fuel with
(Hydrogenated Vegetable Oil) HVO, similar to the buses in Stockholm. But the shift of fuel
source is set to raise costs by 60%. Similarly, in terms of adopting alternatives like fuel cells
and electric power, the associated costs of supporting infrastructure and fuel sourcing might
make the changes economically unviable. Furthermore, the low payload-equipment ratio is a
12particular limitation in electric power for water transport applications. The current limitations
on technology make the batteries considerably heavy and often they weigh as much as 160%
of the payload. While it can be argued that the loss in weight due to the battery can be
counteracted by taking a higher payload, it is important to consider that area plays as much
an important role as displacement does. Theoretically, it would be possible to increase the
displacement to maintain a high payload despite the battery but with possible associated
increased resistance and higher fuel consumption.
Study examples and methodology
In the report’s main section that follows, a selection of waterborne transit systems in cities
across the world are described. In total, 23 cities were chosen as part of this compilation
which represent the breadth of experience in planning and operating water transport
currently available. The contents of this report consist of data collected from various sources,
including transit operator’s official websites, as well as transport planning and technical
reports and relevant academic publications. This report also builds on previous studies at KTH
investigating the use of inland waterways in an expanded transport function. In summer
2014, a study by students of KTH and Konstfack University of arts, craft and design, in
collaboration with Vattenbussen AB was conducted. The purpose of the study was to test the
feasibility of concepts introduced in the previous Waterway 365 study, Stenius et al. 2014. As
part of this work some existing waterborne transportation systems were investigated and
data on their operations complied. Furthermore, in November 2015, Stockholm County
Council carried out an internal study to explore the feasibility of new experimental water
transport lines and the possibility of developing next generation ferries. As part of the current
joint research between KTH, Vattenbussen and Stockholm County Council, this report has
been aided by data from the above-mentioned reports and referenced accordingly.
The cities chosen for this report were broadly categorized into three major categories: large
scale, medium scale and small scale operations, based on the number of routes, passengers
served and the overall scale of the water transport system. The demarcation of cases is as
follows:
Large scale (13 cases) (>7 lines, high number of stops)
• Amsterdam
• Auckland
• Brisbane
• Hong Kong
• Istanbul
• Izmir
• London
• New York
• San Francisco
13• Seattle
• Stavanger
• Sydney
• Venice
Medium scale (6 cases) (4 – 6 lines, medium number of stops)
• Copenhagen
• Gothenburg
• Hamburg
• Rio de Janeiro
• Stockholm
• Vancouver
Small scale (4 cases) (1-3 lines, limited number of stops)
• Boston
• Oslo
• Rotterdam
• Wellington
The references to data and pictures used in the presentation of the different cases are
summarized under the headings CASE REFERENCES and IMAGE REFERENCES in the end of
the report. There they follow under the heading of the cities respectively.
14LARGE SCALE WATER TRANSIT NETWORKS
AMSTERDAM
NETHERLANDS
Population 842,343
Area (urban) 350 km2
Density 4,908 per km2
Route type A,B
Ferry routes 9
Terminals 15
Passengers -
Public transport network overview
The public transport network is managed by
GVB in Amsterdam which includes metro rail,
tram, bus and ferry services. Fare collection is
by rechargeable smart card, single ticket or
day pass. The ticket system is integrated with
other public transportation and the same
ticket can be used for transfer between other
public transport modes without cost penalty.
Ferry system overview
The vessels in Amsterdam are catamarans that are equipped to carry people, mopeds and bicycles
with full disability access. There is a total of 15 vessels in service which are all catamarans.
Features Operational characteristics
Vessel 150 (inside/outside) Operating time 6am – 10pm
capacity Peak periods 6am-9am
Vessel Toilet, tables, priority 4pm-7pm
facilities seating, bicycle area Frequency 10 – 20 mins peak
45 mins off peak
Terminal Static signage, digital Fare $4 USD
facilities signage, real time signage,
ticket machine, disability
access, luggage storage
Additional information
The city of Amsterdam has numerous canals traversed by canal tour boats and pleasure crafts. The
water is viewed as an economic resource and there is high drive towards waterfront development.
There is also active research with respect to autonomous crafts that is set to debut in 2017.
15AMSTERDAM
NETHERLANDS
16AUCKLAND
NEW ZEALAND
Population 1,454,300
Area (urban) 559.2 km²
Density 2,600 per km2
Route type A,B
Ferry routes 10
Terminals 20
Passengers 5,500,000
Public transport network overview
The public transportation network in
Auckland is run by AT, a government
organisation. However, the ferries are
managed by Fullers and other private
companies. Other available transit options
include metro rail and bus. Fare collection is
by rechargeable smart card, single ticket or
day pass. The ticket system is integrated with
other public transportation and the same
ticket can be used for transfer to and from
ferries between other public transport
modes without cost penalty.
Ferry and terminal overview
There are several types of ferries operating in Auckland. They are all catamaran type vessels
equipped to carry passengers, bicycles, and have disability access.
Features Operational characteristics
Vessel 401 (331 seated) Operating time 6am – 10pm
capacity 14 bicycles Peak periods 6am-10am
Vessel Tables, priority seating 4pm-8pm
facilities Frequency 30 mins peak
Terminal Static signage, ticket 60 mins off peak
facilities machine, disability access, 150 mins off peak
weekend
Fare $4 USD
Additional information
The city of Auckland develops a strategic plan for ferry system development every 10 years. Under
the current plan, there is a focus to prioritize high frequency public transport, transform and
elevate customer focus and experience, build network optimisation and resilience and ensure a
sustainable funding model. The newer high speed catamaran ferries are equipped with a large café
and four toilets catering to the needs for handicapped commuters and other commuters.
17AUCKLAND
NEW ZEALAND
18BRISBANE
AUSTRALIA
Population 2,308,700
Area (urban) 15,826 km2
Density 2,600 per km2
Route type A,B
Ferry routes 5
Terminals 24
Passengers 6,250,000
Public transport network overview
The public transportation in Brisbane is run
by TransLink which includes a network of
bus, metro rail and ferry services. Transdev
Brisbane Ferries manage the ferry services.
Different modes are integrated together and
there is no penalty for transfer between
modes. Ticketing is done by smartcard (86%)
or single paper tickets and prices are the
same for each mode.
Ferry and terminal overview
There are three types of vessels operating in Brisbane. First, the CityCats are high speed
catamarans covering the whole river (top). Second, the CityFerries are slower monohull vessels
used in the inner city route (bottom). Finally, CityHoppers are similar vessels to CityFerries which
are used on cross river services. The fast City Cats are designed to compete with other means of
transportation in terms of travel time. They have an aluminum hull with a fiber superstructure for
lighter weight.
Facility features Operational characteristics
Vessel Catamarans 149-162 Operating time 5am-12am (until 1am
capacity Monohull: 53-78 Friday/Saturday)
Seating in/out Peak periods 6am-9am
Vessel Disability access and 4pm-7pm
facilities space for six wheelchairs, Frequency 5-15 mins peak
priority seating, WiFi 30 mins off peak
Terminal Static signage, ticket Fare $2.60 - $3.00 USD zone
facilities machine, disability access based (prepaid/paper);
at most terminals Free inner city
“CityHopper” service)
Additional information
Vessels are often branded in local sporting team livery which strengthens the iconic nature of the
service in Brisbane. Tourism and leisure use are popular demonstrated by strong use outside peak
periods and weekends.
19BRISBANE
AUSTRALIA
20HONG KONG
CHINA
Population 7,234,800
Area (urban) 2,755 km2
Density 6,544 per km2
Route type A,B,C
Ferry routes 6
Terminals 7
Passengers 29,900,000
Public transport network overview
Public transport is run by the Transport
Department, Hong Kong Government. Other
available transport includes an extensive metro, rail
and bus network. Ferries now mainly serve a
supplementary role and as a lifeline to outlying
islands with no other transport options. Tickets can
be purchased at terminals or through an integrated
electronic portal available via the internet.
Ferry and terminal overview
There are now 11 ferry operators providing 18 licensed passenger ferry services to outlying islands
and across the harbour. There remains two franchised ferry services operated by "Star Ferry”
between Central and Tsim Sha Tsui as well as between Wan Chai and Tsim Sha Tsui. The ticket
system is not integrated with other public transportation means. Separate tickets need to be
purchased for the use of ferry services.
Facility features Operational characteristics
Vessel capacity 288 - 762 Operating time 0730 - 2220
Vessel facilities Disability access, toilets, café, Peak periods 7.30am – 9.30am
bicycle racks (only some 4pm – 6pm
ferries at specific times) Frequency 8 mins (peak)
Terminal Static signage, ticket machine, 20 mins (off peak)
facilities food kiosks Fare $0.30 – 0.50 USD
$1.60 USD for bicycle
Additional information
Most recent focus on transport development has been on land based modes, with little investment
in vessel or terminal infrastructure to modernise services. In addition, widespread land reclamation
has hindered access to waterfront and ferry services. Ferry services amount to 5% of total
transportation.
21HONG KONG
CHINA
22ISTANBUL
TURKEY
Population 14,025,646
Area (urban) 1,539 km2
Density 2,691/km2
Route type A,B, C
Ferry routes 7
Terminals 14
Passengers ~40,000,000
Public transport network overview
The public transportation in Istanbul comprises of
metro rail, trams, buses and ferries. The ferries
are operated by Sehir Hatları which is a private
company. In total there are 7 ferry lines operating
in the city. The public transportation is run by the
government. The ticket system is not integrated
with other public transportation means and
separate tickets need to be purchased for use of
ferry services.
Ferry and terminal overview
The ferry vessels operating in Istanbul are monohulls and have large capacities. Some of the old
vessels have now been replaced by fast catamarans.
Facility features Operational characteristics
Vessel capacity 600 - 2100 Operating time 7am – 11pm
Vessel facilities - Peak periods 6am-9am
Terminal Static signage, ticket machine 4pm-7pm
facilities Frequency 20 mins all day short
distance
45 – 90 mins long
distance services
Fare $2.80 – $4.00 USD
Additional information
The city has a long history of water transport in the Bosphorus. While the existing fleet runs on
fossil fuels, Sehir Hatları has started working on a new program to add new lines and procure new
cleaner fuel vessels, and covert existing vessels to run on green energy.
23ISTANBUL
TURKEY
24IZMIR
TURKEY
Population 2,847,691
Area (urban) 7,340 km2
Density 390 per km2
Route type A, B, C
Ferry routes 11 (A, B)
3 (C)
Terminals 8
Passengers 600,000
Public transport network overview
Public transport ferries are managed by
Ideniz in Izmir. Fare collection is by a
rechargeable smart card system called
Kentkart. There are also single ticket or day
passes. There is also an option to pay using
a mobile application. The ticket system is
integrated with other public transportation
and Kentkard holders get discount rates
compared to paper ticket holders. There are
14 ferry routes serviced by 18 vessels.
Ferry and terminal overview
The ferries operating in Izmir are a mix of old and modern vessels. The new vessels are large
capacity catamarans and medium capacity monohulls while the older vessels have a traditional
monohull design.
Facility features Operational characteristics
Vessel 140 – 426 Operating time 7 am – 12 am
capacity (inside/outside) Peak periods 8 am – 10 am
Vessel Toilets, priority seating, 4 pm – 7 pm
facilities bicycle area Frequency (mins) 15 mins peak
25-30 off peak
Terminal Static signage, ticket Fare $0.80 – 1.30 USD
facilities machines
Additional information
Integration of the public transport system occurred in 1999. The city has set new transport network
goals for 2030, including setting up new terminals and making industrial and tourist sites more
accessible.
25IZMIR
TURKEY
26LONDON
ENGLAND
Population 8,673,713
Area (urban) 1,572 km2
Density 5,518 per km2
Route type A, B
Ferry routes 6 (A)
1 (B)
Terminals 28
Passengers 4,300,000
Public transport network overview
The public transport boat network in London is
managed by Transport for London (TfL). Ferries
themselves are operated b a private company
MBNA Thames Clippers. Fare collection is by
rechargeable smart card, single ticket or day pass.
There is also an option to purchase tickets via a
mobile app. The ticket system is partially
integrated with other public transportation
means, with efforts ongoing to achieve full
integration. There are 7 ferry routes serviced by
15 vessels.
Ferry and terminal overview
Boats operating in London are slender, low wake catamaran vessels. The vessels lack a sun deck but
there is some outdoor seating at the rear of the vessel. The seating capacity is limited by the number
of seats as it is local regulation to have all passengers seated during operation.
Facility features Operational characteristics
Vessel 150 (inside) Operating time 6 am – 10 pm (wd)
capacity 11 am – 8 pm (sun)
Vessel Priority seating, bicycle Peak periods 7 am – 10 am
facilities area, on board shop selling 4 pm – 7 pm
food and drinks including Frequency 20 mins peak
alcohol, airline style seating 30 -60 mins peak
Terminal Digital signage, ticket Fare $5.50 – $10.30 USD
facilities machines, staffed
information kiosk
Additional information
The Thames Clippers ferry system has an extensive marketing strategy to promote its “premium”
service including converting ferries into movie/football club themed vessels for special occasions and
other charter options. Additional services are provided for events at the O2 stadium.
27LONDON
ENGLAND
28NEW YORK
USA
Population 8,550,405
Area (urban) 1,213.37 km2
Density 416 per km2
Route type A, B
Ferry routes 2
Terminals 8
Passengers 1,200,000
Public transport network overview
The East River public water transit network is
managed by NY Waterway which is a private
company. Fare collection is by pre-purchased
single or seasonal tickets that can be bought
online, or paper tickers via ticket machines at
piers. The ticket system is not currently integrated
with other public transportation. There are 4
routes planned with 2 currently operating and
another set to open in August 2017 (Astoria
route).
Ferry and terminal overview
The ferries initially operating on the new East River route were re-purposed monohull vessels. They
have enclosed space as well as a sun deck. Purpose built vessels have been designed and constructed
and are due to go into operation in 2017.
Facility features Operational characteristics
Vessel 150 (inside) Operating time 6 am – 9 pm
capacity Peak periods 6 am – 10 am
Vessel Priority seating, bicycle 2 pm – 7 pm
facilities area, sun deck, WiFi (new Frequency 20-30 mins peak
vessels) 30 mins off peak
Terminal Digital signage, ticket Fare $9 - $21.50
facilities machines, bus connection
Additional information
There are currently ongoing talks with respect to integrating the services with other public
transportation for a citywide common ticketing system.
29NEW YORK
USA
30SAN FRANCISCO
USA
Population 864,816
Area (urban) 600.6 km2
Density 7,124 per km2
Route type A, B, C
Ferry routes 8 routes operated by 6
companies
Terminals 11
Passengers 2,772,500 (Blue & Gold)
2,545,122 (Golden Gate)
Public transport network overview
Ferries in San Francisco are operated by several private
companies, of which Blue and Gold Fleet and Golden
Gate Fleet are the largest. Fare collection is by single
ticket or day pass. The ticket system is not integrated
with other public transportation. There are 11 ferry
routes serviced by 8 vessels by Golden Gate while Blue
and Gold comprises 20 vessels operating on tourist and
commuter routes.
Ferry and terminal overview
The ferries operating under the Golden Gate Fleet are a mix of refurbished monohulls and newly
acquired catamarans, whilst the Blue and Gold Fleet are a mix of new monohulls and catamarans.
Facility features Operational characteristics
Vessel 400-750 (inside and outside) Operating time 6 am – 9 pm
capacity 72 bicyccles Peak periods 6 am – 10 am
149-788 (inside and outside) (Blue 4.30pm – 6.30pm
& Gold) Frequency (mins) 20-35 mins peak and
Vessel Interior and exterior seating, off peak
facilities toilets, refreshment stand, security Fare $7.00 – $11.00 USD
cameras, bicycle racks, modern
accessibility lift
Terminal Static signage, ticket machines
facilities
Additional information
There are plans towards expanding the ferry system by increasing the frequency and number of serviced
routes due to increasing congestion on land based transportation. However, a corresponding challenge
is with respect to congestion owing to the large number of craft currently operating in the bay area.
Simulation studies show different scenarios and respective congestion and is still under investigation.
31SAN FRANCISCO
USA
32SEATTLE
USA
Population 684,451
Area (urban) 369.2 km2
Density 3,151 per km2
Route type B, C
Ferry routes 8
Terminals 20
Passengers 23,000,000
Public transport network overview
Seattle ferries are managed by ‘Washington State
Ferries’. Fare collection is by single ticket or a long-
term pass. The ticket system is not integrated with
other public transportation. There are 20 ferry routes
serviced by 24 vessels.
Ferry and terminal overview
The ferries operating under the Washington State Ferries are large capacity monohulls with some ferries
having space for carrying cars as well.
Facility features Operational characteristics
Vessel 199 – 2500 (inside and Operating time 4 am – 9 pm
capacity outside) Peak periods 6 am – 11 am
34 – 202 cars 4.30pm – 10pm
Vessel Interior and exterior seating, toilets, Frequency (mins) 40 – 80 mins peak
facilities refreshment stand, modern accessibility Limited service off
lift peak
Terminal Static signage, ticket machines Fare $3.30 - $19.45 USD
facilities
Additional information
Recent studies have indicated the importance of ferries in the area’s mobility and access, with the
economic importance to the mainland industry also identified. New research is currently being conducted
to design measures to expand the ferry system to further these objectives.
33SEATTLE
USA
34STAVANGER
NORWAY
Population 130,426
Area (urban) 71 km2
Density 1,800 per km2
Route type B, C
Ferry routes 9
Terminals 46
Passengers 4,200,000
Public transport network overview
The public transportation using ferries in
Stavanger is operated by Kolombus. However, the
ferries are owned by Norled who own over 80
vessels operating all over Norway. Fare collection
is by single ticket or a long-term pass through a
mobile application or a smart card. The ticket
system is integrated with other public
transportation.
Ferry and terminal overview
The ferries operating in Stavanger are a mix of monohull car carriers and fast catamarans. There are 46
ferry routes serviced by 24 vessels.
Facility features Operational characteristics
Vessel 180 – 296 Operating time 5 am – 11 pm
capacity (catamarans) Peak periods 5 am – 7 am
398 (car carriers) 4 pm – 8 pm
106 cars Frequency (mins) 5-15 mins peak
Vessel Interior and exterior seating, 60-90 off peak
facilities toilets Fare $7 USD
Terminal Static signage, ticket machines
facilities
Additional information
There is great emphasis on the deteriorating ecosystem in the fjords and efforts to modernize the
existing fleet and convert them to green energy vessels. Norled has designed several such craft which
can be found serving in the fleet.
35STAVANGER
NORWAY
36SYDNEY
AUSTRALIA
Population 4,921,000
Area (urban) 12,367 km2
Density 372 per km2
Route type B, C
Ferry routes 8
Terminals 39
Passengers 14,700,000
Public transport network overview
The ferry network in Sydney is operated by Harbour City
Ferries which is a private consortium contracted by
Trasnport NSW, a government authority. Transport NSW
also runs rail and bus services. Fare collection is by single
ticket or a long-term pass through a mobile application
or smart card. The ticket system is integrated with other
public transportation means. There are 39 ferry routes
serviced by 28 vessels. Further, 6 more ferries are
currently being procured.
Ferry and terminal overview
The ferries operating in Sydney are older style monohulls with multiple enclosed decks and a sun deck.
The new ferries that are under procurement will be faster catamarans to cater for the increased demand
for better travel times.
Facility features Operational characteristics
Vessel 300 (old ferries) Operating time 5 am – 11 pm
capacity 400 (new ferries) Peak periods 5 am – 7 am
Vessel spacious interior with comfortable 4 pm – 8 pm
facilities inside seating, outdoor viewing areas, Frequency (mins) 15 mins peak
a large walk around deck and 30 - 90 mins off peak
additional features for passengers; Fare $4.30 – $6.50 USD
including Wi-Fi access and real-time
journey information, and charging
stations for electronic devices.
Terminal Digital signage, ticket machine, staffed
facilities information kiosk
Additional information
Ferry customers report the highest level of customer satisfaction of any public transport mode in
Sydney. Travel time, systems and efficiency and comfort were marked as important towards customer
satisfaction. Ferry demand peaks at areas where job and recreational activities are concentrated. There
are some private fast ferry services that charge a premium price that are also popular.
37SYDNEY
AUSTRALIA
38VENICE
ITALY
Population 264,579
Area (urban) 414.57 km2
Density 640 per km2
Route type A
Ferry routes 24
Terminals 67
Passengers 55,000,000
Public transport network overview
The vaporetto public transport ferry service is
operated by ACTV, a public company. Fare
collection is by single ticket or a seasonal pass. The
ticket system is integrated with other public
transportation. There are 67 ferry routes serviced
by 99 vessels.
Ferry system overview
The ferries operating in Venice are monohulls built between 1955 and 2004 with some of the older ferries
no longer in service. Through the years they have maintained a similar design with a slender hull and no
sun deck.
Facility features Operational characteristics
Vessel 210 (inside) Operating time 5 am – 11 pm
capacity Peak periods 5 am – 7 am
Vessel Inside seating, outdoor viewing areas 4 pm – 8 pm
facilities Frequency (mins) 5-15 (Peak)
60-90 (Off Peak)
Terminal Static signage Fare $7.80 USD
facilities
Additional information
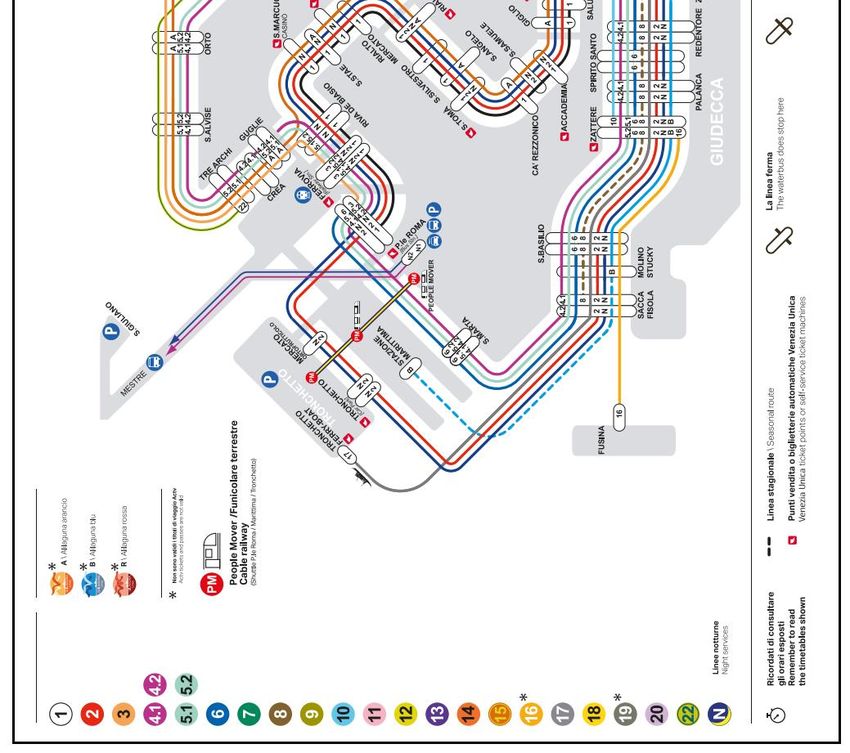
A simplified version of the network is supplied to aid in scale comparison only. A more detailed transit
route map is also provided.
39VENICE
ITALY
40VENICE
ITALY
4142
MEDIUM SCALE WATER TRANSIT
NETWORKS
COPENHAGEN
DENMARK
 Population                 562,379
 Area (urban)               615.7 km2
 Density                    6,800 per km2
 Route type                 A,B
 Ferry routes               3
 Terminals                  10
 Passengers                 500,000

Public transport network overview

Movia operates harbour buses which are
part of the public transportation network.
They are contracted by the local department
of transport, which is also responsible for
metro rail and bus services. The ticket
system is integrated with other public
transportation means with no penalty for
transfer between modes.

Ferry and terminal overview

There are 3 lines and 10 destinations operated by 4 vessels. The three boats are becoming more
popular each year with together over half a million passengers annually, most of which use the
boats in summer. The last three years the number of passengers in the three summer months
increased by approximately 10,000 per month. Up to 3,500 passengers use the harbor buses on
Saturdays during the summer months.

 Facility features                                   Operational characteristics
 Vessel              64-80                           Operating time       7am-11pm
 capacity            20 bicycle spaces               Peak periods         No differentiated peak
 Vessel              Full disability access on all                        schedule
 facilities          vessels                         Frequency            40 mins all day
 Terminal            Static signage, full            Fare (USD)           $3.65 USD fixed entire
 facilities          disability access at all                             route
                     terminals

Additional information

One cross river line runs on an as needed basis for patrons of the waterfront opera house. There is
an emphasis on land development linked to the areas served by the boats. Tourist use is also
popular.

                                                     43
COPENHAGEN
DENMARK
44GOTHENBURG
SWEDEN
Population 549,789
Area (urban) 447.76 km2
Density 1,200 per km2
Route type A,B,C
Ferry routes A,B
Terminals 6
Passengers 800,000
Public transport network overview
The ferry network in Gothenburg is operated by
Västtrafik which is a public company. Fare collection is
by single ticket seasonal ticket via smart card. The ticket
system is integrated with other public transport
including bus and tram services. Of the existing lines,
one line is operated free of charge as it acts as a bridge
between two key destination Stenpiren and
Lindholmspiren.
Ferry and terminal overview
The fleet is a mix of old and new vessels with the newer catamaranscapable of withstanding
ice loads. The ferries on Route Type B are double ended. Recently they have tested the use of
HVO as a fuel on the ferry Buro with success. All ferries have a sun deck as part of the design.
Facility features Operational characteristics
Vessel 298 Operating time 6 am – 10 pm
capacity 80 bikes Peak periods 5 am – 10 am
Vessel spacious interior with comfortable 3 pm – 6 pm
facilities inside seating, outdoor viewing areas, a Frequency (mins) 15 – 20 (Peak)
large walk around deck and additional 30 (Off Peak)
features for passengers; including real- Fare $4 USD
time journey information and priority
seating designations.
Terminal Digital signage
facilities
Additional information
In 2012, a city development plan– ‘River City Gothenburg’ was centred around the concept of developing
infrastructure around the River Göta along with adding new service routes and facilitating land development.
45GOTHENBURG
SWEDEN
46HAMBURG
GERMANY
Population 1,774,242
Area (urban) 755 km2
Density 2,300 per km2
Route type A,B
Ferry routes 3 (B)
4 (A)
Terminals 22
Passengers 8,000,000
Public transport network overview
The public transportation ferries in Hamburg are
operated by HVV which is a public company. However,
the ferries are owned by HADAG. Fare collection is by
single ticket or seasonal pass. The ticket system is
integrated with other public transportation. There are
7 ferry routes serviced by 24 vessels.
Ferry and terminal overview
The fleet is a mix of old and new monohull vessels. However, the old vessels
underwent refurbishment and were retrofitted with new superstructures.
All ferries had side docking arrangements with new ferries having forward
and aft thrusters.
Facility features Operational characteristics
Vessel 200-400 (inside and outside) Operating time 5 am – 10 pm
capacity 20 cycles Peak periods 5 am – 8 am
Vessel Inside and outside seating, top 3 pm – 6 pm
facilities outdoor deck with cafeteria style Frequency (mins) 15 mins peak
seating. One man ferry operation 30 mins off peak
Terminal Static signage, ticket machines Fare $3 USD
facilities
Additional information
Hamburg operates a network of ferry routes that link together and require transfers for some journeys. Ferries
linking the employment hub of Airbus on the waterfront is popular. Hamburg is currently looking at fleet
modernization and are exploring usage of zero emission ships including hydrogen fuel cell technology.
47HAMBURG
GERMANY
48RIO DE JANIERO
BRAZIL
Population 12,280,702
Area (urban) 1,221 km2
Density 2,705 per km2
Route type B
Ferry routes 6
Terminals 5
Passengers -
Public transport network overview
Ferries in Rio de Janeiro are operated by CCR Barcas
which is a private company but under contract from the
government body Rio Trillhos. Fare collection is by single
ticket or seasonal pass. The ticket system is not
integrated with other public transportation. There are 6
ferry routes serviced by 19 vessels.
Ferry and terminal overview
The ferries operating in the city are a mix of small and larger catamarans that were
newly acquired. Old vessels are monohulls with large capacity and multiple decks.
Facility features Operational characteristics
Vessel 237 – 645 (Small catamarans and Operating time 5 am – 12 pm
capacity monohulls) Peak periods 6 am – 10 am
1300 – 2000 (Large Catamarans and 5 pm – 8 pm
monohulls) Frequency (mins) 10 mins peak
Vessel Spacious interior with comfortable inside 20 – 60 mins off peak
facilities seating, outdoor viewing areas Fare $5 USD
Terminal Static signage, ticket machines
facilities
Additional information
The city is looking at expanding its ferry network and have ordered 7 new high speed vessels from China.
49You can also read