Upper Missouri River Basin July 2019 Calendar Year Runoff Forecast
←
→
Page content transcription
If your browser does not render page correctly, please read the page content below
Upper Missouri River Basin
                      July 2019 Calendar Year Runoff Forecast
                                          July 5, 2019

                   U.S. Army Corps of Engineers, Northwestern Division
                         Missouri River Basin Water Management
                                       Omaha, NE

Calendar Year Runoff Forecast
Explanation and Purpose of Forecast

The long-range runoff forecast is presented as the Calendar Year Runoff Forecast. The Calendar
Year Runoff Forecast is available at http://www.nwd-mr.usace.army.mil/rcc/reports/runoff.pdf.
This forecast is developed shortly after the beginning of each calendar year and is updated at the
beginning of each month to show the actual runoff for historic months of that year and the
updated forecast for the remaining months of the year. This forecast presents monthly inflows in
million acre-feet (MAF) from five incremental drainage areas, as defined by the individual
System projects, plus the incremental drainage area between Gavins Point Dam and Sioux City.
Due to their close proximity, the Big Bend and Fort Randall drainage areas are combined.
Summations are provided for the total Missouri River reach above Gavins Point Dam and for the
total Missouri Basin above Sioux City (upper Basin). The Calendar Year Runoff Forecast is
used in the Monthly Study simulation model to plan future system regulation in order to meet the
authorized project purposes throughout the calendar year.

Observed Runoff

June upper Basin runoff was 8.7 MAF, about 160% of the monthly average. Runoff was above
average in all reservoir reaches. Runoff in the Garrison reach was 3.9 MAF (144%) due to
above-normal precipitation that occurred near the end of May, some of which accumulated as
snow in the mountains. In addition, the Milk River Basin and the Missouri River tributaries from
Fort Peck to Garrison, excluding the Yellowstone River, received above-normal precipitation in
June. Although precipitation in the Oahe to Gavins Point reaches was predominantly below
normal, June runoff volumes continued to be above average. The Gavins Point reach received
about three times the average June runoff, following a similar departure in May. In the reach
from Gavins Point Dam to Sioux City, IA, runoff was more than four times the average June
runoff due to high streamflows on the Big Sioux, James, and Vermillion rivers caused by heavy
precipitation in May. Overall, the upper Basin has received 38.3 MAF of runoff as of July 1,
which is 232% of the normal July 1 volume. Compared to the long-term annual runoff record,
2019 runoff on July 1 would rank as the 6th highest annual runoff volume with six months of the
year remaining.

                                                1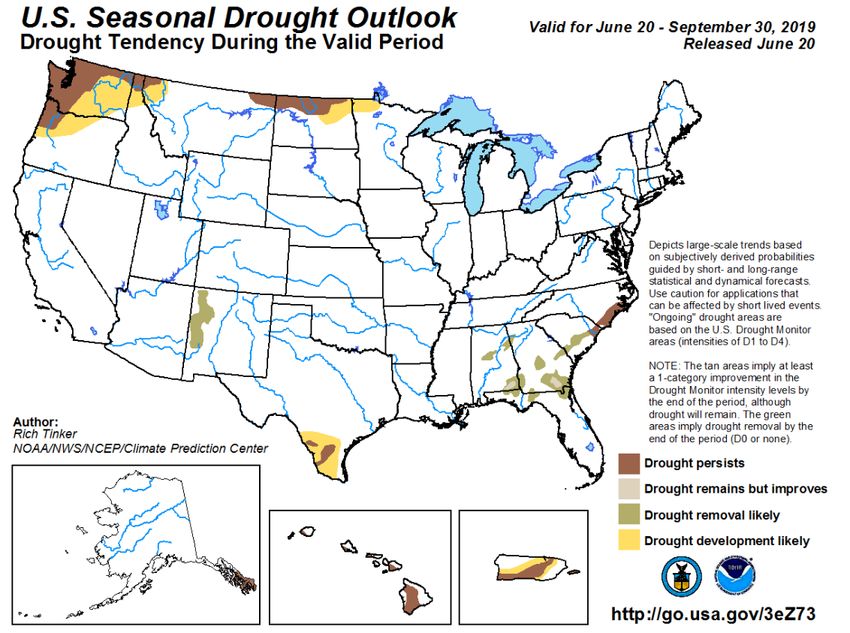
2019 Calendar Year Forecast Synopsis

The 2019 calendar year runoff forecast for the upper Missouri Basin above Sioux City, IA is 49.9
MAF, 197% of average. The 2019 calendar year runoff forecast above Gavins Point Dam,
which does not include runoff from the James, Vermillion and Big Sioux rivers, is 39.3 MAF,
170% of average. If realized, this would be the second highest runoff in 121 years of record-
keeping, exceeding 1997’s 49.0 MAF. The record is 61.0 MAF, set in 2011.

Due to the amount of variability in precipitation and other hydrologic factors that can occur over
the next 6 months, expected inflow could range from the 53.8 MAF upper basic forecast to the
46.3 MAF lower basic forecast. The upper and lower basic forecasts are used in long-term
regulation planning models to “bracket” the range of expected runoff given much wetter or drier
conditions, respectively. Given that six months are being forecast for this July 1 forecast (6
months observed/6 months forecast), the range of possible wetter-than-expected (upper basic)
and drier-than-expected (lower basic) conditions is attributed to all 6 reaches for the entire year,
particularly as it relates to summer and fall precipitation. The result is a range or “bracket” for
each reach, and thus, for the total runoff forecast.

Current Conditions
Drought Analysis

The National Drought Mitigation Center’s drought monitor for July 2, 2019 is shown in Figure
1. The drought monitor is available at http://droughtmonitor.unl.edu/. The Drought Monitor
shows some isolated areas of Abnormal Dryness (D0) near Lake Sakakawea in North Dakota,
and some Moderate Drought (D1) north of the lake; however, more the 98% of the Missouri
Basin is unaffected by drought or abnormally dry conditions.

The Seasonal Drought Outlook in Figure 2, which extends through the end of September,
indicates the abnormally dry conditions could persist in northeastern Montana and northern
North Dakota; however, no drought conditions are expected to develop by the end of September.

                                                 2
Figure 1. National Drought Mitigation Center U.S. Drought Monitor for July 2, 2019.

Figure 2. National Drought Mitigation Center U.S. Drought Seasonal Drought Outlook.

                                         3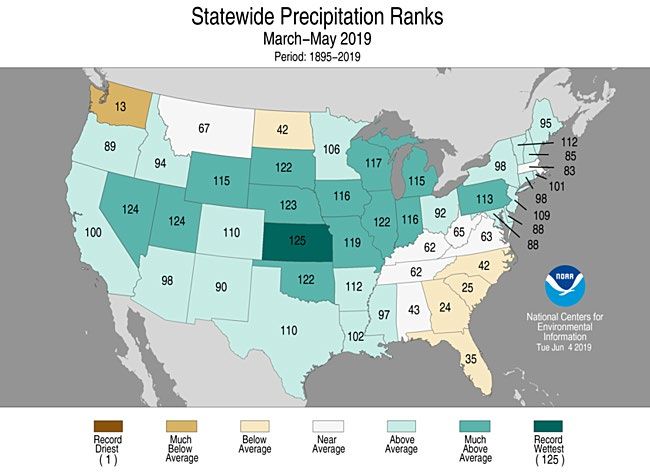
Precipitation

Monthly precipitation accumulations are shown using High Plains Regional Climate Center
images available at http://www.hprcc.unl.edu/. Precipitation as a percent of normal in June is
shown in the left image of Figure 3, and April-May-June precipitation as a percent of normal is
shown in the right image of Figure 3. June precipitation was much less than May precipitation.
Areas of above-normal precipitation occurred in northern Montana, northwestern South Dakota,
southern Nebraska, Kansas and western Missouri. It was greater than 150% of normal in
northeastern Montana and northwestern South Dakota. Below-normal precipitation occurred in
western Montana, central Wyoming, much of South Dakota, and western Iowa.

Figure 3. June 2019 and April-May-June 2019 Percent of Normal Precipitation. Source: High Plains Regional Climate
Center, http://www.hprcc.unl.edu/.

Statewide precipitation rankings in Figure 4 show that May 2019 was the wettest May in in 125
years of record-keeping in the states of Nebraska, Kansas, and Missouri, which subsequently
continued to experience flooding in May and June. May precipitation in Wyoming, South
Dakota, and Iowa was also much-above normal. The March – May precipitation rankings in
Figure 5 indicate the state of Kansas had the record wettest three-month period. South Dakota
and Nebraska ranked 122nd and 123rd, respectively, on a scale where a 125 ranking is the wettest
March – May.

                                                        4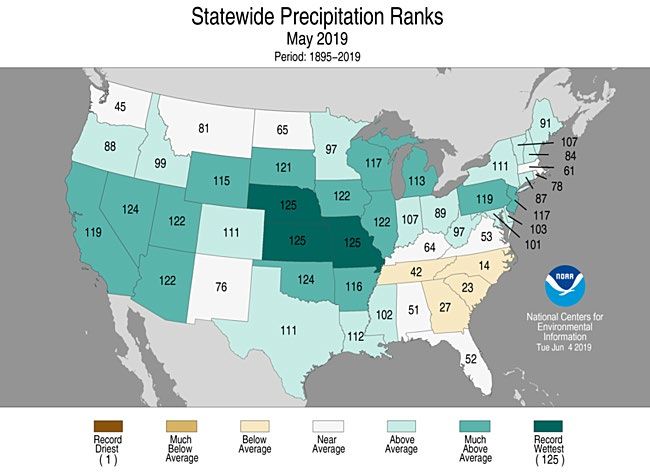
Figure 4. May 2019 Precipitation Statewide Ranking. Source: NOAA National Centers for Environmental
Information, https://www.ncdc.noaa.gov/temp-and-precip/us-maps/1/201905?products[]=statewidepcpnrank#us-maps-select

Figure 5. March-May 2019 Precipitation Statewide Ranking. Source: NOAA National Centers for Environmental
Information, https://www.ncdc.noaa.gov/temp-and-precip/us-maps/3/201905?products[]=statewidepcpnrank#us-maps-select

                                                          5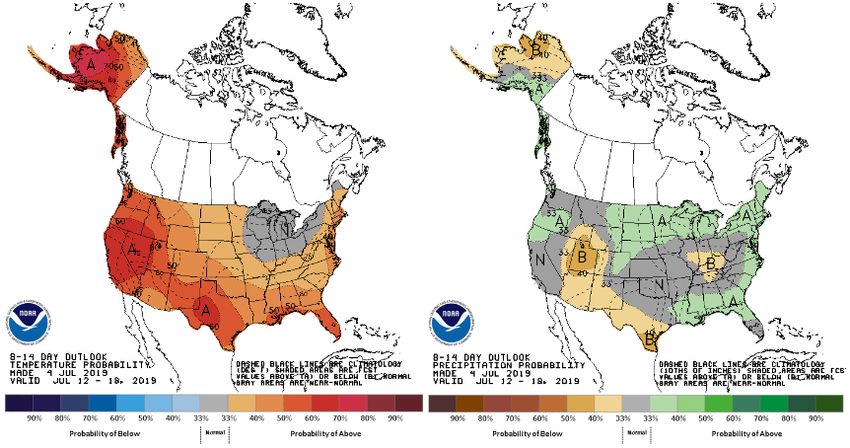
Temperature departures for June are shown in degrees Fahrenheit (deg F) in the left image of
Figure 6. June temperatures were within a few degrees of normal. Temperatures were slightly
cooler than normal in Montana and Wyoming, and temperatures were about normal in most other
areas. April-May-June temperature departures, shown in the right image of Figure 6, show the
colder-than-normal temperature pattern that has impacted much of the Missouri Basin this
spring. In most of the upper Basin, departures ranged from 1 to over 4 deg F below normal with
some areas experience departures more than 5 deg F below normal.

Figure 6. June 2019 and April-May-June 2019 Departure from Normal Temperature (deg F). Source: High Plains
Regional Climate Center, http://www.hprcc.unl.edu/.

Soil Moisture

Soil moisture is factored into the forecast as an indicator of wet or dry hydrologic basin
conditions. Typically, when soil moisture conditions are wet or greater than normal, rainfall and
snowmelt runoff is greater than when soil moisture is dry or less than normal. Not only is soil
moisture a physical parameter that influences runoff, it can be used as an indicator of future
runoff.

Figure 7 shows the June 30, 2019 NOAA NLDAS ensemble soil moisture anomaly and soil
moisture percentile. Based on the NLDAS soil moisture maps, soil moisture continues to be
much wetter than normal, particularly in central and eastern Montana, eastern Wyoming, and
northwestern South Dakota. Soil moisture is also wetter than normal in southern Nebraska,
Kansas, and Missouri. Total soil moisture exceeds the 95th percentile in parts of Montana,
northwestern South Dakota, southern Nebraska, Kansas, and northern Missouri. Consequently,
these areas will be susceptible to above-average runoff and flooding if intense rainfall occurs.

Figure 8 shows the June 30, 2019 NOAA CPC soil moisture anomaly and soil moisture
percentile. The CPC map indicates soil moisture is particularly wet in southern South Dakota,

                                                       6
Nebraska and Kansas with soil moisture exceeding the 95th percentile in these areas. In contrast
to the NLDAS maps, the CPC maps indicate that Montana and Wyoming soil moisture
conditions are not nearly as wet as in the NLDAS maps. Nevertheless, much of the upper and
lower Missouri Basin will be susceptible to above-average runoff and flooding based on the
wetter-than-normal soil moisture conditions.
Soil Moisture Anomaly (mm) Soil Moisture Percentile
Figure 7. NOAA NLDAS Soil Moisture Anomaly (mm) and Soil Moisture Percentile. Source: NOAA NLDAS Drought
Monitor Soil Moisture. http://www.emc.ncep.noaa.gov/mmb/nldas/drought/
Soil Moisture Anomaly (mm) Soil Moisture Percentile
Figure 8. NOAA CPC Soil Moisture Anomaly (mm) and Soil Moisture Percentile. Source: NOAA CPC.
https://www.cpc.ncep.noaa.gov/products/Soilmst_Monitoring/US/Soilmst/Soilmst.shtml
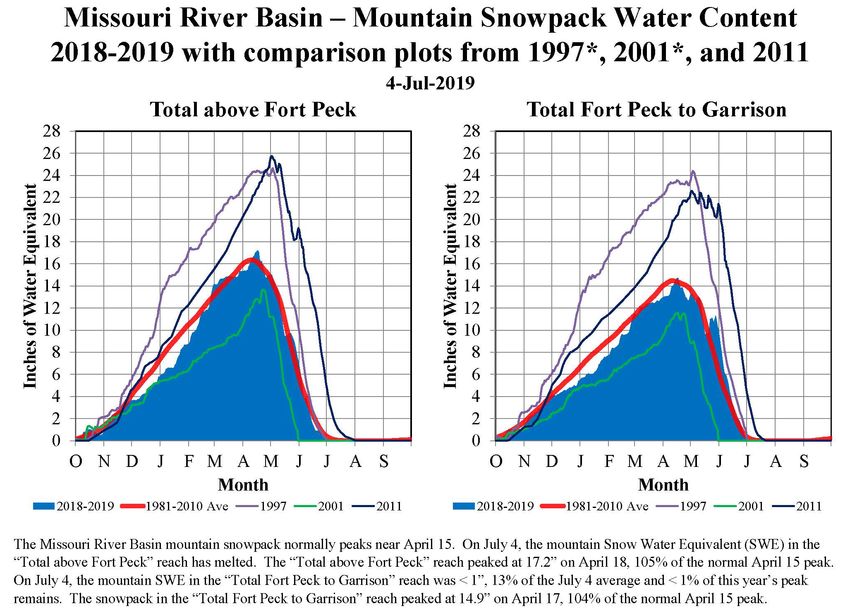
Mountain Snowpack
Mountain snowpack is the primary factor used to predict May-July runoff volumes in the Fort
Peck and Fort Peck to Garrison mainstem reservoir reaches. It is typically NOT a factor
influencing runoff at the beginning of a calendar year. Figure 9 includes time series plots of the
average mountain SWE beginning on October 1, 2018 based on the NRCS SNOTEL data for the
headwater basin above Fort Peck and the incremental basin from Fort Peck to Garrison. The
current average SWE values (shaded blue area) are plotted against the 1981-2010 basin average
SWE (bold red line), a recent low SWE year in 2001 (green line), and two historic high SWE
years occurring in 1997 (purple) and 2011 (dark blue).
7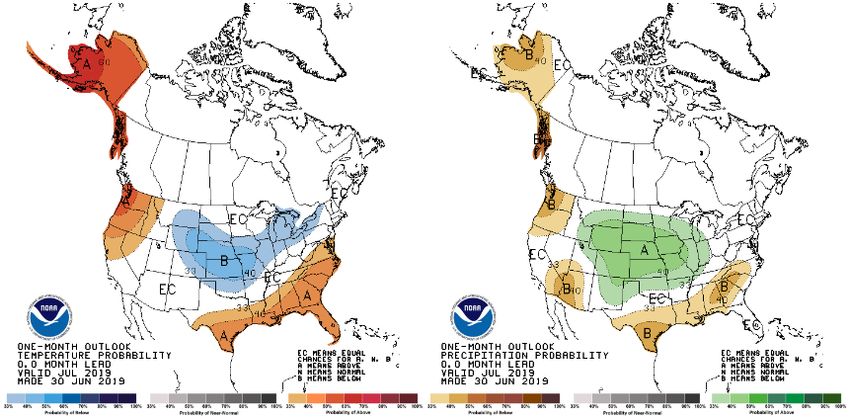
In the Fort Peck reservoir reach, mountain SWE peaked at 105% of average on April 18. In the
Garrison reservoir reach, mountain SWE peaked at 104% of average on April 17. The melt
occurred a bit slower than average due to the colder-than-normal temperatures in May and early
June.

As of July 4, only small amounts of the winter’s snowpack remained at the high elevation
SNOTEL sites. In the Fort Peck reach, the mountain snowpack had effectively melted. In the
Garrison reach, less than 1% of the peak accumulation remained.

Figure 9. Mountain snowpack water content on July 4, 2019 compared to normal and historic conditions. Corps of
Engineers - Missouri River Basin Water Management.

Climate Outlook
MRBWM participates in the monthly North Central U.S. Climate/Drought Outlook Webinar
coordinated through NOAA, the regional climate centers, and the American Association of State
Climatologists (AASC). These webinars provide updates on near-term climate outlooks and
impacts including the ENSO climate pattern and its implications on temperature and
precipitation patterns in the Missouri Basin.

                                                         8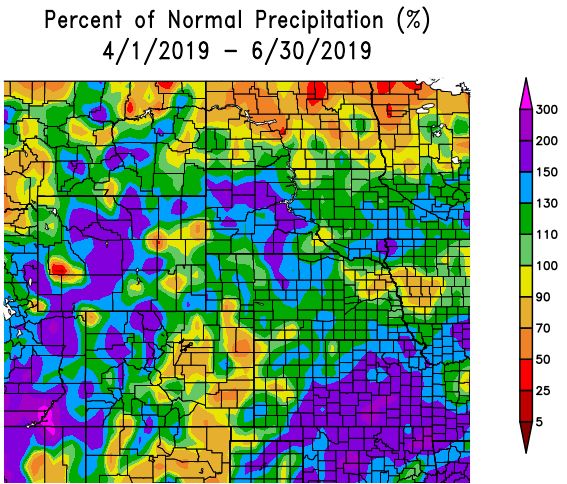
ENSO (El Niño Southern Oscillation)

The CPC’s June 3, 2019 ENSO Outlook indicates that El Niño conditions are present. Per the
CPC, El Niño conditions are predicted to persist through the Northern Hemisphere summer of
2019 (66% chance), with lower odds of continuing in the fall and winter (50-55% chance).

Temperature and Precipitation Outlooks

The NOAA Climate Prediction Center (CPC) outlooks provide the forecasted probability (or
chance) of occurrence of future weather conditions during periods ranging from 1 to 12 months
into the future. The CPC outlooks are available at http://www.cpc.ncep.noaa.gov/.

With regard to future weather, the CPC temperature outlook for July 12-18 (Figure 10, left) is
indicating increased chances for above-normal temperatures over much of the Missouri Basin.
Regarding precipitation (Figure 10, right), the CPC is indicating a very slight increase in the
probability for above-normal precipitation in the plains, and equal chances for precipitation in
western Montana, central Wyoming, and the lower Basin.

              Figure 10. CPC 8-14 Day temperature and precipitation outlooks for July 12-18, 2019.

The July CPC outlooks in Figure 11 indicate increased chances for below-normal temperatures
over the central U.S., including much of the central and lower Missouri Basin. With regard to
precipitation, the CPC is indicating increased chances for above-normal precipitation over much
of the Missouri Basin, as a result of the cooler-than-normal temperatures and increased
convective activity associated with El Niño summers.

                                                       9
Figure 11. CPC July 2019 temperature and precipitation outlooks.

During the July-August-September 2019 period, the CPC outlooks in Figure 12 are indicating
increased chances for above-normal precipitation in most of the Missouri Basin. With regard to
temperature, the CPC indicates equal chances for the central part of the Missouri basin, increased
chances for below-normal temperatures in southeastern South Dakota, Nebraska, Iowa, Kansas,
and Missouri, and increase chances for above-normal temperatures in Montana and western
Wyoming.

During the October-November-December 2019 period, CPC outlooks in Figure 13 indicate
equal chances for precipitation over most of the Missouri Basin. The temperature outlook
indicates increased chances for above-normal temperatures.

                                                    10
Figure 12. CPC July-August-September 2019 temperature and precipitation outlooks.
Figure 13. CPC October-November-December 2019 temperature and precipitation outlooks.
11Summary
In summary, the updated 2019 calendar year runoff forecast is 49.9 MAF, 197% of average.
Existing wet soil moisture conditions, high tributary baseflows, and forecasted summer and fall
precipitation are major factors in determining the July 1 forecast. The Sioux City reach, which
includes the James and Big Sioux River basins, is not regulated by the Mainstem System. This
reach has been a major contributor to upper Basin runoff above Sioux City, and we expect it to
contribute greatly to upper Basin runoff during the summer and fall.
12You can also read