UNIVARIATE LONG-TERM MUNICIPAL WATER DEMAND FORECASTING
←
→
Page content transcription
If your browser does not render page correctly, please read the page content below
U NIVARIATE L ONG - TERM M UNICIPAL WATER D EMAND
                                                                    F ORECASTING

                                                                                               A P REPRINT

                                                              Blake VanBerlo                                        Matthew A. S. Ross
                                                            VanBerlo Consulting                                    Artificial Intelligence
arXiv:2105.08486v1 [cs.LG] 18 May 2021

                                                              London, Canada                                Information and Technology Services
                                                      blake@vanberloconsulting.com                          The Corporation of the City of London
                                                                                                                      London, Canada
                                                                                                                    maross@london.ca

                                                                                             Daniel Hsia
                                                                                      Water Demand Management
                                                                                Environmental and Engineering Services
                                                                                 The Corporation of the City of London
                                                                                           London, Canada
                                                                                         dhsia@london.ca

                                                                                              May 19, 2021

                                                                                              A BSTRACT
                                                  This study describes an investigation into the modelling of citywide water consumption in London,
                                                  Canada. Multiple modelling techniques were evaluated for the task of univariate time series fore-
                                                  casting with water consumption, including linear regression, Facebook’s Prophet method, recurrent
                                                  neural networks, and convolutional neural networks. Prophet was identified as the model of choice,
                                                  having achieved a mean absolute percentage error of 2.51%, averaged across a 5-fold cross validation.
                                                  Prophet was also found to have other advantages deemed valuable to water demand management
                                                  stakeholders, including inherent interpretability and graceful handling of missing data. The imple-
                                                  mentation for the methods described in this paper has been open sourced, as they may be adaptable
                                                  by other municipalities.

                                         Keywords Machine learning · Forecasting · Water demand

                                         1   Introduction
                                         Forecasting is a commonplace task in municipal government. City departments have an obligation to their citizens
                                         to limit their expenditures on investments that promote the long-term stewardship of public resources. Municipal
                                         water demand is a typical example of a quantity that would be useful to model for forecasting purposes to enable
                                         better budgeting and infrastructure planning. The work described in this paper is an application of machine learning
                                         forecasting methods to accurately model and predict water consumption in the city of London, Canada.
                                         A reasonably correct forecast of aggregate water demand may serve a collection of purposes in municipal government.
                                         A major use for forecasts of water consumption is to produce revenue projections to be incorporated into municipal
                                         budgets. Such forecasts, if segmented by rate class and extended over a few years, can form the basis of revenue
                                         projection from the utility. A reasonably accurate forecast may be used to identify and justify major investments in water
                                         infrastructure. Further, a model for water consumption may provide insight into repeating and/or overarching patterns
                                         that may exist in consumption. For instance, some forecasting models entail characterization of seasonal variation of
                                         water demand. The context-specific knowledge that may emerge from forecasting places a valuable emphasis on model
                                         interpretability; that is, models whose predictions may be understood based on knowledge of the model itself. Lastly,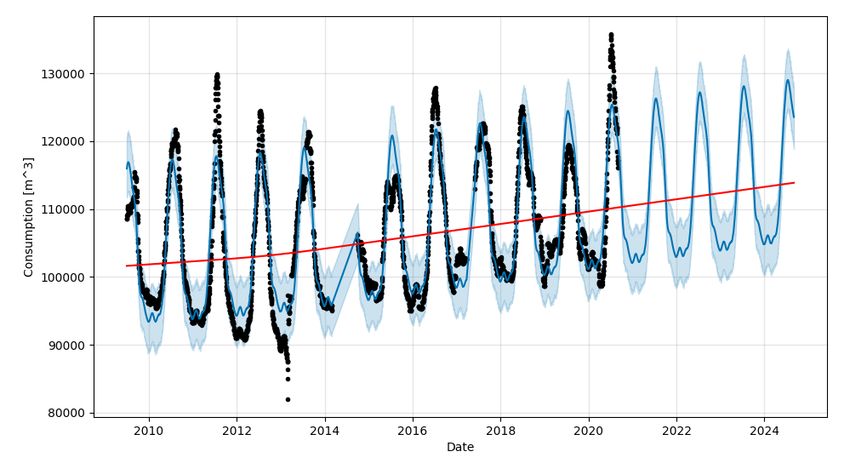
A PREPRINT - M AY 19, 2021

forecasting methods may be applied to various strata of the population, enabling comparisons of the habits of each
group and derivation of useful customer behaviour insights.
This paper details the search for and evaluation of a univariate model for long-term water consumption forecasting in
London, Canada. The Prophet modelling algorithm [0] was ultimately selected to produce the city’s new long-term
water demand forecasting model. Section 2 provides a brief survey of related work in water demand forecasting. The
procedure that was followed to arrive at the final model will then be presented in Section 3, along with its justification.
The evaluation of the candidate models will be detailed in Section 4, along with forecasting and interpretability details
pertaining to the final model. Finally, Section 5 will explore the results and propose directions for future work.

2   Related Work

The use of modern machine learning methods to forecast utility demand is hardly a novel concept, and is currently
being explored on several fronts in various locations. For instance, researchers at the University of Western Ontario
applied support vector regression to forecast household electricity consumption [0]. More recently, researchers at the
same university investigated an evolutionary artificial neural network (ANN) approach to forecast residential electrical
load demand [0]. ANN models have also be applied to predict natural gas consumption in Szczecin, Poland [0] and in
multiple Greek cities [0]. Hereafter, we focus our discussion on efforts to forecast water demand.
Forecasts of water consumption typically fall into one of two categories: short-term and long-term. Both involve
predicting some sort of indicator of future water consumption, but are often based on different sets of features and
underlying data. Hanyu Liu’s master’s thesis focuses on development of short- and long-term forecasting models for
water demand in Edmonton, Canada [0]. Liu asserts that, in the short-term scenario, meteorological data and recent
consumption data are important predictors of water consumption [0]. In his short-term modelling, Liu employs ANN
approaches to learn daily and weekly forecasting models from a variety of predictors, including water consumption,
temperatures, precipitation, and date characteristics (e.g. day of week) over the days/weeks preceding the forecast.
Adamowski et al. [0] investigated the use of discrete wavelet transforms and ANNs for predicting short-term water
consumption from weather and recently observed water demand, achieving a relative root mean square error of 1.59%.
Shah et al. [0] studied the application of an ANN known as recurrent neural networks (RNN) to short-term forecasting
in Indiana, United States. Training their models using weather and population data, their team found that RNN models
outperformed multiple linear regression and feed-forward neural networks, achieving a test set error of approximately
2.5% [0]. Despite their prevalence in the literature, ANNs are not the only model used to forecast short-term demand.
The auto-regressive integrated moving average (ARIMA) method has previously been applied to hourly water demand
forecasting [0]. A 2020 study by Du et al. [0] proposes a method by which ARIMA is used to produce a short-term
daily forecast, which is then modified by a Markov model to account for future trend.
Our work seeks to address the problem of long-term water demand forecasting. A 4-year forecast length was selected,
so as to align with stakeholder multi-year budget projection obligations. In the long-term scenario, several predictors
useful for short-term modelling are no longer useful. For instance, the volatility of weather data and its absence for
future years renders it ineffective for forecasting on the scale of years into the future. Multiple models have been
proposed that take advantage of different predictors. System dynamics (SD) modelling has been used to forecast
long-term water demand in the past. For instance, Qi and Chang [0] constructed a SD model from macroeconomic
predictors to predict residential water usage. Wang and Davies [0] developed a SD model based on consumer uses of
water that predicted weekly water consumption in Calgary, Alberta through 2040. Multiple models were created to
account for possible variation in water policy [0]. Validation of the model for the years 2005-2015 revealed a relative
root mean squared error (RMSE) of 5.76%. Similar to the short-term scenario, ANNs frequently appear in the literature
for long-term modelling solutions. Shrestha et al. [0] trained an ANN model to predict yearly water consumption
data based on the number of water connections, water tariff rate, fraction of the population in university, and annual
rainfall. Despite their satisfaction with the ANN’s performance, the training set was limited to 16 years. Aside from
the small dataset, a major limitation of their approach was the necessity to produce forecasts for the predictors in
order to generate long-term water demand forecasts. As a result, uncertainty in the forecasts of the predictors may
compound in the ANN’s long-term forecasts. Liu [0] addresses this shortcoming in his thesis, where he suggests a
hybrid SD-ANN model for long-term weekly municipal water demand forecasting in Edmonton, Alberta. His approach
considers multiple long-term climate scenarios and produces separate models for each [0]. The SD component models
indoor water consumption, modelling several domestic uses for water, while outdoor water consumption is predicted by
an ANN from temperature and precipitation data computed under varying climate scenarios [0]. He reports a mean
absolute error (MAE) of 87 ML for an average demand of 2471 ML per timestep [0]. The long-term forecasting efforts
described in this section tend to rely on assumptions about the future values of predictors, and tend to have a timestep of
1 week or greater.

                                                            2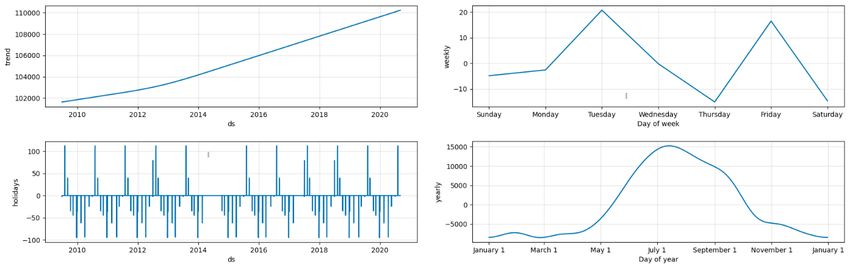
A PREPRINT - M AY 19, 2021

Figure 1: Citywide daily water consumption estimates (in cubic metres) computed from water billing data.

3     Methods
3.1   Data Preprocessing

As demonstrated by previous work in long-term water demand forecasting, most models create forecasts for a duration
of at least a week. We chose a daily timestep, hoping to produce as detailed forecasts as possible. In London, each
client’s total consumption of water is recorded for each billing period. A billing period is approximately one month
in duration, with variance of a few days resulting from the method of data collection from the physical water meter.
Additionally, billing periods are offset between clients since meter reads do not take place all at the same time, nor
will they be identical month-to-month across the same customer. A method was devised to calculate an estimation for
daily citywide water consumption. By producing a daily estimate, we increased the resolution of our data from an
(approximate and staggered) monthly time step to a daily time step, resulting in a significantly greater total number
of time series records in the dataset. A single client’s water consumption for a particular date, d, was estimated by
dividing their total consumption, Cclient , over the length of the client’s billing period (in days) in which d falls in, with
inclusive start and end dates bstart , bend , where d ∈ [bstart , bend ]. The city-wide consumption on date d, Cdtotal , is
then the sum of all clients’ estimated daily consumption on date d (Equation 1). This estimation method assumes that
clients consume water uniformly over the duration of a billing period. Of course, this assumption does not likely hold
true — water consumption fluctuates over the short term and depends on dynamic weather phenomena [0]. The day of
the week may also have a large impact on water demand, as water demand can vary on weekdays versus weekends.
We argue that this assumption is appropriate for the problem of long-term forecasting, as we are not concerned with
short-term irregularities in consumption. Rather, we value forecasts that highlight overall future patterns and trend.
Although the estimated daily consumption may appear unduly smooth, the total water consumption over billing periods
is preserved in this estimation. Note that even if we determined a monthly estimate for citywide demand, the uniform
consumption assumption would still be inevitable, since clients’ billing periods were staggered in the raw dataset.

                                                            X          Cclient
                                               Cdtotal =                                                                  (1)
                                                                     b2 − b1 + 1
                                                           clients

The consumption estimates produced for each date available in the raw dataset comprised the preprocessed dataset.
For the purposes of this investigation, daily estimated water consumption was the only feature in the preprocessed
dataset, rendering this a univariate forecasting problem. Estimates were computed for dates between July 7, 2009 and
September 2, 2020 inclusive. Unfortunately, billing data could not be recovered for particular date ranges in 2014 and
2017. Consequently, we were unable to obtain consumption estimates for the inclusive date ranges of March 1, 2014 to
September 30, 2014, and for March 25, 2017 to May 31, 2017. Figure 1 depicts the daily consumption estimates that
were computed from the available water billing data.

                                                               3
A PREPRINT - M AY 19, 2021
3.2 Candidate Models
As noted in section 2, several modelling approaches to water demand forecasting have been proposed. We limit our
investigation to four candidate models. Given the preponderance of ANNs in the literature, we selected two different
ANN architectures with varying mechanisms for handling time series data. To establish a baseline, we considered an
ordinary least squares (OLS) regression model, which was the preexisting method used for water demand forecasting in
London. Finally, Facebook’s Prophet method [0] was included as an intuitive alternative to ANN models.
Two ANN models were considered, each utilizing different architectural components useful for handling time series data.
First, a RNN model was investigated. Input to the model consisted of water consumption estimates over Tx consecutive
days (where Tx is the input sequence length), and the output was the predicted consumption for the following day.
The model consisted of a long short-term memory (LSTM) layer, followed by 2 fully connected layers with rectified
linear activation, and a single-node output layer with linear activation. The second ANN had the same input/output
formulations. Its architecture consisted of at least one 1-dimensional convolutional neural network (1D-CNN) layers,
followed by 2 fully connected layers with rectified linear activation, and a single-node output layer with linear activation.
Hereafter, these two model architectures are referred to as the LSTM-RNN model and the 1D-CNN model respectively.
Both networks make predictions for a particular day based on daily consumption from the last Tx days. Each was
trained using the Adam stochastic optimization technique [0]. When training the ANN models, the most recent records
in the training set were detached to form a validation set, which informed early stopping, a technique employed to deter
overfitting [0].
Lastly, Prophet is a forecasting method proposed by Facebook researchers that consists of a combination of configurable
functions fitted to time series data [0]. It is composed of smaller components whose behaviours may be in part dictated
by developers, lending itself to what the method’s creators claim is an "analyst-in-the-loop" approach to forecasting.
Prophet is a composite function, consisting of components for piecewise linear or logistic trend, periodic effects (annual,
weekly, or custom periods), and holiday influences. Based on input by domain experts, Prophet can be configured to
accommodate different formulations of time series problems. In the case of long-term water demand, piecewise linear
trend was preferred to logistic trend because a carrying capacity for the aggregate water demand in London is unknown.
Prophet models a piecewise linear trend by identifying changepoints in time series data (i.e. dates at which the slope
of the linear trend changes) and produces linear trends for the data between changepoints [0]. As evident in Figure 1,
water consumption in London has an annual seasonality. Prophet calculates a Fourier series to approximate a periodic
function that captures seasonal effects applied to the underlying trend [0]. Finally, unique parameters for holidays can
be fitted depending on the locale [0]. Equation 2, taken from the original Prophet publication, summarizes the simple
relationship between Prophet’s forecast and its constituent functions [0].
y(d) = g(d) + s(d) + h(d) + d (2)
In the above equation, y(d) is Prophet’s prediction for date d, g(d) is the trend component, s(d) is the seasonality
component, h(d) is the holiday component, and d is a normally distributed error term [0]. As a result, we specified that
Prophet include a periodic annual function to capture seasonal effects. Although the daily consumption estimates are
fairly smooth as a result of our daily consumption estimate methodology, we also included a periodic weekly function
in the model. Finally, we identified all provincial and national holidays impacting work schedules. Prophet estimates
individual holidays’ effects and carries them forward in future forecasts. The result was a Prophet model with linear
trend, entailing yearly and weekly seasonality, along with holiday effects.
3.3 Hyperparameter Optimization
Prior to evaluating the four proposed models, hyperparameter optimization was conducted to yield information on the
influence of a variety of hyperparameters. We chose to use Bayesian optimization based on Gaussian processes to
efficiently guide testing of various hyperparameter values [0]. Each model was given 500 iterations for the optimization.
During each iteration, a 5-fold cross validation is conducted using a combination of hyperparameters specific to that
iteration. Section 3.4 provides specifics about the time series cross validation technique that was used. The mean
absolute percentage error (MAPE) on the test set averaged across the 5 folds was used to compare combinations of
hyperparameters from different iterations. To determine the optimal hyperparameters for a particular model, the list of
combinations from each run was examined, along with the corresponding partial dependence plots (see Figure 2 for an
example). Final hyperparameter values and the ranges from which they were selected are presented in Table 1.
4A PREPRINT - M AY 19, 2021
Hyperparameter Names
CHAN...CALE: Changepoint prior scale
SEAS...CALE: Seasonality prior scale
HOLI...CALE: Holidays prior scale
SEAS...MODE: Seasonality mode
Figure 2: Partial dependence plots (PDP) for average test set MAPE during cross validation (the objective function) for
Prophet, created from the results of a Bayesian hyperparameter optimization. The coloured plots are two-dimensional
PDPs. Brighter regions correspond to lower values for the objective. Black dots correspond to values of
hyperparameters for each iteration of the optimization, and the red star indicates the best iteration. The graphs on the
diagonal are one-dimensional PDPs for each hyperparameter considered. The red line indicates the best iteration. Final
hyperparameter values were decided based on which values for the hyperparameters corresponded to lower values of
the objective.
3.4 Model Evaluation
After having selected the final hyperparameter values for each of the four models in consideration, model evaluation
was conducted. The procedure for model evaluation was twofold. First, a 5-fold cross validation was completed for
each model. Since we are working with time series data, cross validation similar to the rolling origin methodology
proposed by Tashman [0] was employed, whereby different models are trained using progressively smaller fractions
of the training set and evaluated on the data immediately following the curtailed training set for a particular fold. For
our purposes, 4 models were trained using the 4 most recent sextiles of preprocessed data as the test sets for each fold,
and the training sets consist of all data preceding the test set. Figure 3 portrays the cross validation strategy that was
employed. This strategy ensures that no individual model performs well due to a fortunate quirk in the most recent
consumption data. Assessing multiple trained models with different test sets starting during various seasons provides
confidence in the modelling technique in question. Since this study was completed during the COVID-19 pandemic,
this cross validation strategy is especially crucial. A glance at the preprocessed data (Figure 1 demonstrates the peaked
irregularity in water consumption through the Spring and Summer months of 2020. It would be unfair to evaluate the
model only on its performance for a test set spanning the COVID-19 pandemic. The primary metric of interest was
mean absolute percentage error (MAPE) on the test set, but mean squared error (MSE) and root mean squared error
(RMSE) were also considered. Since recurrent neural architectures do not handle missing data well, it was decided that,
at this stage, models be evaluated on the largest and most recent continuous date range for which we had consumption
data. Recall from section 3.1 that there were 2 ranges of missing data. Therefore, the models were trained on all
consumption data between June 1, 2017 and September 2, 2020, which comes to 1190 days in total.
5A PREPRINT - M AY 19, 2021
Model Hyperparameter Range type Range Determined value
OLS Input sequence length (Tx ) Uniform integer [30, 365] 300
Input sequence length (Tx ) Uniform integer [30, 365] 200
Batch size Set 16, 32 32
Patience (early stopping) Uniform integer [5, 15] 15
Learning rate Logarithmic float [10−5 , 10−3 ] 10−5
LSTM-RNN Loss function Set {MSE, MAE, Huber} MSE
Units in LSTM layer Set {8, 16, 32, 64, 128} 4
Units in 1st fully connected layer Set [32, 64, 128] 64
Units in 2nd fully connected layer Set [16, 32, 64] 64
Dropout rate Uniform float [0.0, 0.5] 0
Input sequence length (Tx ) Uniform integer [30, 365] 180
Batch size Set 16, 32 32
Patience (early stopping) Uniform integer [5, 15] 5
Learning rate Logarithmic float [10−5 , 10−3 ] 3 × 10⁻⁴
Loss function Set {MSE, MAE, Huber} MAE
1D-CNN Filters in 1st 1D convolutional layer Set {8, 16, 32} 16
Convolutional kernel size Set [3, 5] 3
Convolutional stride Uniform integer [1, 2] 1
Numbers of 1D convolutional layers Uniform integer [1, 4] 2
Units in 1st fully connected layer Set [32, 64, 128] 64
Units in 2nd fully connected layer Set [16, 32, 64] 32
Dropout rate Uniform float [0, 0.5] 0
Changepoint prior scale Logarithmic float [0.001, 0.5] 0.001
Seasonality prior scale Logarithmic float [0.01, 10] 0.01
Prophet
Holidays prior scale Logarithmic float [0.01, 10] 0.01
Seasonality mode Set {additive, multiplicative} additive
Table 1: Ranges and final values of hyperparameters of each model
training set test set omitted data
remaining
data
kth latest
quantile
. . . 2nd latest
quantile
latest
quantile
validation set
(if applicable)
Figure 3: The cross validation strategy, inspired by the rolling origin method [0]. For the k th training experiment, the
(k + 1)th quantile of consumption data comprises the test set. All preceding data becomes the training set, unless the
model is a neural network; in which case, the latest 10% of the training data is allocated to the validation set. The latest
k quantiles are excluded from the experiment.
Aside from the objective performance of the model, other aspects were included in the evaluation of each model. Factors
considered included model interpretability, handling of missing data, and degree of opportunity for domain expertise to
improve the forecast. These criteria are explored further in section 4, in tandem with the performance metrics.
3.5 Implementation Details
The code for this study was written in Python 3, and it is available open source in our public GitHub repository1 .
Training experiments were conducted using a personal computer running Windows 10 equipped with an Intel® CoreTM
i7-8750H CPU at 2.2 GHz. ANN training was accelerated through use of a NVIDIA GeForce® GTX 1050 Ti graphics
processing unit with 4 GB of memory.
1
https://github.com/aildnont/water-forecast
6A PREPRINT - M AY 19, 2021
Model Mean metric value [standard deviation]
MAE (m3 ) MAPE (%) MSE (m6 ) RMSE (m3 )
OLS 5.73 [3.88] × 103 5.22 [3.30] 6.14 [6.13] × 103 6.79 [4.51] × 103
LSTM-RNN 4.31 [2.76] × 103 3.87 [2.30] 3.02 [3.44] × 107 4.83 [3.02] × 103
1D-CNN 4.50 [2.65] × 103 4.02 [2.13] 3.41 [3.52] × 107 5.27 [2.91] × 103
Prophet 4.30 [1.57] × 103 3.83 [1.22] 2.82 [1.97] × 107 4.99 [2.10] × 103
Table 2: Mean and standard deviations for test set performance metrics across the 4 folds from rolling origin cross
validation. All models were trained on the longest continuous recent subset of data (June 1, 2017 to September 2, 2020).
4 Results
4.1 Model Selection
Armed with the hyperparameter combinations derived from the Bayesian hyperparameter search discussed in section 3.3,
5-fold cross validation was employed, using the strategy outlined in section 3.4. Test set performance metrics calculated
during cross validation include MAE, MAPE, MSE, and RMSE. The metric of primary interest was MAPE. Table 2
summarizes the results of 4-fold time series cross validation for each of the four candidate models, displaying values for
test set performance metrics averaged over each fold. Prophet achieved the lowest MAPE score overall, which was the
primary quantifiable selection criteria. Additionally, Prophet achieved the lowest MAE and MSE scores averaged over
cross-validation. Observe that LSTM-RNN performed nearly as well as Prophet.
Prophet was designated as the model of choice. Aside from the quantitative selection criteria outlined above, other
capabilities of Prophet contributed to its ultimate selection as the best model candidate. Prophet has multiple advantages
over neural networks. First, Prophet does not suffer when there are missing values in the dataset [0]. Recall from
section 3.1 that major intervals of data were missing for the years 2014 and 2017. Simply deleting missing values
introduces potential bias into time series datasets [0]. Although we acknowledge the existence of novel time series
imputation solutions [0], it was determined by stakeholders that for this scenario, imputation was not an option. A
major advantage of Prophet is that it employs a generative model, avoiding the requirement that time series data points
be evenly distributed [0]. Prophet therefore enabled us to train on the entire time series dataset, stretching from 2009 to
2020.
A second major advantage of the Prophet model is that it is inherently interpretable by design. ANN models are
not inherently interpretable, often requiring post-processing to yield explanations for their predictions. As this is a
municipal government application of machine learning, it is desirable (and arguably necessary) to be able to justify and
explain the model’s predictions to any inquiring party. Several interpretability techniques exist that can be applied to
ANN models [0]; however, they often involve approximations and would require extra effort to explore. As mentioned
in section 3.2, Prophet is composed of multiple components that, when combined, compose the output of the whole
model. The individual components can be visualized and serialized to further end-user understanding of the basis of the
model’s predictions.
In summary, the superior performance of Prophet as evidenced by comparing cross validation scores, along with its
ability to handle missing data and its inherent interpretability, make it the ideal candidate model. As a result, Prophet
was chosen as the model to forecast water demand for the City of London.
4.2 Final Model
After the decision had been made to select Prophet as the model for water demand
forecasting, we were able to train Prophet on the entire available preprocessed
Hyperparameter Value
dataset, dating back to July 2009. An additional hyperparameter search was
conducted to inform final hyperparameter choices for the Prophet model in Changepoint prior scale 0.001
production. For each combination of hyperparameters, rolling origin 5-fold cross Seasonality prior scale 0.01
validation was conducted by taking the 5 folds to be the most recent 5 deciles Holidays prior scale 0.01
of the complete dataset. The final hyperparameters determined for the Prophet Seasonality mode additive
model are shown in Table 3. Using the newly decided hyperparameters, cross
Table 3: Final hyperparameter
validation was executed again, attaining the metrics shown in Table 4. To get a
values for the Prophet model,
sense of how the final Prophet model fit the data, consider the visualizations in
trained on the complete dataset.
Figure 4. For this model, the test set was taken to be the most recent 6 months of
7A PREPRINT - M AY 19, 2021
Mean metric value [standard deviation]
MAE (m3 ) MAPE (%) MSE (m6 ) RMSE (m3 )
2.78 × 10³ [7.67 × 10² ] 2.51 [0.7] 1.36 × 10⁷ [4.93 × 10⁶ ] 3.63 × 10³ [6.65 × 10² ]
Table 4: Mean and standard deviations for test set performance metrics across the 5 folds from rolling origin cross
validation for the Prophet model trained on the complete dataset.
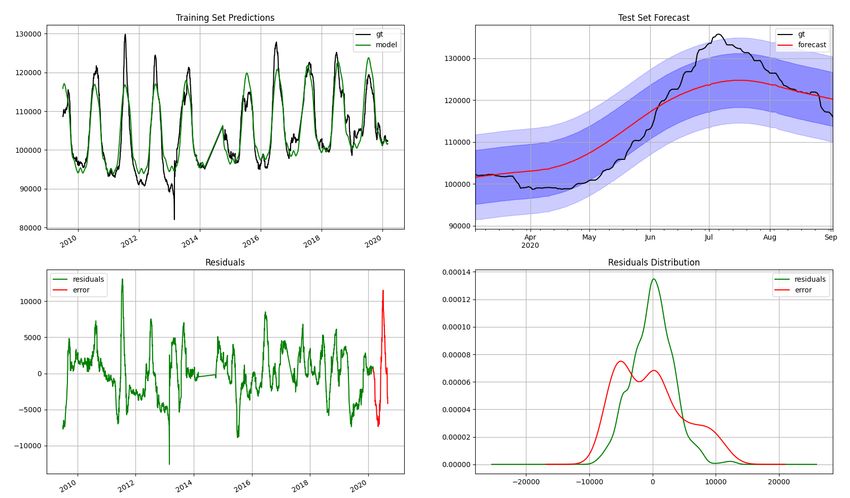
Figure 4: A collection of visualizations evaluating the performance of the final Prophet model. In the top left, the
model’s predictions on the training set are contrasted with the ground truth daily consumption (i.e. "gt"). The top right
graph compares the model’s forecast for the 6-month test set with the ground truth consumption from the test set. The
bottom left graph depicts residuals (training set MAE) and test set error (MAE). The bottom right graph compares the
distribution of residuals to test error. All water consumption values on the y axes are expressed in cubic metres.
data (early March to early September 2020). Despite the test set coinciding with
the COVID-19 pandemic, the forecast is remarkably faithful to the ground truth consumption values.
Returning to the original stakeholder requirements for this study, recall that a forecast of four years was to be utilized for
budgetary projections. The Prophet model was trained on the entirety of the available preprocessed data and a forecast
was obtained for 4 years into the future. Figure 5 depicts the 4-year forecast for water consumption in the London
region. Note that the trend was fixed after the first 80% of the training data (as it was for all other trials), ensuring that
recent irregularities (such as COVID-19) did not bias the trend leading into the forecast. This is an especially important
practice, since Prophet extends the most recent trend into its forecast, calculating no further changepoints. The forecast
is then simply the continuation of the trend into the future, with seasonal and holiday effects applied. In production,
new Prophet models will be trained when data becomes available to maximize forecast accuracy.
5 Discussion
The water demand forecasting Prophet model described in section 4.2 is able to produce a reasonable water demand
forecast. It was especially convenient that Prophet was able to handle missing data without introducing bias into
forecasts, enabling us to utilize the entire available history of water consumption data. A quick glance at the daily
estimates for citywide water consumption (see Figure 1) provides enough information to understand why Prophet was
a sound choice for the problem at hand — for example, there is a strong, repetitive seasonal periodicity observable
8A PREPRINT - M AY 19, 2021
Figure 5: A forecast produced by the Prophet model trained on all available daily consumption estimates. The Prophet
model’s predictions are represented in blue, with error margins shown in light blue. Ground truth consumption values
are represented by black points. The red line indicates the trend component of the model.
in the data. Peaks are visible in the summer months and troughs appear in the winter months, which are respectively
the warmest and coldest seasons in London. Liu [0] also found this to be the case when studying water consumption
patterns for Edmonton, Canada.
It was stated in section 4.1, Prophet is inherently interpretable. Recall from section 3.2 that Prophet predictions are a
composition of linear trend, periodic functions for seasonal effects, and holiday effects. Further, holiday effects sprout
from regionally specific data, which Prophet enables the analyst to implement as accessory information to improve
forecasting. Prophet’s forecasts can be decomposed, facilitating isolation of each component. Figure 6 shows the four
components of the final Prophet model: linear trend, yearly seasonality, weekly seasonality, and holiday effects. We
will consider each of the components individually. First, the trend component indicates an overall growth in water
consumption in London. Since the "changepoint prior scale" hyperparameter was set to an extremely low value, the
number of changepoints in the trend has been minimized. The overarching growth in water demand over the last
decade is consistent with London’s continuing population growth, which has accelerated over recent years [0]. Second,
the holidays component indicates that water consumption is slightly lower on winter holidays and slightly higher on
summer holidays. While this is interesting due to its congruence with annual seasonal effects, the effects are hardly
noticeable, with no holiday parameter exceeding 150 m3 . Similarly, the weekly component appears to imply that the
day of the week has little bearing on Prophet’s forecast. Such a result is unsurprising, considering the assumption that
was made during data preprocessing that a client’s daily consumption was uniform over the billing period, which is
typically around a month in duration. In reality, weekly and holiday effects are likely more pronounced, since water
consumption habits especially between Residential and Commercial rate classes, vary significantly between days of
the week. Finally, yearly seasonality appears to contribute strongly to the model’s prediction, varying by at least 20%
of the trend component. As discussed previously, the peak in summer months and dip in winter months correspond
to the temperatures experienced in London, Canada throughout the year. Multiple activities may be contributing to
this seasonal difference in consumption. Residential water use may spike in the summer due to increased frequency
of citizens performing outdoor tasks requiring water, such as pool filling and lawn/plant watering. Commercial and
industrial cooling processes that utilize water could also make up a substantial fraction of the elevated demand seen
during hotter months. The decomposition of the Prophet model is an informative and highly valuable tool that will
enable analysts to better understand long-term water demand forecasts.
Although this study achieved its goal of finding an accurate model for forecasting water demand in London, there
remain opportunities for further study. First, multivariate models could be explored to discover whether other aspects of
the water demand system have an impact on water usage forecasts. Customer attributes such as land area and meter
type are examples of other possible predictors. Second, it may be worthwhile to study whether Prophet can accurately
model water consumption for subsets of the population divided by their rate class. In London, all clients are designated
as belonging to one of the following rate classes: residential, commercial, industrial, and institutional. Clients pay
for water usage based on the rate assigned to their rate class. Models for each rate class would provide more detailed
9A PREPRINT - M AY 19, 2021
Figure 6: The components of the final Prophet model. Values on the y axes are expressed in cubic meters. Trend and
holiday components, given for all dates in the training set (labelled "ds" on the x-axis), are presented in the top two
graphs. The bottom two graphs display one period of the fitted yearly and weekly periodic functions.
long-term estimates of municipal water revenue, and entail projections for revenue should the water rates be changed for
a subset of the rate classes. Lastly, an investigation into the effect of climate severity on municipal water consumption
and its implications for long-term forecasting would be of great interest.
6 Summary
Citywide water demand forecasting for London, Canada was posed as a univariate time series forecasting problem.
Four models were trained, including OLS linear regression, RNN, CNN and Prophet models. Based on a 5-fold
rolling origin cross validation, Prophet was discovered to minimize the primary metric of interest, achieving a MAPE
of 2.51% averaged over cross validation. Prophet was also able to perform forecasting despite missing segments of
data. Furthermore, Prophet is inherently interpretable, the model itself being the sum of interpretable components for
linear trend, seasonality, and holiday effects. A non-exhaustive survey of insights gleaned from Prophet’s forecast
and decomposition regarding water consumption were discussed. Avenues for subsequent study were also suggested.
Finally, the methods described in this paper may be translatable to other municipalities; as a result, the implementation
has been made public via a GitHub repository.
References
[0] Sean J. Taylor and Benjamin Letham. “Forecasting at Scale”. American Statistician, vol. 72, no. 1 (2018), pp. 37–
45.
[0] Xiaoou Monica Zhang, Katarina Grolinger, Miriam A.M. Capretz, and Luke Seewald. “Forecasting Residential
Energy Consumption: Single Household Perspective”. Proceedings - 17th IEEE International Conference on
Machine Learning and Applications, ICMLA 2018 (2019), pp. 110–117.
[0] Santiago Gomez-rosero, Miriam A M Capretz, and Syed Mir. “Deep neural network for load forecasting centred
on architecture evolution” (2020).
[0] Jolanta Szoplik. “Forecasting of natural gas consumption with artificial neural networks”. Energy, vol. 85 (2015),
pp. 208–220.
[0] Athanasios Anagnostis, Elpiniki Papageorgiou, and Dionysis Bochtis. “Application of artificial neural networks
for natural gas consumption forecasting”. Sustainability (Switzerland), vol. 12, no. 16 (2020), pp. 1–29.
[0] Hanyu Liu. “Municipal Water Demand Forecasting in the Short and Long Term with ANN and SD Models”.
MA thesis. University of Alberta, 2020.
[0] Jan Adamowski, Hiu Fung Chan, Shiv O. Prasher, Bogdan Ozga-Zielinski, and Anna Sliusarieva. “Comparison
of multiple linear and nonlinear regression, autoregressive integrated moving average, artificial neural network,
and wavelet artificial neural network methods for urban water demand forecasting in Montreal, Canada”. Water
Resources Research, vol. 48, no. 1 (2012), pp. 1–14.
[0] Setu Shah, Mahmood Hosseini, Zina Ben Miled, Rebecca Shafer, and Steve Berube. “A water demand prediction
model for central Indiana”. 32nd AAAI Conference on Artificial Intelligence, AAAI 2018 (2018), pp. 7819–7824.
10A PREPRINT - M AY 19, 2021
[0] Leonid Shvartser, Uri Shamir, and Mordechai Feldman. “Forecasting Hourly Water Demands by Pattern Recogni-
tion Approach”. Journal of water resources planning and management, vol. 119, no. 6 (1993), pp. 611–627.
[0] Hongyan Du, Zhihua Zhao, and Huifeng Xue. “ARIMA-M: A new model for daily water consumption prediction
based on the autoregressive integrated moving average model and the markov chain error correction”. Water
(Switzerland), vol. 12, no. 3 (2020).
[0] Cheng Qi and Ni-Bin Chang. “System dynamics modeling for municipal water demand estimation in an urban
region under uncertain economic impacts”. Journal of environmental management, vol. 92, no. 6 (2011), pp. 1628–
1641.
[0] Kai Wang and Evan G R Davies. “Municipal water planning and management with an end-use based simulation
model”. Environmental modelling & software : with environment data news, vol. 101 (2018), pp. 204–217.
[0] Manish Shrestha, Sujal Manandhar, and Sangam Shrestha. “Forecasting water demand under climate change
using artificial neural network: A case study of Kathmandu Valley, Nepal”. Water Science and Technology: Water
Supply, vol. 20, no. 5 (2020), pp. 1823–1833.
[0] Diederik P Kingma and Jimmy Ba. “Adam: A Method for Stochastic Optimization” (2014).
[0] Lutz Prechelt. “Early Stopping - But When?” In: Neural Networks Tricks of the Trade. Ed. by Gerhard Goos,
Juris Hartmanis, and Jan van Leeuwen. Springer-Verlag Berlin Heidelberg, 1998. Chap. 2, pp. 55–69.
[0] Gilles Louppe and Manoj Kumar. Bayesian optimization with skopt. 2016.
[0] Leonard J Tashman. “Out-of-sample tests of forecasting accuracy: an analysis and review”. International journal
of forecasting. International Journal of Forecasting, vol. 16, no. 4 (2000), pp. 437–450.
[0] Muhammad Saad. “Deep Learning Based Approaches for Imputation of Time Series Models”. Master’s. University
of Waterloo, 2020.
[0] Christoph Molnar. Interpretable Machine Learning. A Guide for Making Black Box Models Explainable. https:
//christophm.github.io/interpretable-ml-book/. 2019.
[0] Statistics Canada. Annual demographic estimates, census metropolitan areas and census agglomerations: Interac-
tive dashboard - Population estimates as of July 1st, 2019, London (Ont.) 2020.
11You can also read