Translational proling of neuronal subtypes in pre-symptomatic fatal familial insomnia mice reveals TOR signaling in somatostatin-expressing neurons
←
→
Page content transcription
If your browser does not render page correctly, please read the page content below
Translational profiling of neuronal subtypes in pre-
symptomatic fatal familial insomnia mice reveals TOR
signaling in somatostatin-expressing neurons
Susanne Bauer
Linköping University: Linkopings universitet
Lars Dittrich
German Center for Neurodegenerative Diseases Site Göttingen: Deutsches Zentrum fur Neurodegenerative
Erkrankungen Standort Gottingen
Lech Kaczmarczyk
Linköping University: Linkopings universitet
Melvin Schleif
German Center for Neurodegenerative Diseases Site Göttingen: Deutsches Zentrum fur Neurodegenerative
Erkrankungen Standort Gottingen
Rui Benfeitas
Science for Life Laboratory: SciLifeLab
Walker S. Jackson ( walker.jackson@liu.se )
Linköping University https://orcid.org/0000-0002-3003-5509
Research article
Keywords: Prion, fatal familial insomnia, Creutzfeldt-Jakob disease, RiboTag, somatostatin, selective
vulnerability, neurodegeneration, transcriptome analysis, GSEA, co-expression network
Posted Date: March 25th, 2022
DOI: https://doi.org/10.21203/rs.3.rs-1458940/v1
License: This work is licensed under a Creative Commons Attribution 4.0 International License. Read
Full License
Page 1/32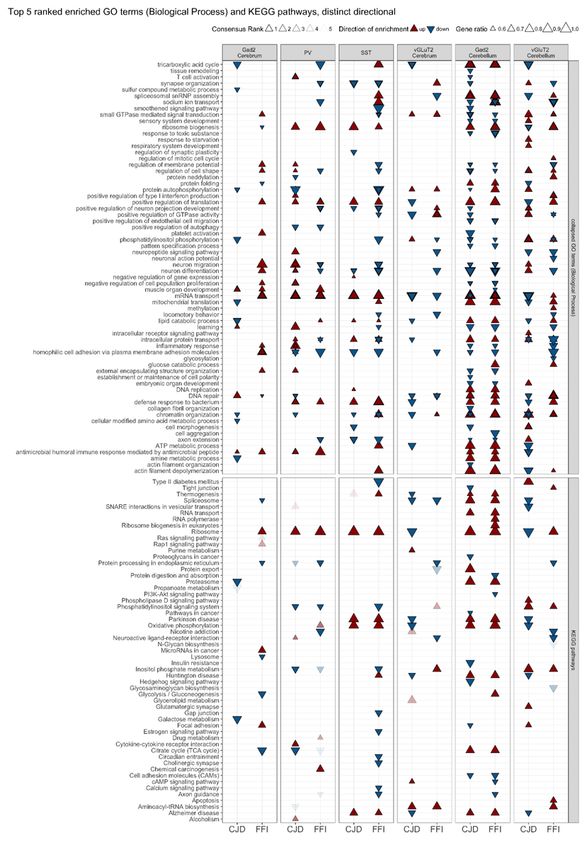
Abstract
Background

Selective neuronal vulnerability is a common, yet poorly understood characteristic of neurodegenerative
diseases. It is particularly fascinating in familial prion diseases, such as fatal familial insomnia (FFI) and
Creutzfeldt-Jakob disease (CJD), where different mutants of the prion protein manifest as clinically and
neuropathologically distinct diseases.

Methods

To determine how distinct neurons respond to different mutations in the prion protein gene at pre-
symptomatic stages, we used RiboTag to isolate cell type-specific, translating mRNA from GABAergic,
glutamatergic, somatostatin- (SST) and parvalbumin- (PV) expressing neurons of 9-month-old knock-in
mouse models of FFI and CJD. Differential gene expression analysis followed by gene set enrichment
analysis (GSEA) was performed for all cell types in both diseases. We further constructed a undirected
weighted gene co-expression network for SST neurons to identify functional models and hub genes.

Results

We found SST+ neurons showed the most prominent gene expression changes in both diseases, especially in
FFI, with high similarities between the two diseases. GSEA demonstrated similar enrichment patterns of
functional terms for GABAergic cell types in both FFI and CJD, whereas responses in glutamatergic neurons
were disease specific. For SST+ neurons, functional analysis revealed upregulation of ribosomal biogenesis,
mitochondrial function and neurodegenerative disease pathways, and downregulation of synaptic function
and small GTPase mediated signaling in FFI. Analysis of an SST co-expression network revealed a disease-
associated module, functionally associated with autophagy and TORC1 signaling. Of the identified module
hub genes, three were further significantly differentially expressed in FFI SST neurons, including Depdc5, a
component of mTOR regulator complex GATOR1, and Nucleosome Remodeling Deacetylase complex
component Mta3. Importantly, the molecular changes reported here were very different from those reported
for an acquired prion disease model.

Conclusions

This study identifies SST neurons as an early affected cell type, showing similar responses in both FFI and
CJD with downregulation of mTOR signaling as a potential explanatory mechanism underlying many of the
observed changes. The observation that FFI and CJD have such similar cellular and molecular signatures
indicates that a common therapy may be effective for multiple inherited prion diseases, but possibly less
effective for acquired prion disease.

Introduction
Neurodegenerative diseases (NDs) are widely thought to be caused by the misfolding of specific proteins.
They tend to emerge in middle to late life and slowly, progressively destroy the brain, invariably causing

                                                    Page 2/32
death. A striking feature of NDs is the selective vulnerability of specific neurons and brain regions in early
disease stages, which occurs despite widespread expression of the disease-causing protein.

Selective vulnerability is particularly curious in the case of genetic prion diseases, where different point
mutations in the ubiquitous prion protein (PrP) have been linked to different diseases affecting different
brain regions and manifesting with distinct neuropathological hallmarks and clinical signs (1). Familial
Creutzfeldt-Jakob disease (hereafter CJD, although it differs from non-familial forms) can be caused by
several mutations but is most commonly linked to the E200K substitution (2). Clinical signs include rapidly
progressing dementia, balance and gait disturbances, myoclonus, and sometimes seizures.
Neuropathological hallmarks of CJD include spongiform degeneration accompanied by astrogliosis and
neuronal loss in the cortex, deposition of PrP aggregates that resist proteinase K digestion (PrPres), and mild
spongiform degeneration in the molecular layer of the cerebellum (3),(4). The most common genetic prion
disease is fatal familial insomnia (FFI), caused by a D178N substitution (5). This devastating disease
typically begins with rapidly progressing insomnia, autonomic and motor disturbances, followed by cognitive
decline (6),(4). Neuronal loss is most severe in the anterior and medial dorsal thalamus and accompanied by
astrogliosis. However, in contrast to most other prion diseases, spongiform degeneration and PrPres are
typically absent and usually occur only in cases with a prolonged disease course (7). Cerebellar
neuropathology includes gross atrophy (5), prominent loss of Purkinje cells and morphological changes to
granular neurons (4). Remarkably, despite the expression of the mutant proteins throughout life, these
inherited diseases usually emerge in middle to late life, the same age as other causes of PrDs even though
the mutant protein is expressed throughout life.

Clinical signs of FFI and CJD correlate with loss of function of affected brain regions but the underlying
mechanisms for these disease-specific patterns are unknown. In addition to regional vulnerability, certain cell
types are highly vulnerable. Thus, rather than analyzing brain regions, an alternative approach is to analyze
cell type-specific responses in the presence of mutated PrP. This can be accomplished by analyzing the
translatome, mRNAs associated with ribosomes, from specific cell types. In this study, we analyzed
translatome changes in four major neuronal subtypes, targeting broader groups of vGluT2+ glutamatergic
excitatory neurons and Gad2+ GABAergic inhibitory neurons, as well as GABAergic subpopulations
expressing neuropeptides PV or SST, which are typically non-overlapping. These are of particular interest for
our study, since PV-expressing neurons in the cortex or cerebellum are highly vulnerable in PrDs (8)(9).
Moreover, PV+ (10) and SST+ neurons (11)(12) are highly vulnerable in other NDs and psychiatric disorders
(13). To obtain cell type-specific translatome profiles, we used RiboTag (14) directed to specific neuronal
populations in knock-in mouse models of FFI and CJD at a pre-symptomatic stage. This experimental design
resulted in several unexpected findings. Despite the vastly different regional pathologies, cell type specific
responses were similar between FFI and CJD but were strikingly different from those in a model of acquired
prion disease in which PrP was expressed from the same genetic locus. Also, we describe for the first time
extensive transcriptional changes in SST+ neurons at pre-symptomatic disease stages, a cell type that has
hitherto been understudied in PrDs.

Methods
                                                    Page 3/32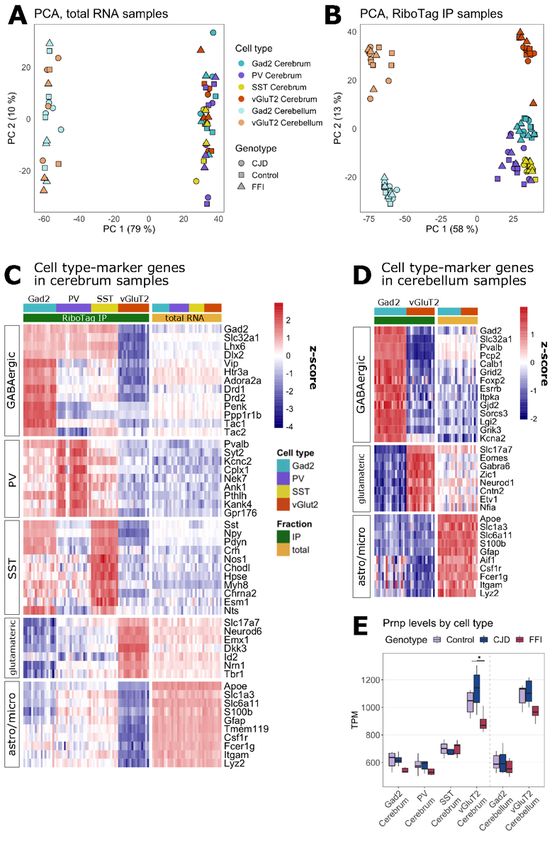
Mouse lines
129S4 mice homozygous for the mouse equivalent of the D178N (FFI) (15) or E200K (CJD) (16) substitution
and the 3F4 epitope (L108M, V11M) in the Prnp locus were studied. Due to deletion of a single codon at the
N-terminus in the mouse Prnp gene, the mouse-equivalent nomenclature for these substitutions is D177N
and E199K. PrD mice were crossed with RiboTag mice (B6N.129-Rpl22tm1.1Psam /J, line #011029; Jackson
Laboratory, Bar Harbor, ME) (14) and Cre-driver lines: Vglut2-IRES-Cre (17) (Slc17a6tm2(cre)Lowl/J, line
#016963; Jackson Laboratory), Gad2-IRES-Cre (18) (Gad2tm2(cre)Zjh/J, line #010802; Jackson Laboratory),
SST-IRES-Cre (18) (Ssttm2.1(cre)Zjh/J, line #013044; Jackson Laboratory) and PV-IRES-Cre (19) (B6;129P2-
Pvalbtm1(cre)Arbr/J, line #008069; Jackson Laboratory). Prior to these crosses all lines were backcrossed to
the 129S4 background, details in (20). This background was chosen since, unlike C57Bl/6 mice which can be
hyperactive at night, 129S4 mice are relatively calm (20). We were concerned that mice with a non-uniform
activity level would be prone to highly variable expression patterns. For cell type-specific targeting, mice
double homozygous for Prnp and Cre were bred to mice double homozygous for Prnp and RiboTag, resulting
in experimental mice all being homozygous for Prnp and double heterozygous for Cre and RiboTag. Mice
were sacrificed at 9 months of age (mean age 9.3 months, SD: 0.7) by carbon dioxide asphyxiation between
10:00 a.m. and 14:00 p.m., matching time points for PrD and control mice to minimize the influence of
circadian rhythm-related gene expression changes. Brains were separated into hemispheres along the
midline. From one hemisphere the olfactory bulb was removed and discarded, the cerebellum was separated
from the cerebrum, flash frozen in cryo-tubes on a dry-ice chilled metal block, and stored at -78°C. The
second hemisphere was fixed in formalin.
Electroencephalography (EEG) and sleep recordings
The EEG/Sleep studies reported here were contemporaneous with another recent study of acquired prion
disease (21), and experimental details can be found in that report. EEG and electromyograph detection leads
were implanted in the epidural layer of the frontal cortex or in the neck muscles, respectively, and were routed
subcutaneously to connect to telemetric recorders (F20-EET, Data Sciences International) that were implanted
in the intraperitoneal cavity. Sleep scoring and analysis was done as reported before (22)(23)(24). Six-hour
sleep deprivations were accomplished with the gentle handling method. The study group included 14 wild-
type (mean age 20.6, SD 3.2 months), 15 FFI (mean age 20.8, SD 1.6 months), and 8 CJD (mean age 21.4,
SD 1.2 months) mice. Several FFI mice died after the completion of the surgeries. It is possible these were
more affected than the others and that the group successfully studied with EEG represent less affected mice.

Buffers and preparation of tissue homogenates
Stocks for polysome buffer (PSB; 50 mM Tris pH = 7.5, 100 mM KCl, 12 mM MgCl2, 1% IPEGAL CA-630
(Sigma-Aldrich, St. Louis MO), plus: 1 mM DTT, 60 U/ml RiboLock RNase inhibitor (ThermoScientific,
Waltham MA), 100 µg/ml Cyclohexamide (Sigma-Aldrich, St. Louis MO), 2x SigmaFast EDTA-free protease
inhibitor cocktail (Sigma-Aldrich, St. Louis MO) dissolved in PSB stock), high salt wash buffer (HSB; 50 mM
Tris pH = 7.5, 300 mM KCl, 12 mM MgCl2, 1% IPEGAL, plus: 1 mM DTT, 20 U/ml RiboLock, 100 µg/ml
Cyclohexamide and 0.5x EDTA-free SigmaFast protease inhibitor cocktail), and extra high salt buffer (EHSB;
HSB containing additional 300 mM NaCl) were prepared using RNase-free reagents and stored at 4°C.

                                                    Page 4/32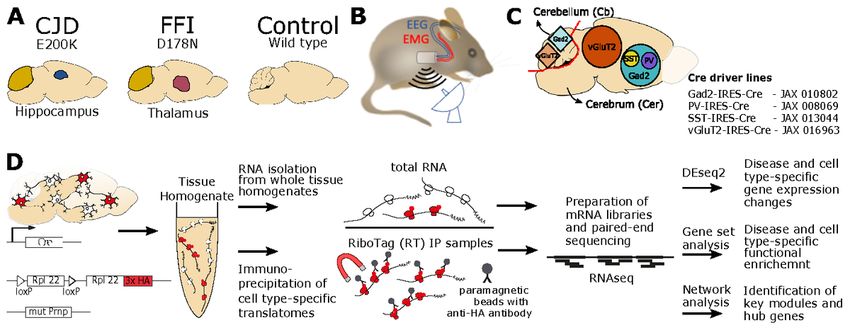
Inhibitors were added to stock solutions directly before use (indicated by “plus”). RNA purifications were
performed in a Biosafety level 3 environment. Frozen tissue samples were homogenized at 450 rpm, using
Wheaton Potter-Elvehjem homogenizers and PTFE pestles (DWK Life Science, Millville, NJ) with a motorized
homogenizer (HEI-Torque Core, heidolph, Schwabach, Germany), in 200 µl ice-cold Polysome buffer per 0.01
g tissue. Homogenates were centrifuged at 4°C, 400xg for 2 min to collect nuclei. Supernatant was
transferred to fresh vials and centrifuged at 4°C, 10000xg for 10 min.
Preparation of total RNA
Following preparation of homogenates as described above, the supernatant (S1) was decanted and 200 µl
(cerebrum) or 100 µl S1 (cerebellum) were used to purify total RNA by adding 300 µl Trizol (Qiagen, Hilden,
Germany) and 300 µl chloroform, vigorous shaking, and incubation for 5 min at room temperature (RT).
Samples were centrifuged at 14000xg, RT, for 10 min, the aqueous phase was collected, mixed with 2x
volume of 99,5% ethanol, 0.1x volume of 3 M sodium acetate (pH = 5.2) and GlycoBlue (ThermoScientific,
Waltham MA; to 50 µg/ml final concentration), shaken vigorously and incubated at -20°C for 2 h. Nucleic
acids were pelleted by centrifugation at 18000xg, 4°C for 15 min. Supernatant was discarded and pellets
incubated for 30 min in 350 µl PKB buffer (4 M guanidinium isothiocyanate pH = 7.5, 0.1 M beta-
mercaptoethanol, 25 mM sodium citrate and 0.5% Sarkosyl; pH < 7), to inactivate any potentially remaining
prion infectivity. Resuspended pellets were transferred to a genomic DNA removal kit column (Qiagen, Hilden,
Germany) and centrifuged for 20 s at 8000xg, RT. Flow trough was mixed with an equal volume of 70%
ethanol, transferred to a RNeasy Mini kit column (Qiagen, Hilden, Germany) and prepared according to
Qiagen protocol. Total RNA was eluted with 30 µl nuclease-free water and stored at -72°C.

RiboTag Immunoprecipitation
Prior to RiboTag purification, protein G-coated dynabeads (PGDB; Invitrogen, Waltham MA, Cat. 1009D, Lot:
00729875) were washed twice by resuspension in 1x PBS and once in PSB. IgG2b Isotype antibody
(Invitrogen, Waltham MA; Cat. 14473285, Lot: 2025721), diluted 1:50 in PSB, was bound to washed beads by
incubation on a MACSmix Tube Rotator (Miltenyi Biotec, Bergischgladbach, Germany) at 4°C, 20 min. Isotype
Ab-bound beads were resuspended in 900 µl S1, incubated rotating for 30 min, 4°C, and collected on a
Millipore Magna GrIP magnetic rack (Millipore, Burlington MA). The supernatant was incubated with 36 µl of
anti-HA 12CA5 monoclonal antibody (Roche, Cat. 11666606001, Lot: 39746400), rotating at 4°C for 90 min.
90 µl washed PGDB were resuspended in the S1-antibody mix and incubated rotating at 4°C for 45 min.
Beads were washed twice with 900 µl PSB, thrice with 900 µl HSB and once with 900 µl EHSB. For each wash
step, beads were carefully resuspended in buffer and incubated at 300 rpm for 2–5 min (Thermomixer
shaker; Eppendorf, Hamburg, Germany). To inactivate any remaining prion infectivity, washed beads were
resuspended in 50 µl of PKB for 30 min, RT. 500 µl Qiazol (Qiagen, Hilden, Germany) were added and
incubated at 300 rpm, RT, 10 min. Beads were collected on a magnetic rack and the supernatant moved to a
fresh tube with 400 µl chloroform, shaken vigorously and incubated for 1 min, RT. Samples were centrifuged
at 14000xg, RT, for 10 min, the aqueous phase moved to a fresh tube and mix with equal volume of 80%
ethanol. RNA was extracted using Qiagen RNeasy micro columns (Qiagen, Hilden, Germany) according to
protocol, eluted with 30 µl of nuclease-free water and stored at -72°C. To increase the RNA yield from SST+
and PV+ neurons, immunoprecipitation was performed in duplicates, using 900 µl S1 per IP. Following elution

                                                   Page 5/32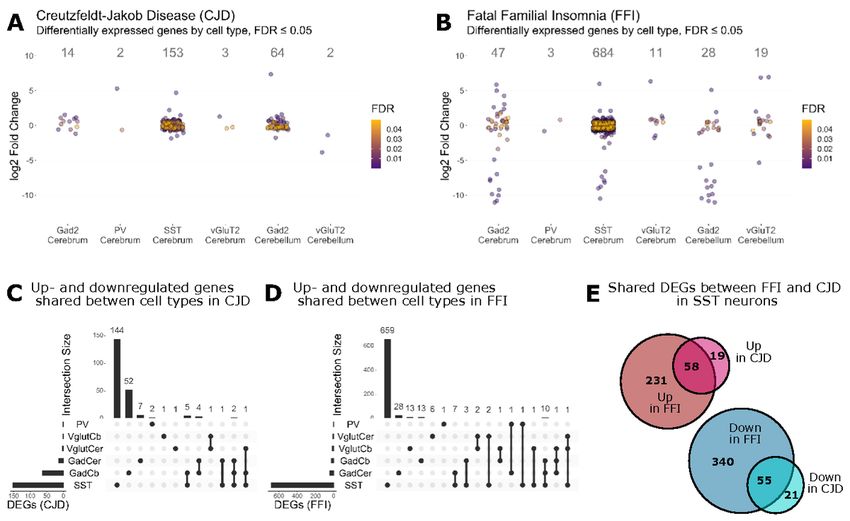
from the PGDB, both duplicates were stepwise added to the same RNeasy micro kit column for RNA
extraction.

Library preparation and sequencing
Libraries were prepared at SNP&SEQ Technology platform at NGI Uppsala, Sweden, using the Illumina
TruSeq Stranded mRNA protocol. Quality control and quantification of RNA samples and libraries was
performed using Agilent Tapestation (Agilent, Santa Clara CA). Paired end sequencing (100 bp) was
performed on an Illumina NovaSeq6000 sequencer using a S4 flow cell (Illumina, San Diego CA). Libraries of
two included samples (BK119.A and U84.A) failed initial sequencing and were resequenced at 150 bp PE and
the same platform.
Data Availability
Code is openly available at github repository https://susannebauer.github.io/familialPrD/. Raw data is
deposited on GEO with accession number GSE198063. (Author comment: Both the raw data and github
repository will be made public upon publication. Pre-publication access for reviewers will be provided if
requested.)

Nf-core pipeline
Alignment was performed using the nf-core/rnaseq 3.0 analysis pipeline (25) using default settings. STAR
and Salmon were used for alignment and quantification. Sequences for ERCC spike ins and RiboTag-HA tag
were included as additional Fasta file and are available on our github repository. Samples were kept if they
contained > 30M mapped reads and < 20% ribosomal RNA reads. One Prnp wild-type SST+ sample (Z58.A)
was excluded as we detected cross-contamination with Prnp reads containing the D178N mutation.
Marker enrichment and principal component analysis (PCA)
To generate PCA plots we calculated the variance for protein-coding genes based on log-scaled transcripts
per million (TPM) values across either RiboTag IP or total RNA samples. Top 1% most variable genes were
used for principal component analysis with prcomp() and visualized with ggplot2 (v3.3.3). Enrichment of cell
type specific marker genes in IP and total RNA samples was analyzed using gene-wise z-score of log2-
transformed TPM values and visualized using pheatmap (v1.0.12).
Differential gene expression analysis
Differential expression analysis was performed for each cell type comparing disease and control samples
(FFI vs. WT and CJD vs. WT) with DESeq2 (v1.30.1)(26). Salmon transcript counts were collapsed to gene
levels using tximport (v1.18.0) and prefiltered to include only protein coding genes with a row-wise mean
count > 10. Genes with false discovery rate (FDR)-adjusted p-values ≤ 0.05 were considered differentially
expressed, no log2 fold change (LFC) cutoff was applied. Results from DESeq2 included several genes with
extreme LFCs which occurred due to highly variable expression with zero TPM values occurring in biological
replicates in control and disease groups. These genes are likely non-informative and are not visualizated in
dotplots in Fig. 4A + B by adjusting the y axis using the ggplot function coord_carthesian(). The original plots
are shown in Additional File 5.

                                                   Page 6/32
Overrepresentation analysis
Overrepresentation of genes from gene ontology (GO) classes included in Biological Process (BP), Cellular
Compartment (CC), Molecular Function (MF) collection (2021), and KEGG Mouse pathways (2019) among
differentially expressed genes (DEGs) was performed using the enrichR R package (v3.0). Terms with
adjusted p-value ≤ 0.01 were considered significant.
Gene set enrichment analysis
Gene set enrichment analysis (GSEA) was performed for each cell type and disease using piano (v2.6.0) (27)
for GO Biological Process (c5.go.bp.v7.4.symbols; gsea-msigdb.org) and KEGG pathways
(KEGG_mouse_2019; maayanlab.cloud/Enrichr). KEGG pathways relating to tissues of different embryonic
origin were removed from the list of genes sets, a detailed list of exclusion terms can be obtained from the
“ReadMe.txt” file. Enrichment analysis was performed using runGSA() function setting DEseq2-derived p-
values as ‘geneLevelStats’, LFC as ‘directions’, ‘signifMethod = “geneSampling” ’, ‘adjMethod = “BH”’ and
limiting gene set size to 15–500 genes. Gene set statistics for different directionality classes were calculated
using six methods by setting argument for “geneSetStats” to “mean”, “median”, “sum”, “stouffer”, “reporter” or
“tailStrength”. Median consensus scores were calculated based on adjusted p-values using the integrated
consensusScores() function. Terms with distinct directional adjusted p values ≤ 0.05 in at least half of the
applied gene set statistics were included in result tables. For Fig. 5, GO terms were collapsed to parent terms
using rrvigo (v1.2.0) by semantic similarity (“Resnik”, threshold = 0.8).
Topological network analysis
A co-expression weighted network was constructed by calculating the pairwise spearman rho correlation
between protein-coding genes with mean TPM > 10 across samples, excluding genes with the lowest 20%
variance across samples. Positive correlations (FDR ≤ 0.01) were used to construct a weighted gene co-
expression network with igraph (v1.2.6) of 6960 nodes and 616054 edges, using spearman rho as edge
weights. Community analysis was performed using the Leiden algorithm (28)(leiden v0.3.7), setting partition
type to modularity vertex partition and setting the weights argument to edge weights. Clustering results were
compared to a random network of equal size generated using the Erdos-Renyi G(n,M) model. Enrichment
analysis for genes of the six main modules was performed using enrichR (v3.0) (29). For plotting of top-
ranked gene sets (Fig. S5), enriched terms (FDR ≤ 0.01) were ranked by combined score (30). igraph was
used to calculate centralities. Network plots were generated using Cytoscape (v3.8.2). Hub genes were
defined as top 1% nodes with highest degree centrality for each module.
Protein-protein interaction (PPI) network
To validate interactions of identified hub genes, we constructed a protein-protein interaction (PPI) network for
hub genes and first neighbors using STRING interaction and functional enrichment data (using STRINGdb
plug-in for Cytoscape), including PPIs with a combined confidence score ≥ 0.7, excluding interaction data
based on text mining and database.
Results
Page 7/32We previously developed knock-in mouse models of familial CJD and FFI linked to E200K and D178N
mutations, in the endogenous mouse Prnp gene (15)(16). These models developed late onset, progressive
diseases that replicate several key pathological features of the respective human diseases, and importantly,
differ from each other in pathological changes and affected brain regions. FFI mice experience neuronal loss
and reactive astrocytosis in the thalamus and atrophied cerebellum (15). In contrast, CJD mice develop
PrPres and spongiosis, hallmarks of the human disease, most prominently in the hippocampus, and PrPres in
the molecular layer of the cerebellum (31) (Fig. 1A). PrP in CJD mice had a slightly altered glycoform pattern,
suggesting a slightly altered path through the secretory system, but in FFI mice, mono- and unglycosylated
PrP were nearly absent and the total amount of all forms was only 25% of normal levels (15), suggesting it is
subjected to intensive quality controls and that the mammalian brain responds to these mutant proteins
differently. Automated mouse behavioral analysis indicated sleep was fragmented and core body
temperature measurements suggested FFI mice had impaired sleep regulation at this age (32), but
electroencephalography (EEG) measurements were not attempted then due to biosafety constraints.
Consideration of the neuropathological changes and in vivo clinical abnormalities measured by automated
behavioral analysis and in vivo magnetic resonance imaging led to the general picture that disease emerged
at approximately 16 months of age for both models (31)(15).
Neural activity is mildly affected in old FFI and CJD mice
To rigorously characterize the general neural health and sleep features in these models, we used the same
EEG methods (Fig. 1B) we applied previously to the RML (Rocky Mountain Labs) model of acquired PrD (21).
Since this was a telemetric recording system, mice could roam freely in their cage, thereby avoiding artifacts
from tethering. In that study, theta frequency waves increased as disease progressed, like observations in
several human PrDs (33). Notably, sleep was not affected in RML mice, even in late stages (21). Turning to
the FFI mice, since we previously observed that behavioral activity was only mildly affected at 16 months of
age, which is likely a result of only mildly diminished neural health at that timepoint, to increase the
likelihood of detecting EEG abnormalities we studied mice at approximately 21 months of age (mean = 20.8,
SD = 2.3). Surprisingly, considering that in FFI mice temperature was dysregulated and that sleep bouts were
disrupted according to an automated video-based system (15), sleep was not strongly affected in the current
EEG study. During daytime, non-rapid eye movement (NREM) sleep tended to be reduced, and wake tended to
be increased, but neither was significant (Fig. 2). To test if sleep control was vulnerable to external
manipulation, we measured the response to six hours of sleep deprivation, which showed no significant
differences between FFI and control mice (Additional File 1A + B). Since sleep abnormalities are sometimes
absent in humans with FFI (5)(34), their absence from this mouse model is not a complete surprise. CJD
mice were studied in parallel, and they also showed no abnormality in baseline sleep (Fig. 2C + D) or in
response to sleep deprivation (Additional File 1C + D). Nonetheless, theta frequency waves were increased in
FFI mice during NREM and REM sleep (Fig. 2F + G), and in CJD mice during wake and REM sleep (Fig. 2H +
J), mimicking this potential biomarker of human PrD. Therefore, despite these models showing
neuropathological and behavioral changes at this stage, there are only mild changes to theta frequency and
the disease is still too mild to cause sleep disruption.
Page 8/32In our recent RML study mentioned above (21), we found that before EEG, behavioral or neuropathological
changes emerged, RiboTag profiling identified specific cell types with altered translatomes. To study a similar
disease stage as done for that study (56% of disease onset), these RiboTag experiments included mice at
nine months of age.
Capture of cell type-specific mRNA with RiboTag
With RiboTag, cell type-specific translatomes are obtained from homogenates of brain tissue by
immunoprecipitating HA-tagged ribosomes and the attached translating mRNA. Driver lines expressing Cre
directed by the genes encoding Gad2 (35), vGluT2 (17), PV (19) and SST (35) were used to achieve cell type-
specific expression of the RiboTag transgene (Fig. 1C). This enabled us to target wider populations of
glutamatergic and GABAergic neurons, as well as PV+ and SST+ GABAergic subtypes. Using a selection of
cell type marker genes, we recently confirmed by both immunofluorescence and RNA-seq of RiboTag IPs, that
these Cre lines lead to specific and selective activation of RiboTag expression (21). Since the cerebellum was
affected in both FFI and CJD models, and the remaining part of the brain (hereafter cerebrum) had distinct
brain regions that were targeted in each model, the cerebellum and cerebrum from each brain were frozen
separately. RiboTag IPs were prepared for all cell types for cerebrum samples, but only for Gad2 and vGluT2
for cerebellum, since in the cerebellum PV-Cre induces RiboTag expression in the same cells as Gad2-Cre,
whereas SST-Cre induces RiboTag expression in very few cells. Consequently, we profiled six cell types,
encompassing two brain regions, in two genetic PrDs (Fig. 1D, Additional File 2). To verify the isolation of cell
type specific translatomes in RiboTag samples, we additionally analyzed total mRNA from the homogenates
in parallel (Fig. 1D). The study group was age-matched (mean = 9.3 months, SD = 0.7), double heterozygous
for RiboTag and Cre, and homozygous for either FFI, CJD, or WT Prnp alleles (Additional File 3).
As expected, PCA showed differences between total mRNA samples based on the region (cerebellar vs
cerebral) but not cell types (Fig. 3A). In contrast, IP samples showed clear differences based on regions and
cell types (Fig. 3B). This was apparent through comparisons of expression of cell type marker genes between
IP and total mRNA, which revealed the expected enrichment of general GABAergic and glutamatergic
neuronal marker genes in samples in which the respective cell types were targeted (Fig. 3C + D). Targeting of
specific subclasses of GABAergic neurons was confirmed by upregulation of PV- or SST-specific marker
genes in the respective samples, whereas Htr3a (serotonin receptor 3A) and Vip (vasoactive intestinal
peptide), GABAergic markers absent from SST and PV neurons, showed the predicted enrichment in Gad2+
and depletion in PV+ and SST+ IPs (Fig. 3C). In the cerebellum, Gad2+ IPs were enriched for marker genes of
several cerebellar GABAergic cell types such as Purkinje, basket, Golgi, and stellate cells, while vGluT2+ IPs
showed enrichment for granule cell markers (Fig. 3D) (36)(37). As expected, astrocyte and microglia marker
genes (38) were depleted in all IP samples. These results indicate that cell type-specific translating mRNA
was successfully isolated from the intended neuronal subpopulations.
Prnp expression varies with cell type and sequence
One potential explanation for selective vulnerability is that vulnerable cell types express high levels of toxic
protein. To test this possibility, we examined the expression levels of Prnp in the targeted cell types based on
TPM values (Fig. 3E). Unexpectedly, Prnp was expressed almost two-fold higher in vGluT2+ neurons than in
Page 9/32GABAergic cell types. These differences were detected in all three genotypes. Higher Prnp expression in
vGluT2 neurons may partially explain the selective vulnerability in these models since the regions most
affected, thalamus and hippocampus, are predominately glutamatergic. This analysis also showed that FFI
mice had slightly lower Prnp expression. This tendency was most pronounced in glutamatergic neurons and
only significant in cerebral vGluT2+ neurons (Kruskal-Wallis, p = 0.026, chi2 = 7.312). This observation is
consistent with the reduced PrP levels previously reported in FFI mouse brains, suggesting that the D178N
mutant engages either a different or more intensive quality control mechanism than the E200K mutant. Since
the protein levels are reduced much more than the mRNA levels, the protein misfolding may be happening
during and after mRNA translation and both get triaged for degradation.
SST+ neurons show pronounced translatome changes in pre-
symptomatic stages of CJD and FFI
A general characterization of translatome profiles for disease-targeted cell types in both disease models was
done by differential gene expression analysis with the DESeq2 R package (26) (Additional File 4). Since the
mice were at a pre-symptomatic disease stage, we expected mild changes to gene expression and therefore
defined differentially expressed genes (DEGs) to have a false discovery rate (FDR) ≤ 0.05 without a log fold
change (LFC) cutoff (Fig. 4A + B, Additional File 5A + B). Surprisingly, SST+ neurons responded with the
highest number of DEGs in both disease models (CJD: 153, FFI: 684), whereas PV+ neurons showed very few
DEGs (CJD: 2, FFI: 3). A comparison of shared DEGs between cell types of the same disease revealed that
most DEGs were unique to a given cell type, including GABAergic subtypes (Fig. 4C + D). In contrast, SST+
neurons demonstrated a high overlap in DEGs between CJD and FFI, with 55 down- and 58 upregulated
genes shared (Fig. 4E). There were few shared genes in other cell types, likely due to the overall low number
of DEGs (Additional File 5C). Since little is known about the vulnerability of SST+ neurons to PrDs, many of
our analyses focused on these important cells.
In both mutants, SST+ neurons displayed increased expression of many ribosomal protein mRNAs: of 79
ribosomal proteins, 26 were upregulated in CJD (mean log2FC = 0.42, SD = 0.09) and 57 in FFI (mean LFC =
0.44, SD = 0.09) (Additional File 5D). Besides suggesting an increased need to synthesize proteins, the high
functional connectivity of these genes is strongly indicative of a coordinated response. To measure the
coordination amongst other DEGs we looked for enriched GO classes by applying ORA. Upregulated DEGs In
CJD SST+ neurons were associated with translation (ribosomal protein genes), actin cytoskeleton, actin-
filament organization, and axonogenesis (FDR ≤ 0.01, Additional Files 6 + 7). In FFI SST+ neurons
upregulated DEGs were mostly related to translation (Snu13, Eef1a1, Eef12 and several ribosomal proteins
(Additional Files 7 + 8A)). Upregulated DEGs were overrepresented in “myelination”, and cytoskeleton and cell
adhesion-related terms, including “actin-binding”, “focal adhesion” and “cell-substrate junction”. Notably,
downregulated DEGs in FFI SST+ neurons were also enriched among cytoskeleton-associated terms
(“processes related to neurite morphogenesis and organization” term, “microtubule binding” and “motor
activity”) and cell adhesion. Additionally, downregulated genes were overrepresented among terms related to
synaptic plasticity and ion-channels or receptor components (Additional file 8B). We also found enrichment
of GTPase activity, including genes involved in Ras and Rho signaling, such as activators of Rho-family
Page 10/32GTPases (Arhgap32,35,44), Rho guanine nucleotide exchange factors (GEFs) (Als2, Agap2, Trio, Dock4), and
downstream effectors (Cdc42bpa, Rock2). Rho GTPases are known regulators of actin cytoskeleton
dynamics (reviewed here: (39)), including dendritic spine formation and density (40), further indicating a high
connectivity between DEGs. Collectively, these results suggest a concerted effort to reorganize the
cytoskeleton of SST+ neurons. In summary, CJD and FFI showed a surprisingly high overlap in DEGs and, to
a lesser extent, in enriched GO terms, suggesting that these neurons activate similar responses in both
diseases.
Gene set enrichment analysis reveals similar functional
enrichments in CJD and FFI
A limitation of ORA is that coordinated but statistically insignificant expression changes of several genes
within a pathway may have important biological implications but would be excluded. Therefore, we applied a
complementary approach, gene set enrichment analysis (GSEA) (41), to assess enrichment of GO terms for
biological processes (BP) and KEGG pathways in each cell type, using the piano R package (27) which
provides combined enrichment scores summarizing results of several statistical methods. Additionally,
separate p-values for different directionalities of change were provided for each gene set. Gene sets with
significant up- or down-regulation (FDR ≤ 0.05) were ranked by their consensus score, which was calculated
based on adjusted p-values for all six statistical methods applied (Additional File 9). Only gene sets
significant in at least three of the six statistical methods are presented in Fig. 5.
Top ranked gene sets for CJD and FFI SST+ neurons showed upregulation of translation-related gene sets
and ND-related pathways, including “Alzheimer’s disease”, “Parkinson’s disease”, and “oxidative
phosphorylation”. Shared downregulated terms included “axon extension”, “neuron differentiation”, “positive
regulation of neuron projection development” and “synapse organization”. FFI SST+ neurons also showed
downregulation of pathways and terms related to synaptic function, phosphatidylinositol phosphorylation,
and downregulation of “small GTPase mediated signaling transduction” (Fig. 5 column 3). Therefore, the
results of these analyses reflect DESeq and ORA results for SST+ neurons despite methodological
differences.
Interestingly, GSEA results also showed similar enrichment patterns for PV+ neurons in both disease models
(Fig. 5, column 2), which were missed by DESeq and ORA due to the low number of DEGs (Fig. 4A + B). As
with SST+ neurons, we found upregulation of translation-related pathways and GO terms, but not changes of
ND-related pathways. Both disease models showed upregulation of immune response-related pathways, and
downregulation of phosphatidylinositol-signaling, “positive regulation of autophagy”, and “protein
processing in the endoplasmic reticulum” (ER). Downregulated GO terms exclusive to FFI PV+ neurons
suggested a disruption in synaptic function (“synapse organization”, “Axon guidance”, “positive regulation of
neuron projection development”). Interestingly, “neuron migration”, “neuron differentiation”, and “regulation of
cell shape” were upregulated in CJD but downregulated in FFI PV+ neurons (Fig. 5, column 2). Compared to
the highly similar enrichment patterns observed in PV+ and SST+ neurons, Gad2+ neurons of the cerebrum
were less similar between the disease models. In FFI we observed upregulation of ribosome pathway,
GTPase signaling (Ras and Rap1), neuron migration and inflammation-related GO terms, whereas in CJD
Page 11/32terms related to metabolic processes, mitochondrial translation, proteasome, and DNA repair were
downregulated (Fig. 5, column 1). In contrast, Gad2+ neurons of the cerebellum exhibited widespread
changes with similar patterns in each model (Fig. 5, column 5). Both disease models showed upregulation of
terms related to translation, splicing, RNA and protein transport, and ND related pathways. GO terms and
pathways related to phosphatidylinositol and GTPase signaling, inflammation and cellular morphology
(“regulation of cell shape”, “Cell adhesion molecules”), neuron migration and differentiation were
downregulated in both diseases.
In contrast to the broadly similar changes in GABAergic neurons, vGluT2+ neurons of the cerebrum showed
more disease-specific responses (Fig. 5, column 4). For example, in CJD, ND pathways, oxidative
phosphorylation, chromatin organization and axon extension are enriched among downregulated genes. In
contrast, FFI showed downregulation of ER protein processing and protein export neuron differentiation, and
neuropeptide signaling. Notably, positive regulation of GTPase activity, phosphatidylinositol phosphorylation
and chromatin organization had different directionalities between the diseases. Shared responses included
downregulation of mRNA transport and upregulation of small GTPase activity and aminoacyl-tRNA
biosynthesis. Cerebellar vGluT2+ neurons displayed the most pronounced differences between models, with
several gene sets exhibiting opposite regulation between CJD and FFI, such as those related to translation,
DNA repair, and mRNA transport, which were down in CJD but up in FFI. We further found downregulation of
ND pathways, splicing, protein folding, and starvation response unique to CJD. In contrast, FFI vGluT2+
neurons showed upregulation of apoptosis and regulation of mitotic cell cycle, and downregulation of ER
protein processing and synaptic function (Fig. 5, column 6). Overall, GSEA revealed high similarities in
enriched ontologies and pathways between the diseases for SST+, PV+ and cerebellar Gad2+ neurons, but in
vGluT2+ neurons, especially in the cerebellum, it demonstrated disease-specific responses.
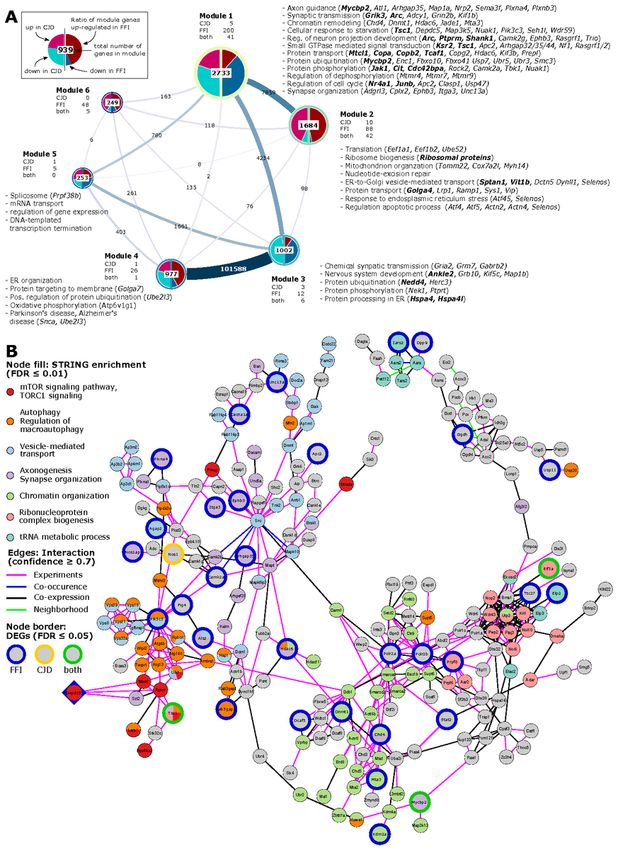
Identification of functional modules in an SST+ co-expression
network
Since SST neurons are understudied in PrD research, we wondered if they might reveal new insights into
therapeutic targets. Thus, we used a network-based approach to further elucidate patterns in gene expression
changes in SST+ neurons. Using our SST+ neuron-specific translatome data we constructed an undirected
weighted gene co-expression network using pairwise gene correlations (FDR ≤ 0.01, Spearman ρ > 0.82)
(Additional File 10). Community analysis using Leiden algorithm (28) generated six major modules (ranging
in size from 249 to 2,733 genes) consisting of genes with highly correlated expression patterns across all
conditions (Fig. 6A), which were validated by comparison to a random network. As co-expression analysis
builds on the assumption that correlation patterns between genes reflect functional connection, we used ORA
to determine significantly enriched (FDR ≤ 0.01) ontology terms and pathways among module genes
(Additional File 11).
Module 1 consisted predominantly of genes downregulated in both diseases (Fig. 6A), including 241 genes
also differentially expressed, and predominantly downregulated, in FFI. Module genes were significantly
overrepresented (FDR ≤ 0.01) among terms related to synaptic transmission, protein modifications and
transport, response to starvation, neuron projection development and axon guidance. Module genes
Page 12/32annotated to these terms also included several genes which we identified as differentially expressed either in
both diseases (indicated in bold italics in Fig. 6A) or specific for FFI (italics). Genes annotated to synapse
organization, chromatin remodeling, and regulation of dephosphorylation-related terms included FFI-specific
DEGs. Interestingly, ORA of module 1 genes also revealed autophagy-regulation (“negative regulation of
macroautophagy” and “TORC1 signaling”) and chromatin modifications (“positive regulation of histone
ubiquitination”) among the top enriched ontologies (Additional File 12A).
Module 2 genes were enriched for translation, ribosomal biogenesis, and mitochondrial organization
(Additional File 12B, Fig. 6A). This is consistent with ORA results from upregulated DEGs identified in CJD
and FFI SST+ neurons (Additional Files 6 + 8), as module 2 contains ribosomal protein genes, a large
percentage of which were upregulated in both diseases. Additional enriched GO terms related to ER stress,
regulation of apoptotic process-related terms, and unfolded protein response (UPR), which included several
FFI-specific DEGs such as activating transcription factors 4 and 5, Atf4 and Atf5 (Fig. 6A). These results are
consistent with those from GSEA (Fig. 5) and functional analysis of cell type specific DEGs (Additional Files
6 + 8). This indicates genes in modules 1 and 2 might be of particular interest to familial PrD-associated
pathological processes as these show highly correlated expression patterns with a high percentage of DEGs
and are functionally closely related to identified dysregulated terms.
Genes in Module 3 were mostly downregulated in both diseases and functionally associated with chemical
synaptic transmission, nervous system development, and protein modifications (Fig. 6A) but also including
translation initiation, regulation of macroautophagy and stress granule assembly among top enriched GO
terms (Additional File 12C). Module 4 was highly connected with Module 3 and contained predominantly
upregulated genes associated with ER organization, protein targeting and ubiquitination (Fig. 6A, Additional
File 12D). Module 4 also contained several mitochondrial genes, in particular encoding ATP synthase
subunits, associated with KEGG pathways oxidative phosphorylation, thermogenesis and Alzheimer’s and
Parkinson’s disease pathways (Fig. 6A). Module 5 genes showed significant overrepresentation of terms
related to mRNA splicing and RNA processing (Fig. 6A, Additional File 12E). No significant enrichment was
detected for genes in module 6.
Hub genes point towards two potential therapeutic targets
To find potentially important regulators, we next identified hub genes that display the largest number of co-
expressed genes. We defined hubs as the top 1% of genes with the highest degree centrality, i.e., most direct
neighbors, in each module of our co-expression network (Table 1). Notably, three hub genes in Module 1 were
also differentially expressed in FFI: GATOR1 subunit Depdc5 (DEP Domain containing Complex 5; degree:
560), histone-deacetylase Mta3 (Metastasis Associated 1 Family Member 3; degree: 551) a subunit of the
nucleosome remodeling and deacetylase (NuRD) complex, and Gtf3c1 (General Transcription Factor IIIC
Subunit 1; degree: 585) a mediator of RNA polymerase III transcription. Since downregulation of these highly
connected hub genes suggests they have a central role in the pathological process that may have far-
reaching effects on interaction partners, we next aimed to further validate the interaction of hub genes with
their co-regulated neighbors. For this we constructed a protein-protein interaction (PPI) network for each hub
gene and its first-degree neighbors, to determine whether known interactions between products of co-
Page 13/32regulated genes exist. Predicted PPIs were obtained from STRINGdb, considering only interactions with a
high combined confidence score ≥ 0.7, and excluding interactions based on text mining and databases.
There were no predicted interactions of Gtf3c1 with its co-regulated direct neighbors, indicating that this
method did not provide further insight for this gene. However, the PPI network for Mta3 included 220 of 551
co-regulated genes from our topological network (Additional File 13) while the PPI network for Depdc5
included 230 of 560 co-regulated genes (Fig. 6B, Additional File 14). Both networks additionally showed
strong overlap with 145 shared genes and included 30 genes significantly downregulated in FFI (Fig. 6B, blue
border) or 2 in both diseases (green border). Pathway and GO enrichment analysis using the STRING
Enrichment application (FDR ≤ 0.05) revealed association of Depdc5 PPI-network genes with autophagy,
chromatin organization, vesicle-mediated transport, and neurite morphology (axonogenesis, synapse
organization), ribonucleoprotein complex biogenesis, and tRNA metabolic process. Depdc5 and its direct
neighbors in the PPI network were associated with TORC1 signaling. Given the far-reaching effects of mTOR
signaling on metabolic regulation and autophagy, its involvement in ageing and proposed involvement in
neurodegeneration, we propose this may be a central regulator behind translatome changes we observed in
SST+ neurons in familial PrD. Taken together, this analysis indicates that for both diseases SST+ neurons
show the largest response with TORC1 signaling posing a potential underlying regulatory mechanism.
Discussion
Here we report the translatome responses of six neuronal cell types in knock-in mouse models of two genetic
PrDs at a pre-symptomatic stage. We expected to see different responses of cells to different diseases and
were therefore surprised by the high similarities. In both disease models, SST+ neurons had the highest
number of DEGs, 74% of which were shared between CJD and FFI. Furthermore, additional levels of similarity
between CJD and FFI emerged from ORA and GSEA studies, e.g., upregulation of translation, ND pathways,
and actin-binding proteins, suggesting the disease mechanisms are similar in both models. Since SST+
neurons showed more DEGs in FFI than in CJD, and a functional analysis revealed downregulation of genes
related to synaptic function and GTPase signaling, SST+ neurons in FFI brains appear to be at a more
advanced disease stage.
Previous reports indicated a pronounced early loss of cortical PV+ neurons in patients and models of
sporadic, familial and variant CJD, although they are relatively spared in FFI patients (42), perhaps reflecting
that the cortex is usually less affected in FFI. Based on their reported early vulnerability and the hypothesis
that transcriptional changes precede neuronal pathology and loss (21), we expected to observe more
pronounced gene expression changes in PV+ neurons, at least for CJD mice, but this was not apparent based
on the number of DEGs. However, GSEA of FFI PV+ neurons revealed enrichment in gene sets that could be
associated with neuronal dysfunction, such as ER protein processing or synapse organization, suggesting
PV+ neurons are mildly affected early in this model. Importantly, we observed similar changes in SST+
neurons, a cell type that has previously not been implicated in PrD pathology.
In contrast, GSEA results for cerebellar neurons displayed widespread changes of major pathways and
functional processes, despite few DEGs detected for both neuron types in FFI and vGluT2+ neurons in CJD.
Page 14/32This suggests there is a moderate but coordinated response, in line with early neuropathological changes in
the cerebellum observed in both diseases. Our analyses show high similarities in enriched terms, and their
directionalities, between disease models in cerebellar Gad2+ neurons, suggesting shared mechanisms
underlying the pathology in these cells. In contrast, cerebellar vGluT2+ neurons showed disease-specific
responses. Further studies to confirm these results and determine their role for cerebellar pathology would be
well placed. Overall, our findings indicate that SST+ neurons are a previously unrecognized neuronal subtype
affected early in FFI and CJD. Since vulnerability of SST+ subpopulations has been described in other NDs
(11), but not in PrDs, a deeper exploration of how these neurons responded in FFI and CJD was performed.
mTORC1 inhibitors are downregulated in SST+ neurons
To further elucidate potential mechanisms and regulatory factors underlying the observed translatome
changes in SST+ neurons, we sought to identify topological modules and central genes by constructing a
weighted gene-correlation network. These results indicated downregulation of TORC1 inhibitors, which likely
lead to SST+ neuron-specific activation of mTOR signaling, a positive regulator of protein synthesis,
synaptogenesis, and negative regulator of autophagy. Thus, this single pathway may be responsible for
many of the DEGs in SST+ neurons.
Genes central in regulating TORC1 activity were differentially expressed in FFI SST+ neurons, and the main
TORC1 inhibitor, Tsc1, was downregulated in both disease models. Moreover, SST+ neurons in both models
showed expression changes consistent with increased mTOR activity, including upregulated expression of
ribosomal and mitochondrial genes, downregulation of autophagy, and cytoskeletal reorganization.
Topological network analysis of SST+ samples indicated Depdc5 as one of the module 1 hub genes. Depdc5,
which was also significantly downregulated in FFI, encodes a subunit of the TORC1 inhibitor complex
GATOR1, involved in amino acid-dependent TORC1 activation, and is associated with epilepsy.
Haploinsufficiency of Depdc5 causes aberrant morphology and TORC1 hyperactivation in induced
pluripotent stem cells (43), suggesting that downregulation of Depdc5 in our model may have considerable
impact, despite the mild fold change. Histone deacetylase 6, Hdac6, which was down-regulated in FFI and
strongly co-expressed with Depdc5, is suggested to be a modulator of TORC1 signaling (44) and central in
inducing autophagy as a compensatory mechanism for impaired ubiquitin-proteasome system degradation
(45). Over-expression of Hdac6 in cortical neurons exposed to a toxic PrP fragment (PrP106–126) was shown
to increase cell survival by inducing autophagy through mTOR signaling modulation (44). Together, these
points support the notion that mTOR signaling is affected in PrDs, and that it may be specific for SST
neurons early in disease.
Aberrant activity of mTOR signaling has been demonstrated in many NDs, including Alzheimer’s disease,
Parkinson’s disease, Huntington’s disease and PrDs (46)(47). The central role of mTOR activity together with
the availability of approved mTOR inhibitors such as rapamycin and derivatives has made it an attractive
drug target and has been proposed as a disease modulating treatment approach for neurodegeneration and
cognitive decline. While studies report positive effects of mTOR inhibitor treatment on cognition by
enhancing autophagy and promoting clearance of protein aggregates, its overall role in neurodegeneration is
Page 15/32more complex. mTOR activity is an example of antagonistic pleiotropy, showing beneficial effects early in life
at the expense of negative effects later in life, by promoting synaptogenesis during youth at the expense of
increased risk of damage by protein accumulation due to autophagy inhibition (reviewed in (48)). This
complicates using mTOR inhibition as a therapeutic strategy as its beneficial effects will likely depend on
correct timing in the disease progression (49). Our data further highlight that cell type-specific differences in
mTOR activity play an important role on whether intervention of mTOR inhibition results in overall positive or
negative effects and therapies may need to be targeted to specific cell types.
Conclusion
Our results demonstrate a pronounced response of SST+ neurons to early, pre-symptomatic stages of FFI,
with a marked, coordinated up-regulation of mitochondrial and ribosome biogenesis-associated genes and
down-regulation of cytoskeletal proteins or regulator genes. We identified 67 candidate module hub genes in
a co-expression network of SST+ neurons, of which three (Gtf3c1, Depdc5 and Mta3) also showed differential
expression in FFI and were therefore further validated. With a clear connection to mTOR signaling, a tentative
pharmacologically targetable pathway can now be proposed for FFI and CJD and can be tested
experimentally in the future.
We also report FFI and CJD to be more similar at the molecular level than predicted from differences in
clinical signs and neuropathological changes. This was particularly true for SST+ neurons, which have thus
far been largely ignored in PrD research. Interestingly, we recently reported that SST+ neurons showed little, if
any, response to a widely studied mouse model (RML) of acquired PrD. Moreover, the genes and pathways
changed in Gad2 and vGluT2 cells in RML brains (21) were completely different from those in FFI and CJD
brains, indicating that the genetic and acquired diseases are unexpectedly different. Glutamatergic neurons
showed the largest differences between FFI and CJD. For the cerebrum this now makes sense and in part can
explain the selective vulnerability reported previously since each disease causes neuropathological changes
in different brain regions, thalamus and hippocampus, especially enriched in glutamatergic neurons.
However, in the cerebellum nearly all glutamatergic neurons are granule cells, a very homogeneous cell type,
but they demonstrated strikingly different responses between the diseases. A unifying explanation of the
causes of selective vulnerability remains elusive but continued experimentation with methods like RiboTag or
Tagger (50) may help to eventually solve this mystery.
Abbreviations
BP Biological process
CC Cellular compartment
CJD Creutzfeldt-Jakob disease
DEG Differentially expressed gene
EEG Electroencephalography
Page 16/32EMG Electromyography
ER Endoplasmic reticulum
FDR False discovery rate
FFI Fatal familial insomnia
GABA Gamma aminobutyric acid
GO Gene ontology
GSEA Gene set enrichment analysis
IP Immunoprecipitation
KEGG Kyoto Encyclopedia of Genes and Genomes
LFC Log2 fold change
MF Molecular function
mTOR Mammalian/mechanistic target of rapamycin
ND Neurodegenerative disease
NREM Non-rapid eye movement
ORA Overrepresentation analysis
PCA Principal component analysis
PPI Protein-protein interaction
PrD Prion disease
PrP Prion protein
PV Parvalbumin
REM Rapid eye movement
RML Rocky Mountain Laboratory prion strain
SST Somatostatin
UPR Unfolded protein response
TORC1 Target of rapamycin complex 1
Page 17/32Declarations
The authors would like to thank the National Genomics Infrastructure (NGI) for providing assistance with
library preparation and sequencing. Computations and data handling were enabled by resources provided by
the Swedish National Infrastructure for Computing (SNIC) at UPPMAX, partially funded by the
Swedish Research Council through grant agreement no. 2018-05973. Support provided through the Swedish
Bioinformatics Advisory Program organized by National Bioinformatics Infrastructure Sweden (NBIS) is
gratefully acknowledged.
Author’s contributions
Conceptualization and study design was performed by W.S.J. Tissue samples were collected by L.K., M.S.,
L.D. and W.S.J. Measurements and analyses of EEG and EMG data were performed by L.D. RiboTag
purifications were performed by S.B. Processing and analysis of transcriptomics data was performed by S.B.
with guidance from R.B. The manuscript was written by S.B. and W.S.J. with comments from all authors.
Funding
This work was supported by the Knut and Alice Wallenberg foundation and the German Center for
Neurodegenerative Diseases.
Availability of data and materials
All code is freely and openly available at github repository https://susannebauer.github.io/familialPrD/. Raw
data is deposited on GEO with accession number GSE198063.
Ethics approval and consent to participate
Mouse experiments were performed following national and local guidelines and were approved by local
authorities LANUV-NRW with protocols84-02.04.2013.A128 and 84-02.04.2013.A169.
Competing interests
The authors declare that they have no competing interests.
Consent for publication
All authors consented to the publication of this work.
References
1. Jackson WS. Selective vulnerability to neurodegenerative disease: the curious case of Prion Protein. Dis
Model Mech [Internet]. 2014 Jan;7(1):21–9. Available from: https://pubmed.ncbi.nlm.nih.gov/24396151.
Page 18/32You can also read