Titer Determination Agilent Biocolumns Application Compendium

Page created by Eugene Dunn
 
CONTINUE READING
Titer Determination Agilent Biocolumns Application Compendium
Agilent Biocolumns

Titer Determination
Application Compendium
Titer Determination Agilent Biocolumns Application Compendium
Contents

           Background                                                              2
           Getting Started                                                         3
           How to Guide - Affinity Chromatography for Titer Determination          4
           Featured Application Notes                                             17
               Robust, Reliable, Recombinant Protein A Monolith Column for
               Antibody Titer Determination - 5994-3088EN                         17
               Cell Clone Selection Using the Agilent Bio-Monolith Protein A
               Column and LC/MS - 5991-5124EN                                     24
               mAb Titer Analysis with the Agilent Bio-Monolith Protein A Column
               - 5991-5135EN                                                      32

           Additional Application Notes                                           39
           More Information                                                       39
           

1
Titer
Determination

Background
In biotherapeutic manufacture, titer determination is the measurement of the concentration of
the target protein in the fermentation broth. There are two notable occasions when accurate titer
determination is required. The first is during the clone selection process, selecting only those
transfected clones that provide sufficient amounts of the target protein, since not all clones will
be equally effective. The second is during scale up of the fermentation process to monitor the
concentration of the target protein. Optimization of the cell culture conditions and determining
the best harvest time relies on accurate titer determination.

For monoclonal antibodies, one of the most effective ways of titer determination is to use
affinity chromatography. By absorbing the IgG molecule onto a Protein A or Protein G affinity
chromatography column, the remaining impurities and byproducts from the fermentation broth
can be removed. Elution of the purified monoclonal antibody and quantification by comparing
the peak area to a calibration curve allows rapid measurement of the protein concentration.

Employing a monolithic column helps to eliminate the risk of clogging from cell culture debris
and provides rapid (sub 1 minute) results.

These columns may also be used for purifying sufficient material for subsequent CQA analysis
by another complementary technique, such as Aggregate Analysis or Charge Variant Analysis,
and can easily be combined into a 2D workflow.

                                         Return to Contents Section                               2
Getting Started
                                                                        In selecting an affinity column for titer determination, the
                      Titer                                             first point to consider is the target protein to be purified

                      Determination                                     or analyzed. Different immunoglobulins (IgG 1, 2, etc.)
                                                                        from different sources (human, mouse, etc.) have different
                                                                        affinities for Protein A versus Protein G. For example,
                                                                        Human IgG3 binds tightly to Protein G, but not at all to
                                                                        Protein A. Guidelines on selecting a Protein A or a Protein
    Affinity chromatography                                             G column, as well as suggested mobile phases and a
                                                                        sample method, can be found in the "How- to-Guide"
    Ideal for mAb titer determination during                            that follows. Mobile phase B, the eluting buffer in an
    process development
                                                                        affinity experiment, is one method parameter that can be
                                                                        optimized.

    BioMonolith Protein A
    and BioMonolith Protein G
    Native Protein A or Protein G

    Attribute                  Advantage

    Fast separation            Shorter method
                               development times

    High binding capacity      Greater application
                               flexibility

    Minimal clogging           Less system down time

3                                                      Return to Contents Section
Affinity Chromatography for
Titer Determination: A "How-To" Guide

Introduction
Affinity chromatography is a powerful technique, which takes advantage of highly specific
molecular interactions, frequently between specific proteins (e.g. antigen/antibody). Agilent
offers several specialty affinity products, including monolithic Protein A and Protein G columns
for the isolation and quantitation of monoclonal antibodies (mAbs).

In recent years, mAbs have become one of the major biopharma products in response to the
need to treat various diseases. These antibodies have been engineered with a specific genetic
make up for better targeting of disease agents. During the development of these antibodies,
Protein A and G analytical affinity columns are used to determine antibody titer or concentration
from various cell culture supernatants, to select the high-yield clone.

                                         Return to Contents Section                                 4
Column Selection                                                      Table 1. Binding affinity of Protein A and G to different human and
                                                                      mouse IgG subclasses [ (1), (2)].
Protein A and G columns have high affinity for antibodies,
and so they bind only to antibodies in cell-culture
                                                                       Antibody           Antibody         Protein A          Protein G
supernatants. However, they have different selectivity. For
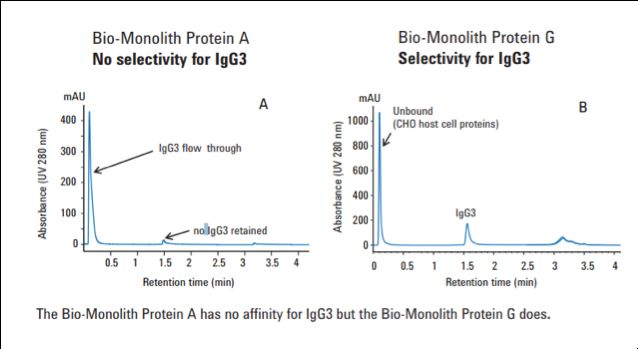
example, Agilent Bio-Monolith protein A columns have high               Human             Human lgG1       ++++               ++++

affinity for human subclasses IgG1, IgG2, and IgG3 and                                    Human lgG2       ++++               ++++
no affinity for IgG3, whereas Agilent Bio-Monolith Protein
                                                                                          Human lgG3       -                  ++++
G columns have high affinity for human subclasses IgG1,
                                                                                          Human lgG4       ++++               ++++
IgG2, IgG3, and IgG4. IgG 1 is the most commonly used as
biotherapeutic for its stability (long half life), abundance                              Human lgA        ++                 -

in serum, and less aggregation formation. IgG 3 is often                                  Human lgD        ++                 -
not used because it’s prone to aggregate and less stable.                                 Human lgE        ++                 -
Conversely, the Protein G column has no affinity for human
                                                                                          Human lgM        ++                 -
subclass monoclonal antibodies such as IgA and IgD, but
                                                                       Mouse              Mouse lgG1       +                  ++
the Protein A column binds to both these antibodies
(Table 1). Together, these columns complement each                                        Mouse lgG2a      ++++               ++++

other, so Protein G has affinity for mAbs that do not bind                                Mouse lgG2b      +++                +++
to Protein A and vice versa (Figure 1). They therefore                                    Mouse lgG3       ++                 +++
and enable titer determination of the various mAb
                                                                                          Mouse lgM        +/-                -
subclasses and fragments currently in development as
biotherapeutics.
                                                                                          Antibody
                                                                                                           Protein A          Protein G
                                                                                          Fragments

                                                                                          Human Fab        +                  +

                                                                                          Human F(ab')2    +                  +

                                                                                          Human scFv       +                  -

                                                                                          Human Fc         ++                 +++

                                                                                          Human Κ          -                  -

                                                                                          Human λ          -                  -

                                                                      Key code for relative affinity of Protein A & G for respective antibodies:
                                                                      ++++ = Strong affinity
                                                                      +++ = Moderate affinity
                                                                      ++ = Weak affinity
                                                                      + = Slight affinity
                                                                      - = No affinity

5                                                    Return to Contents Section
Figure 1. From 5991-6087EN or application note 5991-6094EN.

HPLC system considerations - Protect your                                      The Bio-Monolith protein A column has a white band and
proteins during analysis                                                       Bio-Monolith Protein G has a yellow band around the
                                                                               column.
These monolithic columns are compatible with HPLC and
UHPLC systems, however an ideal choice for this type
                                                                                           Flat   Pointed
of analysis is the Agilent 1260 Infinity II bio-inert LC. It                               end    end
handles challenging solvent conditions with ease, such
as extreme pH values of pH 1 to pH 13, and buffers with
high salt concentrations. Corrosion resistant titanium in
the solvent delivery system and metal-free materials in the                       Flow
                                                                              Direction
sample flowpath create an extremely robust instrument.

Sample Preparation
Sample preparation for affinity chromatography is similar
to that for any protein analysis for HPLC. With some
minor sample preparation being required before injection
to optimize column performance and extend column
lifetimes.
–– Centrifuge or filter samples to remove host cell debris
   and particulates from the supernatant or lysate, to
   prevent blockage of the columns.
–– For serum/plasma samples, it is also best to remove
   lipids from sample. Lipids will strongly bind to the
   columns and can cause fouling of columns and
   instruments.

                                                              Return to Contents Section                                                6
Conditions                                                           Mobile phase
Sample injection                                                     Mobile phase A Binding and washing buffer
For samples containing 1 to 5 mg/mL of mAb injection                 Mobile phase A is the binding buffer: 50 mM sodium
volumes of 1 to 5 µL are recommended. Samples can                    phosphate buffer, pH 7.4.
be dissolved in H2O or mobile phase A. Up to 50 µL or up
to 400 to 500 mg mAb/injection can be injected on the                Binding/washing buffers should be freshly made. In
columns.                                                             addition, filtration of buffers through a 0.22 or 0.45 µm
                                                                     membrane is recommended to reduce buffer impurities
Flow rate                                                            that build up on the frits inside the column. This filtration
Columns can be run at 1.0 to 3.0 mL/min for high speed.              will help to prevent column blockage.

Temperature                                                          Mobile phase B eluting buffer
For successful separations, 25 °C is a typical temperature.          Bio-Monolith Protein A and G columns are compatible with
Columns can be operated from 4 to 40 °C.                             many low pH buffers that are used for mAb elution, see
                                                                     Table 2 for details. Citric acid, glycine, HCl, and acetate
Detection                                                            acid, are commonly used. If a low concentration sample is
Detection by UV at 280 nm being is recommended, at                   used and baseline noise and artifact peaks are of concern,
this wavelength absorbance is due to amino acids with                HCl can be used as an eluent due to its low refractive
aromatic or more conjugated side chains.                             index.
                                                                     Note: Commonly, elution buffers for affinity columns
                                                                     have a refractive index (RI) that is very different from
                                                                     binding/washing buffers; therefore, baseline noise and an
                                                                     artifact peak could appear when the eluents start flowing.
                                                                     This peak could interfere with the quantitation of low
                                                                     concentration samples. To minimize this effect, high-
                                                                     quality chemicals are recommended to be used and blank
                                                                     runs should be included to establish the artifact peak.
                                                                     Blank runs can be used for baseline subtraction if desired.

                                                                     Table 2. Compatible eluting buffers.

                                                                       Column            Eluting Buffer     Concentration   pH

                                                                       Bio-Monolith
                                                                       Protein A         Citric acid        0.1 M           2.5 to 3.0
                                                                       and rProtein A

                                                                                         Glycine            0.1 M           2.5 to 3.0

                                                                                         Acetic acid        5–20 %

                                                                       Bio-Monolith
                                                                                         Citric acid        0.1 M           2.5 to 3.0
                                                                       Protein G

                                                                                         Glycine            0.1 M           2.5 to 3.0

                                                                                         Acetic acid        5–20 %

7                                                   Return to Contents Section
Fast separation protocols                                            High-throughput mAb titer analysis
The Agilent Bio-Monolith rProtein A (recombinant protein             Experimental
A) analytical column is the latest addition to the                   Chemicals and reagents
Bio-Monolith and affinity chromatography family. The
                                                                     All chemicals and reagents were HPLC grade or higher
column enables high-speed analysis of monoclonal
                                                                     and were obtained from Sigma-Aldrich (now Merck) or
antibody (mAb) titer and small-scale purification, and can
                                                                     VWR Scientific. Water was purified using a Milli-Q A10
easily be integrated into other analytical workflows, such
                                                                     (Millipore).
as 2D-LC. This study tests the recombinant protein A
column at the maximum flow rate and performs the
bridging study against the native protein A column. A                Sample
chromatography bind/elute method for mAb titering is
                                                                     The sample was a crude Chinese Hamster Ovary (CHO)
demonstrated, which delivers an ultrafast run time
                                                                     cell culture supernatant collected from a bioreactor that
(1 minute) suitable for high-throughput applications such
                                                                     contained 1 mg/mL of recombinant IgG monoclonal
as clonal selection, process development, and
                                                                     antibody.
optimization.

                                                                     Instrumentation
                                                                     Agilent 1260 Infinity II bio-inert LC comprising:
                                                                     –– 1260 Infinity II bio-inert pump (G5654A)
                                                                     –– 1260 Infinity II bio-inert multisampler (G5668A)
                                                                        with sample cooler (option 100)
                                                                     –– 1260 Infinity II multicolumn thermostat (G7116A)
                                                                        with bio-inert heat exchanger (option 019)
                                                                     –– 1260 Infinity II variable wavelength detector (G7114A)

                                                                     HPLC Method Conditions
                                                                     Parameter           Value
                                                                     Column:             Agilent Bio-Monolith rProtein A, 4.95 × 5.2 mm
                                                                                         (p/n 5190-6903)

                                                                     Binding Buffer      50 mM sodium phosphate, pH 7.4
                                                                     (Eluent A):

                                                                     Binding Buffer      100 mM citric acid, pH 2.6
                                                                     (Eluent B):

                                                                     Gradient Profile:   Time (min)             %B
                                                                                         0.0 to 0.2             0 (binding)
                                                                                         0.3 to 0.65            100 (elution)
                                                                                         0.66 to 0.90           0 (reconditioning)

                                                                                         (0.1 min postrun)

                                                                     Flow rate:          3 mL/min

                                                                     Column              25 °C
                                                                     Temperature:

                                                                     Detection:          UV, 280 nm

                                                                     Injection volume:   4 µL (10 µg loading)

                                                    Return to Contents Section                                                            8
Results and Discussion                                                                  Throughout the study, there was no noticeable change in
                                                                                          peak shape, retention time, and backpressure. Figure 2
  High-throughput mAb titer analysis
                                                                                          showed the chromatograms of different sample loading
  With the high-throughput method, high-speed mAb
                                                                                          amounts. A calibration curve was then generated by plot-
  titering with a 1-minute chromatography run time was
                                                                                          ting peak area versus injection quantity (Figure 3). Results
  demonstrated (Figure 1). The retention time of the purified
                                                                                          indicated excellent linearity response (R2 = 0.9993), as
  (bound/eluted) mAb was approximately 0.61 minutes,
                                                                                          shown in the calibration curve, and accurate measurement
  well separated from the impurities peak at ~0.05 minutes
                                                                                          of mAb quantity from two separate sets of samples.
  containing host cell proteins from the CHO cell culture
  supernatant. In Figure 1, repeated injection of crude                                   These data demonstrated the feasibility of accurate mAb
  supernatant spiked with mAb showed consistent and                                       titer measurement using this fast analysis method.
  robust performance of 60 samples/hour throughput with
  backpressure leveling at 125 bar.

                 ×103
                 1.8

                 1.6

                 1.4

                 1.2
Response units

                 1.0

                 0.8

                 0.6

                 0.4

                 0.2

                   0

                        0.04   0.12   0.20   0.28   0.36    0.44     0.52     0.60     0.68     0.76   0.84
                                                     Acquisition time (min)

  Figure 1. Agilent Bio-Monolith rProtein A column: Overlaid chromatograms of 60 consecutive injections. First peak indicates host cell protein
  impurities in culture supernatant; second peak is purified mAb.

   9                                                                     Return to Contents Section
×103
                 3.8                                                                                          µg         Area       Height
                 3.4                                                                                          0          0          0
                 3.0                                                                                          2.5        105.8      97.3
                 2.6                                                                                          7.5        453.3      365.0
Response units

                 2.2                                                                                          15         1019.1     807.5
                 1.8                                                                                          30         2186.5     1627.8
                 1.4
                                                                                                              50         3811.8     2885.6
                 1.0
                                                                                                              60         4696.1     3604.6
                 0.6
                 0.2
                   0

                           0.04   0.12    0.20   0.28   0.36    0.44     0.52      0.60        0.68   0.76   0.84
                                                         Acquisition time (min)

  Figure 2. Agilent Bio-Monolith rProtein A column: Calibration curve. Overlay chromatograms of increasing sample loading amount for calibration
  curve generation.

                 5,000                                                                                        Spiked Sample       Measured   % Deviation
                 4,500                                                                                        20 µg (sample #1)   19.53 µg   -2.35%

                 4,000                                                                                        20 µg (sample #2)   20.51 µg   2.53%

                 3,500
                                                          R2 = 0.9993
Peak area

                 3,000

                 2,500

                 2,000

                 1,500
                                                                 Sample 1 & 2
                 1,000

                  500

                       0
                           0         10          20        30            40               50          60            70
                                                            Loading (µg)

  Figure 3. Agilent Bio-Monolith rProtein A column: Standard curve linearity response and % deviation.

                                                                              Return to Contents Section                                                   10
Bridging Study                                                       HPLC Method Conditions
In the bridging study, performance characteristics such as            Parameter           Value

retention time, linearity and deviation of the standard               Column:             Agilent Bio-Monolith rProtein A, 4.95 × 5.2 mm
                                                                                          (p/n 5190-6903)
curve, sample carryover, and recovery showed no
detectable difference between the native and the                                          Agilent Bio-Monolith Protein A, 4.95 × 5.2 mm
                                                                                          (p/n 5069-3639)
recombinant columns. This work serves to give confidence
to those who are transitioning from the native protein A              Binding Buffer      50 mM sodium phosphate, pH 7.4
                                                                      (Eluent A):
column to the rProtein A column.
                                                                      Binding Buffer      100 mM citric acid, pH 2.6
                                                                      (Eluent B):

Experimental                                                          Gradient Profile:   Time (min)             %B
                                                                                          0.0 to 0.5             0 (binding)
Chemicals and reagents                                                                    0.6 to 2.6             100 (elution)
                                                                                          2.7 to 4.0             0 (reconditioning)
All chemicals and reagents were HPLC grade or higher
                                                                      Flow rate:          1.5 mL/min
and were obtained from Sigma-Aldrich (now Merck) or
                                                                      Column              25 °C
VWR Scientific. Water was purified using a Milli-Q A10                Temperature:
(Millipore).                                                          Detection:          UV, 280 nm

                                                                      Injection volume:   5 to 50 µL (25 µg loading)

Sample
The samples were crude Chinese Hamster Ovary (CHO)
cell culture supernatant collected from a bioreactor that
contained 1.5 mg/mL of recombinant IgG monoclonal
antibody and purified recombinant IgG monoclonal
antibody at the same concentration.

Instrumentation
The Agilent 1290 Infinity II Bio LC system consists of the
following components:
–– 1290 Infinity II bio high-speed pump (G7132A)
–– 1290 Infinity II bio multisampler (G7137A)
–– 1290 Infinity II multicolumn thermostat with bio heat
   exchanger (G7116B)
–– 1290 Infinity II diode array detector (G7117B) and
   variable wavelength detector with respective bio flow
   cell

11                                                   Return to Contents Section
Results and Discussion                                                                                                4,500
                                                                                                                                    y = 50.012x + 73.505
                                                                                                                        4,000       R2 = 0.9998
  Bridging study                                                                                                        3,500
                                                                                                                        3,000
  Performance of the two Bio-Monolith protein A columns

                                                                                                            Peak area
                                                                                                                        2,500
  were tested under the same conditions. All characteristics                                                            2,000
  showed little or no difference between the native and the                                                             1,500
                                                                                                                        1,000
  rProtein A columns, including retention time and peak
                                                                                                                         500
  shape of the purified mAb (Figure 4), linearity response of                                                              0
                                                                                                                                0       10       20        30        40          50   60   70   80
  the standard curve and spiked sample recovery (Figures 5
                                                                                                                                                                Injection (µg)
  and 6), and sample carryover (Figure 7).

                                                                                                                 Spiked Sample                  Measured           % Deviation
                 ×102
                        A                                                                                        25 µg (pure)                   25.25 µg           0.99%
                   9
                        Native
                   8                                                                                             25 µg (in sup.)                26.09 µg           4.35%
                   7

                   6
Response (mAU)

                                                                                                              Figure 5. rProtein A column: Linearity response
                   5

                   4

                   3

                   2
                                                                                                                        4,000
                   1                                                                                                                y = 51.218x – 34.128
                                                                                                                        3,500       R2 = 0.9998
                   0
                                                                                                                        3,000
                            0.2   0.4   0.6   0.8    1.0    1.2    1.4   1.6   1.8   2.0   2.2   2.4
                                                    Retention time (min)                                                2,500
                                                                                                            Peak area

                 ×102                                                                                                   2,000
                        B
                   9                                                                                                    1,500
                        rProtein A
                   8                                                                                                    1,000
                   7                                                                                                     500
                   6                                                                                                       0
Response (mAU)

                                                                                                                                0       10      20         30        40          50   60   70   80
                   5
                                                                                                                                                                Injection (µg)
                   4

                   3
                                                                                                                 Spiked Sample                  Measured           % Deviation
                   2
                                                                                                                 25 µg (pure)                   24.94 µg           -0.23%
                   1

                   0                                                                                             25 µg (in sup.)                25.78 µg           3.12%

                            0.2   0.4   0.6   0.8    1.0    1.2    1.4   1.6   1.8   2.0   2.2   2.4
                                                    Retention time (min)
                                                                                                              Figure 6. Native Protein A column: Linearity response

                                         Native              rProtein A
       Retention Time (Min) 0.850 ± 0.001                    0.850 ± 0.001

       Peak Height                       880.9 ± 8.1         881.8 ± 5.3

 Figure 4. Chromatogram and mAb peak result comparison between
 Native and rProtein A columns.

                                                                                            Return to Contents Section                                                                           12
Recovery analysis
                 ×102
                  8.5
                                    Injection 1: mAb/CHO sup                                                In addition to comparing the recovery between native and
                  8.0
                                    Injection 2: MPA
                  7.5                                                                                       the rProtein A columns, two non-Agilent rProtein A
                  7.0
                  6.5
                                                                                                            columns were included in this study. Flow rate was ad-
                  6.0                                                                                       justed to 2 mL/min to accommodate a non-Aglient
                  5.5
                                                                                                            column’s operating flow rate. Additional mAb samples
Response (mAU)

                  5.0
                  4.5                                                                                       were included:
                  4.0
                  3.5                                                                                       –– Agilent-NISTmAb (part number 5191-5744)
                  3.0
                  2.5                                                                                       –– Sigma SiLu mAb from Sigma-Aldrich
                  2.0
                  1.5                                                                                          (SiLu Lite, part number MSQC4)
                  1.0                              No carryover
                  0.5
                                                 protein detected                                           Baseline area under the curve (AUC) of the mAb peak was
                    0                                                                                       obtained by injecting purified mAb sample, which was
                        0.1   0.2    0.3   0.4   0.5   0.6   0.7    0.8   0.9   1.0   1.1    1.2
                                                 Retention time (min)
                                                                                                            diluted with mobile phase B, without a column (with a
                                                                                                            union). The column was applied and AUC of eluted mAb
 Figure 7. rProtein A column: Carryover Analysis. Subsequent                                                was obtained. The same amount of mAb sample as base-
 injection of binding buffer (MPA) showed no detectable protein
 carryover.
                                                                                                            line AUC was used.
                                                                                                            Recovery % = (AUC of eluted mAb/Baseline AUC) × 100

                                                                                                            HPLC Method Conditions
                 ×102
                 8.5                                                                                         Parameter           Value
                                    Injection 1: mAb/CHO sup
                 8.0                Injection 2: MPA                                                         Column:             Agilent Bio-Monolith rProtein A, 4.95 × 5.2 mm
                 7.5
                                                                                                                                 (p/n 5190-6903)
                 7.0
                 6.5
                 6.0                                                                                                             Agilent Bio-Monolith Protein A, 4.95 × 5.2 mm
                 5.5                                                                                                             (p/n 5069-3639)
Response (mAU)

                 5.0
                 4.5                                                                                         Binding Buffer      50 mM sodium phosphate, pH 7.4
                 4.0                                                                                         (Eluent A):
                 3.5
                                                                                                             Binding Buffer      100 mM citric acid, pH 2.6
                 3.0
                 2.5                                                                                         (Eluent B):
                 2.0
                                                                                                             Gradient Profile:   Time (min)             %B
                 1.5
                                                   No carryover                                                                  0.0 to 0.4             0 (binding)
                 1.0
                 0.5
                                                 protein detected                                                                0.5 to 1.3             100 (elution)
                   0                                                                                                             1.31 to 4.0            0 (reconditioning)
                        0.1   0.2    0.3   0.4   0.5   0.6   0.7    0.8   0.9   1.0   1.1    1.2             Flow rate:          2 mL/min
                                                 Retention time (min)
                                                                                                             Column              25 °C
                                                                                                             Temperature:
 Figure 8. Native Protein A column: Carryover analysis. Subsequent
 injection of binding buffer (MPA) showed no detectable protein                                              Detection:          UV, 280 nm
 carryover.
                                                                                                             Injection volume:   4 µL (10 µg loading)

  13                                                                                        Return to Contents Section
Result analysis                                                         Conclusion
The average recovery of the rProtein A column was 1%                    The bridging study between native column and the
lower than the native protein A column but still showed                 rProtein A column has demonstrated that rProtein A
better recovery than the two non-Agilent columns. While                 delivers a similar or equivalent performance to the native
the nProtein A column took the slight lead in recovery, it              protein A column.
was the rProtein A column that demonstrated the most
robust recovery across the three mAb samples.

105%                                               Agilent rProA
                                                   Agilent nProA
100%                                               Vendor A
                                                   Vendor B
 95%                 98%
         97%
                                      96%
 90%                                         93%

 85%

 80%

 75%

 70%

 65%

 60%
                        Average recovery

Figure 9. mAb recovery results comparison.

                                                       Return to Contents Section                                                    14
Maximizing column lifetime                                            Clean-in-place
Column regeneration                                                   –– Wash with 1 to 2 mL (10–20 CV) of 0.1 M NaOH
A major benefit of using a monolithic disk is that the                   (reverse flow direction) at 0.2 to 0.5 mL/min.
presence of channels instead of pores decreases the                   –– Wash with 1 to 2 mL (10–20 CV) of DI water at
likelihood of column clogging when injecting cell-culture                0.5–1.0 mL/min.
samples. This increases robustness and reduces cleaning               –– Wash with 1 to 2 mL (10–20 CV) of concentrated
efforts. Column contamination can be reduced by running                  buffer (0.1 to 0.5 M) to restore normal pH (7.0 to 7.4)
a blank gradient injection after every 30–50 samples.
                                                                      –– 4Re-equilibrate with 5 mL (50 CV) of binding buffer.
It column deterioration is observed (tailing or broad
peaks) the following cleaning procedure is recommended.
Column regeneration is the first step. It performance is              If the impurities are highly hydrophobic or lipidic, and are
still suboptimal, the clean in place procedure can be used,           not easily removed from the column, 2-propanol (up to
which will reduce the amount of Protein A available.                  30 %), or guanidine hydrochloride (up to 3 M) can be used
                                                                      to remove these impurities. After using these alternative
                                                                      cleaning solutions, follow steps 1 through 4.
Column regeneration
                                                                      WARNING: When you wash the column with these
–– Wash with 2 mL (20-column volumes (CV)) of 100 mM                  cleaning solutions, always decrease the flow rate on the
   phosphate buffer + 1 M NaCl, pH 7-8,                               column to avoid generation of high pressures that might
   at 0.5-1.0 mL/min.                                                 exceed the maximum allowed pressure over the column.
–– Wash with 2 mL (20 CV) if low-pH solution
   (such as elution buffer)
–– Re-equilibrate with binding buffer.

15                                                   Return to Contents Section
Short-term storage                                                           Ordering information
For storage, overnight or for a few days, the columns
                                                                              Part         Description
can be flushed with binding buffer, disconnected from                         Number
the instrument, capped, and stored at 4 to 8 °C. Columns
                                                                               5190-6903   Bio-Monolith Recombinant Protein A, 4.95 x 5.2 mm
should be equilibrated before the first injection after short-
term storage.
                                                                               5069–3639   Bio-Monolith Protein A, 4.95 x 5.2 mm

                                                                               5190–6900   Bio-Monolith Protein G, 4.95 x 5.2 mm
Long-term storage
If the column will not be in use for more than two days, it
should be washed with at least 1 mL (10 CV) of DI water                      Faster, more consistent biomolecule
and afterwards flushed with at least 2 mL (20 CV) of 20 %                    characterization – Agilent AdvanceBio columns
ethanol with 20 mM Tris buffer, pH 7.4 at a flow rate of 0.2
                                                                             Agilent AdvanceBio columns deliver consistent,
to 0.5 mL/min. It should then be sealed with column end
                                                                             exceptional performance for separating and
stops and stored at 4 to 8 °C (39 to 46 °F).
                                                                             characterizing peptides and proteins.
                                                                             These state-of-the-art columns increase accuracy and
References                                                                   productivity as well as eliminating interferences that can
1. Richman, D. D., Cleveland, P. H., Oxman, M. N., and Johnson, K.           impede analysis. They are rigorously tested and backed by
   M. 1982. “The binding of 1. Staphylococci protein A by the sera           Agilent’s 60-day full satisfaction warranty.
   of different animal species.”
   J. Immunol. 128: 2300–2305.                                               Learn more at www.agilent.com/chem/AdvanceBio
2. Frank, M. B. 1997. “Antibody Binding to Protein A and Protein
   G beads”. 5. In: Frank, M. B., ed. Molecular Biology Protocols.
   Oklahoma City.
                                                                             Partnering with you to get great results
                                                                             Increasing challenges require better answers.
                                                                             Our solutions enable biopharmaceutical scientists to
                                                                             innovate in disease research, accelerate drug discovery,
                                                                             and have greater confidence throughout development and
                                                                             manufacturing.
                                                                             Learn about Agilent solutions for biopharma
                                                                             agilent.com/en/solutions/biopharma-pharma

                                                            Return to Contents Section                                                         16
Application Note
Glycan Analysis

                             Robust, Reliable, Recombinant Protein
                             A Monolith Column for Antibody Titer
                             Determination

Authors                      Abstract
Te-Wei Chu and
                             Rapid screening of crude cell culture supernatant allows decisions to be made on
Andrew Coffey
                             the optimum time for harvest during the manufacture of biotherapeutic antibodies.
Agilent Technologies, Inc.   There are several advantages to using a Bio-Monolith column with recombinant
                             Protein A affinity ligand. First, the Bio-Monolith structure has wide through-pores that
                             minimize the risk of clogging. Second, the use of recombinant Protein A provides
                             the selectivity towards IgG that is associated with native Protein A, but with a
                             higher ligand purity and a more robust structure. Finally, the column can also be
                             used for small-scale purification so that other analytical techniques can be applied,
                             particularly in the determination of critical quality attributes (CQAs).

                             Fc region                                           Protein A

                             Figure 1. Protein A interaction with immunoglobulin G (IgG).

17                                          Return to Contents Section
Introduction                                                                 Conditions, HPLC
Native Protein A is a surface protein isolated from                           Parameter Value
Staphylococcus aureus, which has a high binding affinity for                  Column:      Agilent Bio-Monolith rProtein A, 4.95 × 5.2 mm (p/n 5190-6903)
the Fc region of many different types of immunoglobulin from                  Binding      Eluent A) 50 mM phosphate, pH 7.4
different species. Native Protein A affinity chromatography has               Buffer
become the method of choice for the purification of monoclonal                Eluting      Eluent B) 100 mM citric acid, pH 2.6
antibodies from crude cell culture supernatant. Recombinant                   Buffer
Protein A can provide some extra benefits since it can be                     Cleanup      1) 1 M NaCl in 100 mM sodium phosphate, pH 7.4
produced in a purer form and can be engineered to ensure that                 Buffer       2) 20% isopropanol in 50 mM sodium phosphate, pH 7.4
its immobilization onto a stationary phase creates the ideal                  Gradient:    Time (min)             %B
orientation for optimum binding.                                                           0 to 0.5               0 (binding)
                                                                                           0.6 to 1.8             100 (elution)
It is also helpful for improving column lifetime, which can                                1.9 to 4.0             0 (reconditioning)
otherwise be compromised due to the crude nature of cell
                                                                              Flow rate:   1 mL/min
culture supernatant. This is because it can withstand the harsh
conditions required for column cleanup better than native Protein             Injection    As required (1 to 20 μL)
                                                                              volume:
A columns.
                                                                              Column       24 °C
This application note tests the lifetime of a new Agilent                     temp:
recombinant Protein A Bio-Monolith column.
                                                                              Detection:   UV at 280 nm

Experimental
                                                                             Results and discussion
Reagents and chemicals
                                                                             A crude cell culture supernatant solution containing much higher
All chemicals and reagents were HPLC grade or higher and were
                                                                             levels of host cell proteins than in the previous work1 was chosen
obtained from Sigma-Aldrich (now Merck) or VWR Scientific.
                                                                             to investigate the robustness of Bio Monolith rProtein A columns.
Water was purified using a Milli-Q A10 (Millipore).
                                                                             A repetitive sequence involving step gradients for binding,
Sample                                                                       elution, and column reconditioning was used and the results
The sample was crude Chinese Hamster Ovary (CHO) cell culture                from every 250th injection are shown in Figures 2, 3, and 4.
supernatant collected from a bioreactor that contained 1 mg/mL               After 1,500 injections, a column regeneration step (see Method
of recombinant IgG monoclonal antibody.                                      conditions) was introduced using a cleanup buffer, which was
                                                                             performed every 500 injections thereafter. As expected from such
Instrumentation                                                              a challenging crude sample matrix, a gradual build-up of pressure
Agilent 1260 Infinity II bio-inert LC comprising:                            was observed (Figure 5).
–– Agilent 1260 Infinity II bio-inert pump (G5654A)                          However, with regular cleanup, the column continued to provide
–– Agilent 1260 Infinity II bio-inert multisampler (G5668A) with             consistent, reliable peak area and titer analysis during the 3,000
   sample cooler (option #100)                                               injections, as shown in Figures 6 and 7.
–– Agilent 1260 Infinity II multicolumn thermostat (G7116A) with
   bio-inert heat exchanger (option #019)
–– Agilent 1260 Infinity II variable wavelength detector (G7114A)

                                                            Return to Contents Section                                                                 18
×103
                                               Much higher supernatant concentration
                                                                                                                                                                 Injection 1 (Tf 2.1, 40 bar)
                   0

                 ×103

                                                                                                                                                                 Injection 250 (Tf 2.1, 42 bar)
                   0
Response units

                 ×103

                                                                                                                                                                 Injection 500 (Tf 2.0, 42 bar)
                   0

                 ×103

                                                                                                                                                                 Injection 750 (Tf 2.0, 42 bar)
                   0

                 ×103

                                                                                                                                                                 Injection 1,000 (Tf 2.0, 43 bar)
                   0

                        0   0.1   0.2   0.3   0.4   0.5   0.6   0.7   0.8   0.9   1.0    1.1   1.2   1.3   1.4   1.5   1.6   1.7   1.8   1.9   2.0   2.1   2.2   2.3   2.4   2.5   2.6   2.7
                                                                                                Acquisition time (min)

  Figure 2. Agilent Bio-Monolith rProtein A column lifetime: Injections 1 to 1,000..

                 ×103

                                                                                                                                                             Injection 1,000 (Tf 2.0, 43 bar)
                  0

                 ×103

                                                                                                                                                             Injection 1,250 (Tf 1.8, 44 bar)
                  0
Response units

                 ×103
                                                                                                                                                             Injection 1,500 (Tf 2.1, 48 bar)
                                                                                                                                                                                     Cleanup
                  0

                 ×103

                                                                                                                                                             Injection 1,750 (Tf 2.2, 46 bar)
                  0

                 ×103
                                                                                                                                                             Injection 2,000 (Tf 2.4, 50 bar)
                                                                                                                                                                                     Cleanup
                  0
                        0   0.1   0.2   0.3   0.4   0.5   0.6   0.7   0.8   0.9   1.0   1.1    1.2   1.3   1.4   1.5   1.6   1.7   1.8   1.9   2.0   2.1   2.2   2.3   2.4   2.5   2.6   2.7
                                                                                               Acquisition time (min)

  Figure 3. Agilent Bio-Monolith rProtein A column lifetime: Injections 1,000 to 2,000.

  19                                                                                    Return to Contents Section
×103

                                                                                                                                                             Injection 2,000 (Tf 2.4, 50 bar)
                  0

                 ×103

                                                                                                                                                             Injection 2,250 (Tf 2.8, 50 bar)
                  0
Response units

                 ×103
                                                                                                                                                             Injection 2,500 (Tf 2.6, 57 bar)
                                                                                                                                                                                    Cleanup
                  0

                 ×103

                                                                                                                                                             Injection 2,750 (Tf 2.4, 55 bar)
                  0

                 ×103
                                                                                                                                                             Injection 3,000 (Tf 2.2, 54 bar)
                                                                                                                                                                                    Cleanup
                  0
                        0   0.1   0.2   0.3   0.4   0.5   0.6   0.7   0.8   0.9   1.0   1.1   1.2   1.3   1.4   1.5    1.6   1.7   1.8   1.9   2.0   2.1   2.2   2.3   2.4   2.5   2.6   2.7
                                                                                              Acquisition time (min)

  Figure 4. Agilent Bio-Monolith rProtein A column lifetime: Injections 2,000 to 3,000.

                                                                                        Return to Contents Section                                                                             20
Table 1. Column pressure versus injection number during lifetime.

          N-glycans              Innovator          Biosimilar
          1                      38.0               40.0

          250                    41.0               41.5

          500                    43.0               42.0

          750                    48.0               42.0

          1,000                  -                  43.0

          1,250                  -                  44.0

          1,500                  -                  48.0

                        60
                                                                                                  Native Protein A
                                                                                                  rProtein A

                        50

                        40
Column pressure (bar)

                        30

                        20

                        10

                        0
                        -100   100           300   500           700          900         1,100     1,300       1,500
                                                           Injection number

    Figure 5. Column pressure versus injection number during lifetime.

    21                                                              Return to Contents Section
7,000

            6,000

            5,000

            4,000
Peak area

            3,000

            2,000
                                                                                            Column regeneration/cleanup
            1,000

               0
                    0           500                   1,000                  1,500           2,000                2,500   3,000

                                                                        Injection number

 Figure 6. Peak area versus injection number during column lifetime.

                                                               Return to Contents Section                                   22
Table 2. Peak area versus injection quantity (μg) during column lifetime.

    Quantity                            After 2,000       After 3,000
    (μg)               Initial          Injections        Injections
    1                  654              633               688

    2                  1,363            1,323             1,308

    5                  2,766            2,984             2,979

    10                 5,526            5,699             5,666

    15                 7,706            7,653             7,699

    20                 10,541           10,268            10,347

            12,000
                     Initial
                     After 2,000 injections
                     After 3,000 injections
            10,000

             8,000
Peak area

             6,000

             4,000

             2,000

                0
                 0                  5                   10                    15                 20                 25
                                                             Quantity (µg)

  Figure 7. Peak area versus injection number during column lifetime.

  Conclusions                                                                      References
  This application note has shown that the Bio-Monolith rProtein A                 1. Coffey, A.; Kondaveeti. Improved Lifetime of Bio-Monolith
  column is capable of consistent and reliable performance in titer                   Protein A Columns for Titer Determination. Agilent
  analysis beyond what we have observed with equivalent native                        Technologies Application Note, publication number 5994-
  Protein A columns.                                                                  2168EN, 2020.

  23                                                               Return to Contents Section
Application Note
Titer Determination

                            Cell Clone Selection Using the
                            Agilent Bio-Monolith Protein A
                            Column and LC/MS.

Authors                     Abstract
Emmie Dumont,
                            This application note describes how the Agilent Bio-Monolith Protein A column was
Isabel Vandenheede,
                            applied to determine recombinant monoclonal antibody titer in Chinese hamster
Pat Sandra, Koen Sandra
                            ovary cell-culture supernatants, and how the column was used to enrich μg amounts
Research Institute for      of antibody for further structural characterization by mass spectrometry.
Chromatography (RIC)        The workflow provides guidance for the clone selection process in
President Kennedypark 26    biopharmaceutical and biosimilar development.
B-8500 Kortrijk, Belgium
James Martosella,
Phu Duong, Maureen Joseph
Agilent Technologies, Inc

                                        Return to Contents Section                                         24
Introduction                                                                Experimental
Monoclonal antibodies (mAbs) are currently in widespread use                Materials
for the treatment of life-threatening diseases, including cancer
                                                                            Acetonitrile, water, and isopropanol were obtained from
and autoimmune diseases. Over 30 monoclonal antibodies are
                                                                            Biosolve (Valkenswaard, The Netherlands). Citric acid, formic
marketed, nine displayed blockbuster status in 2010, and five
                                                                            acid, NaH2PO4. Na2HPO4, and tris(2-carboxyethyl)phosphine
of the 10 top-selling biopharmaceuticals in 2009 were mAbs
                                                                            hydrochloride (TCEP) were purchased from Sigma-Aldrich,
[1]. mAbs are currently considered the fastest growing class of
                                                                            Corp. (St. Louis, MO, USA). Humanized monoclonal antibody
therapeutics. The knowledge that the topselling mAbs are, or will
                                                                            trastuzumab, marketed as Herceptin, was obtained from Roche
become, open to the market in the coming years has resulted
                                                                            (Basel, Switzerland). Trastuzumab biosimilar CHO cell-culture
in an explosion of biosimilar activity. The first two monoclonal
                                                                            supernatants were obtained from a local biotechnology company.
antibody biosimilars were approved in 2013, and both contain the
same active substance, infliximab [2].                                      Sample preparation
Whether developing innovator or biosimilar mAbs, well thought               Herceptin stock solution present at 21 mg/mL was diluted in
out clone selection is critical early on in the development                 mobile phase A for construction of the calibration curves. Cell
process. This application note describes how the                            supernatants were diluted 1:1 in 50 mM Na2HPO4. Supernatants
Agilent Bio-Monolith Protein A column can guide this process.               were centrifuged at 5.000 g for 5 minutes prior to injection.
This HPLC column is composed of a poly(glycidyl                             Collected fractions were reduced at room temperature for 1 hour
methacrylate-co-ethylene dimethacrylate) highly porous                      by adding 10 mM TCEP.
monolithic support coated with Protein A from Staphylococcus
                                                                            Instrumentation
aureus. It combines the advantages of monoliths, that is, fast and
efficient separations with limited carry-over, with the selectivity         Bio-Monolith Protein A measurements were performed on:
of the Protein A receptor for the Fc region of immunoglobulin G             –– Agilent 1100 Series Quaternary Pump (G1311A)
(IgG). As such, it represents an ideal tool for the high-throughput         –– Agilent 1100 Series Autosampler (G1313A)
determination of mAb titer and yield directly from cell-culture             –– Agilent 1100 Series Diode Array Detector (G1315A)
supernatants, and for purifying mAbs at analytical scale for
                                                                            –– Agilent 1200 Infinity Series Analytical-scale Fraction Collector
further measurements, for example by mass spectrometry (MS),
                                                                               (G1364C)
ion exchange (IEX), size-exclusion chromatography (SEC), or
hydrophobic interaction chromatography (HIC).                               LC/MS measurements were performed on:

We have illustrated the selection of trastuzumab- biosimilar-               Agilent 1290 Infinity Binary LC equipped with:
producing Chinese hamster ovary (CHO) clones, based on titer                –– Agilent 1290 Infinity Binary Pump (G4220B)
and structural characteristics, using the Bio-Monolith Protein              –– Agilent 1290 Infinity Autosampler (G4226A)
A column. Trastuzumab has been marketed as Herceptin                        –– Agilent 1290 Infinity Thermostat (G1330B)
since 1998, and is still in widespread use in the treatment of
                                                                            –– Agilent 6540 Ultra High Definition (UHD) Accurate-Mass
HER2 positive breast cancer [3]. This major biotherapeutic
                                                                               Q-TOF with Agilent Jet Stream LC/MS (G6540A)
becomes open to the market in 2014 in Europe and 2018 in the
US. To select clones based on biosimilar mAb titer, absolute
concentrations were determined making use of a calibration
curve generated with the Herceptin originator. To assess the
structural characteristics and to compare with the originator
molecule, the Protein A column was used to enrich analytical-
scale quantities of the mAbs prior to mass spectrometric
analysis.

25                                                         Return to Contents Section
Software                                                                      Conditions, LC/MS
–– Agilent Technologies OpenLAB CDS ChemStation revision                       Parameter          Value
   C01.05 (35)
                                                                               Cartridge:         Online desalting cartridge, 2.1 × 10 mm
–– Agilent Technologies MassHunter for instrument control
                                                                               Mobile phase:      A) 0.1% formic acid in water (v:v)
   (B05.01)
                                                                                                  B) 0.1% formic acid in acetonitrile (v:v)
–– Agilent Technologies MassHunter for data analysis (B06.00)
                                                                               Flow rate:         400 μL/min
–– Agilent Technologies BioConfirm software for MassHunter                     Injection          Variable (corresponding to a protein amount of 1 μg)
   (B06.00)                                                                    volume:

                                                                               Needle wash        60 % acetonitrile, 35 % water, 5 % isopropanol
Conditions, Bio-Monolith column
                                                                               solvent:
Parameter Value
                                                                               Autosampler        7 °C
Column:       Agilent Bio-Monolith Protein A (p/n5069-3639)                    temperature:
Mobile        A) 50 mM phosphate, pH 7.4                                       Gradient:          Time (min)              %B
phase:        B) 100 mM citric acid, pH 2.8                                                       0                       5
Gradient:     Time (min)             %B                                                           0.5                     5
              0 to 0.5               0 (binding)                                                  2                       80.0
              0.6 to 1.7             100 (elution)                                                3                       80.0
              1.8 to 3.5             0 (regeneration)                                             3.10                    5
                                                                                                  5                       5
Flow rate:    1 mL/min
                                                                               Q-TOF source:      Agilent Jet Stream, positive ionization mode

                                                                               Drying gas         300 °C
Injection     50 μL
                                                                               temperature:
volume:
                                                                               Drying gas         8 L/min
Detection:    UV at 280 nm
                                                                               flow rate:
Fraction      Time-based
                                                                               Drying gas         35 psig
collection:
                                                                               flow rate:

                                                                               Nebulizer          350 °C
                                                                               pressure:

                                                                               Sheath gas         11 L/min
                                                                               temperature:

                                                                               Nozzle voltage:    1,000 V

                                                                               Capillary          3,500 V
                                                                               voltage:

                                                                               Fragmentor         200 V
                                                                               voltage:

                                                                               Q-TOF              Mass range 3,200 amu
                                                                               detection:

                                                                               Data acquisition   500 to 3,200 m/z
                                                                               range:

                                                                               High-resolution    (4 GHz)
                                                                               mode

                                                                               Data acquisition   1 spectrum per s
                                                                               rate: mode

                                                                               Profile
                                                                               acquisition

                                                                               Diverter valve:    Time (min)              Flow to
                                                                                                  0                       waste
                                                                                                  1                       MS
                                                                                                  3.5                     waste

                                                              Return to Contents Section                                                                 26
Results and Discussion                                                      mAU
                                                                            3500
Clone selection through determination of
                                                                            3000
trastuzumab titer
Figure 1 shows an overlay of the Protein A chromatograms of                 2500
the supernatant of a specific trastuzumab-producing clone and
                                                                            2000       Binding                     Elution                               Regeneration
a Herceptin originator. The unbound material eluted in the flow-
through while the mAb was only released after lowering the pH.
                                                                            1500
In the case of the originator, no material was observed in the
flow-through, which is not surprising since this represents the             1000
marketed product. In the case of the supernatant, a substantial
signal resulting from the unbound material was seen.                         500

Figure 2 shows an overlay of the Protein A chromatograms of 12                 0
trastuzumab-producing clones, generated in the framework of a                      0         0.5             1                1.5          2             2.5          3           min
biosimilar development program. From these chromatograms, a
                                                                            Figure 1. UV 280 nm Agilent Bio-Monolith Protein A chromatogram of a
distinction can already be made between low and high producing              trastuzumab-producing CHO clone, clone 9 (red), and of a Herceptin
clones. Absolute mAb concentrations can be determined by                    originator diluted in 50 mM Na-phosphate pH 7.4 to 0.2 mg/mL (blue).
linking the peak areas to an external calibration curve constructed         Note that the supernatant was diluted 1:1 in phosphate buffer.
by diluting Herceptin originators.

                                                                                                       mAU

                                                                            mAU                        400

                                                                            3000                       300

                                                                            2500
                                                                                                       200

                                                                            2000
                                                                                                       100

                                                                            1500
                                                                                                         0
                                                                            1000                                 1.4    1.5          1.6   1.7     1.8          1.9   2       2.1 min

                                                                             500

                                                                               0

                                                                                   0             0.5         1                 1.5             2          2.5             3       min

                                                                            Figure 2. Overlaid UV 280 nm Agilent Bio-Monolith Protein A
                                                                            chromatograms of 12 trastuzumab-producing CHO clones.

27                                                         Return to Contents Section
The calibration curve and corresponding chromatograms of                                                             mAU               0.5 mg/mL
                                                                                                                      300
 the Herceptin calibration points are shown in Figures 3 and 4.                                                       250
                                                                                                                                        0.2 mg/mL
 Good linearity was obtained between 0.02 and 2 mg/mL,                                        mAU 200
 which is the typical mAb titer range in CHO cells. Obtained                                                          150
                                                                                            2500 100                                    0.1 mg/mL
 mAb titers are reported in Table 1 and are pictured graphically                                                       50               0.05 mg/mL
 in Figure 5. From these findings, clear decisions could be                                                               0
                                                                                                                                        0.02 mg/mL
                                                                                            2000
 made for further biosimilar development, that is,                                                                                1.2   1.4   1.6     1.8         2    2.2     2.4 min

 high-producing clones 9 and 10 could readily be selected and                                1500
 sub cloned. Table 1 also shows the titers obtained when
 growing the CHO clones in two different cell-culture media,                                 1000

 and clearly shows the benefit of one over the other, linking the                                                                                                                                                             2 mg/mL
                                                                                                     500                                                                                                                   1mg/mL
 peak areas to an external calibration curve constructed by diluting                                                                                                                                                   0.5 mg/mL
                                                                                                                                                                                                                   0.2 mg/mL
                                                                                                                                                                                                               0.1 mg/mL
 Herceptin originators.                                                                                           0                                                                                        0.05 mg/mL
                                                                                                                                                                                                       0.02 mg/mL

                                                                                                                                  0.5         1             1.5            2        2.5    3         3.5          4        min

                                                                                            Figure 4. Overlaid UV 280 nm Agilent Bio-Monolith Protein A
                                                                                            chromatograms of Herceptin calibration points.
   9000

   8000                                                           R 2 = 0.9999

       7000
                                                                                                              0.800

   6000
                                                                                                              0.700

   5000
                                                                                                              0.600
Area

                                                                                          Concentration (mg/mL)

   4000
                                                                                                              0.500

   3000
                                                                                                             0.400

   2000
                                                                                                              0.300

       1000
                                                                                                              0.200

          0
              0   0.2   0.4   0.6   0.8       1       1.2   1.4   1.6     1.8    2                                0.100
                                    Concentration (mg/mL)
                                                                                                              0.000
Figure 3. Herceptin Agilent Bio-Monolith Protein A calibration curve,                                                         3         6         8         9         10       14     24   25   26         27         28         32
0.02 to 2 mg/mL.                                                                                                                                                                 Clone

                                                                                             Figure 5. Graphical representation of the biosimilar mAb titer,
                                                                                             expressed in mg/mL, in the different trastuzumab CHO clones.

                                                                          Return to Contents Section                                                                                                                              28
Table 1. Absolute trastuzumab biosimilar concentrations determined in            ×106
the different CHO clones grown on two different media.                             4                                                 23,439.8

                                                                              Counts
                                                                                       2
 CHO Clone       Concentration     CHO Clone         Concentration                                                                                                           Originator 1
                                                                                                                                           23,537.5
 Medium A        (mg/mL)           Medium B          (mg/mL)                           0
                                                                                 ×106
 3               0.156             3                 0.210                                                                           23,439.8
                                                                                       2

                                                                              Counts
 6               0.048             6                 0.050
                                                                                       1                                                                                     Clone 9
 8               0.155             8                 0.256                                                                                 23,537.6 23,763.1
                                                                                       0

 9               0.215             9                 0.494                       ×106
                                                                                                                                     23,439.8
                                                                                       3

                                                                              Counts
 10              0.311             10                0.757                             2
                                                                                       1                                                                                     Clone 10
 14              0.038             14                0.050                                                                                 23,537.5 23,763.4
                                                                                       0
 24              0.082             24                0.262                                     22,600   22,800 23,000    23,200 23,400 23,600 23,800             24,000   24,200   24,400
                                                                                                                              Deconvoluted mass (amu)
 25              0.049             25                0.098
                                                                               Figure 6. Deconvoluted light chain spectra of a Herceptin originator
 26              0.037             26                0.090                     and two trastuzumab-producing clones.

 27              -                 27                0.018

 28              0.117             28                0.173

 32              0.156             32                0.144                                                                                  G1F
                                                                                  ×106
                                                                                   1.5                                             G0F     50,757.5
                                                                                                                                50,595.2
                                                                              Counts

                                                                                           1
                                                                                                                                                       G2F
                                                                                                                          G0                          50,919.7
Clone selection by assessing structural                                                0.5                              50,449.2                                              Originator 1
                                                                                           0
characteristics                                                                                                                    G0F
                                                                                  ×106                                          50,595.4
Next to the mAb titer, the second important criterion in clone                      1
                                                                              Counts

selection is based on the structural aspects. In the case of                                                                                G1F
                                                                                       0.5                                                 50,758.0    G2F
biosimilar development, the structure should be highly similar                                                      50,392.8                          50,919.7                Clone 9
to the originator product, within the originator batch-to-batch                            0
                                                                                                                                   G0F
variations. Therefore, Protein A fractions were collected and                     ×106                                          50,595.8
measured on high-resolution mass spectrometry following                             1
                                                                                                                                            G1F
                                                                              Counts

disulfide-bond reduction giving rise to the light and heavy chain.                     0.5                                                 50,758.0    G2F
                                                                                                                   50,368.4                           50,920.5                Clone 10
This strategy allowed verification of the amino acid sequence and                          0
                                                                                               50,000     50,200    50,400       50,600     50,800    51,000        51,200     51,400
revealed the glycosylation pattern.
                                                                                                                              Deconvoluted mass (amu)
To be able to reduce the mAb directly in the collection vial
                                                                               Figure 7. Deconvoluted heavy chain spectra of a Herceptin originator
containing acidic buffer, TCEP was chosen instead of the more                  and two trastuzumab producing clones. The abbreviations G0, G0F, G1,
common reductant dithiothreitol (DTT). The former allows                       and G2F refer to the N-glycans attached to the mAb backbone..
reduction over a broad pH range including low pH values,
while the latter’s reducing capacities are limited to pH values
above seven. Reduced fractions were delivered to the MS
system following online desalting. Figures 6 and 7 show the
deconvoluted light and heavy chain spectra of one Herceptin
originator and two high yield trastuzumab biosimilar-producing
clones.

29                                                            Return to Contents Section
Tables 2 and 3 display the measured MW values and relative                      These are considered the most important attributes of
intensity of the main glycoforms in four originator production                  biosimilarity according to US and European regulatory authorities
batches and 12 trastuzumab clones. From this, it can be                         (the primary sequence should be identical and glycosylation
concluded that the Herceptin originators and clone derived                      should be preserved). While glycosylation is similar from a
trastuzumab displayed the same light and heavy chain molecular                  qualitative perspective, quantitative differences were seen.
weight values.                                                                  A separate application note describes how the
In addition, the same N-glycans, which are of the complex type,                 Protein A Bio-Monolith was used in the tuning of the growth
were observed on the heavy chain of the originators and clone                   medium to fit the glycosylation to the originator specifications [4].
derived mAbs.

Table 2. Measured light and heavy chain MW values in the originators and trastuzumab clones.

 MW (Da)             Originator 1         Originator 2          Originator 3          Originator 4         Clone 3              Clone 6

 Light chain         23,439.8             23,439.8              23,439.8              23,439.8             23,439.8             23,440.2

 Heavy chain *       49,149.9             49,150.2              49,150.1              49,150.1             49,150.5             49,151.0

 MW (Da)             Originator 8         Originator 9          Originator 10         Originator 14        Clone 24             Clone 25

 Light chain         23,439.8             23,439.8              23,439.8              23,439.9             23,439.8             23,439.9

 Heavy chain *       49,150.6             49,150.1              49,150.5              49,150.2             49,150.6             49,151.1

 MW (Da)             Originator 26        Originator 27         Originator 28         Originator 32

 Light chain         23,440.0             23,441.4              23,439.8              23,439.9

 Heavy chain *       49,150.9             49,151.9              49,150.7              49,150.9

*Theoretical deglycosylated MW values.

                                                              Return to Contents Section                                                           30
Table 3. Relative intensity of the main glycoforms in four originator production batches and trastuzumab clones.

 Glycoform            Originator 1          Originator 2          Originator 3          Originator 4          Clone 3          Clone 6

 % Man 5              1.6                   1.6                   1.3                   1.1                   2.7              1.6

 % G0F-GlcNAc         1.5                   2.7                   3.3                   2.4                   3.2              3.2

 % G0                 5.7                   5.9                   5.0                   4.9                   2.8              3.3

 % G0F                35.2                  44.8                  50.5                  48.2                  66.1             56.2

 % G1F                45.2                  38.4                  34.0                  36.8                  20.6             27.7

 % G2F                10.7                  6.6                   5.9                   6.7                   4.7              8.1

 Glycoform            Clone 8               Clone 9               Clone 10              Clone 14              Clone 24         Clone 25

 % Man 5              2.6                   3.3                   5.0                   1.2                   1.9              5.1

 % G0F-GlcNAc         3.8                   4.8                   4.6                   2.1                   3.6              4.2

 % G0                 1.7                   2.9                   2.9                   3.9                   2.2              2.3

 % G0F                69.9                  66.1                  64.1                  64.6                  68.6             60.7

 % G1F                18.4                  18.5                  19.5                  22.9                  19.4             20.9

 % G2F                3.6                   4.3                   3.8                   5.3                   4.3              6.7

 Glycoform            Clone 26              Clone 27              Clone 28              Clone 32

 % Man 5              5.4                   0.0                   1.5                   3.1

 % G0F-GlcNAc         5.8                   0.0                   2.9                   4.3

 % G0                 1.8                   0.0                   1.2                   2.7

 % G0F                61.6                  67.2                  61.6                  64.3

 % G1F                19.5                  32.8                  26.3                  20.3

 % G2F                5.8                   0.0                   6.5                   5.3

Conclusions                                                                      References
The Agilent Bio-Monolith Protein A column was successfully                       1. 1. K. Sandra, I. Vandenheede, P. Sandra. J. Chromatogr. A.,
applied in the selection of trastuzumab-biosimilar-producing                        1335, 81 (2014).
clones based on both titer and structural similarity to the                      2. www.ema.europa.eu
originator. This clone selection process is of utmost importance                 3. www.gene.com
early in the development of innovator and biosimilar mAbs.
                                                                                 4. 4. E. Dumont, et al., Cell Culture Optimization Using an
                                                                                    Agilent Bio-Monolith Protein A Column and LC/MS,
                                                                                    Agilent Technologies Application Note, publication number
                                                                                    5991-5124EN (2014).

                                                                                 For More Information
                                                                                 These data represent typical results.
                                                                                 For more information on our products and services,
                                                                                 visit our Web site at www.agilent.com/chem.

31                                                              Return to Contents Section
Application Note
Titer Determination

                               mAb Titer Analysis with the Agilent
                               Bio-Monolith Protein A Column

Authors                        Abstract
Emmie Dumont, Isabel
                               Monoclonal antibodies (mAbs) are becoming increasingly important in thetreatment
Vandenheede, Pat Sandra, and
                               of various diseases. During development of recombinant mAbs, proteintiter and
Koen Sandra
                               yield from various cell culture supernatants must be monitored. Thisapplication note
Research Institute for         describes how the Agilent Bio-Monolith Protein A column was successfully applied
Chromatography (RIC)           in the determination of mAb concentrations.
President Kennedypark 26
B-8500 Kortrijk, Belgium
                               Introduction
James Martosella, Phu Duong
                               Protein A from Staphylococcus aureus has a very strong affinity for the Fc domain of
and Maureen Joseph
                               immunoglobulins (IgG), allowing its capture from complex matrixes such as cell-culture
Agilent Technologies, Inc
                               supernatants. Affinity chromatography making use of Protein A is the gold standard in
                               therapeutic monoclonal antibody (mAb) purification, and typically represents the first
                               chromatographic step in downstream processing. Protein A chromatography finds
                               applications beyond this large-scale purification. At the analytical scale, it is used early in the
                               development of mAbs for the high-throughput determination of mAb titer and yield directly
                               from cell culture supernatants, and to purify μg amounts of material for further measurements,
                               for example, by mass spectrometry (MS), ion-exchange (IEX), size exclusion chromatography
                               (SEC), or hydrophobic interaction chromatography (HIC).

                                             Return to Contents Section                                                        32
This application note describes the use of the Agilent                        Instrumentation
Bio-Monolith Protein A column in mAb titer analysis. This HPLC                Agilent Bio-Monolith Protein A measurements were performed on:
column (Figure 1) has a 5.2 mm id, a column length of 4.95
                                                                              –– Agilent 1100 Series Quaternary Pump (G1311A)
mm, and is composed of a highly cross-linked poly(glycidyl
                                                                              –– Agilent 1100 Series Autosampler (G1313A)
methacrylate-co-ethylene dimethacrylate) monolithic disk coated
with native Protein A from S. aureus. Its monolithic nature,                  –– Agilent 1100 Series Diode Array Detector (G1315A)
characterized by well-defined channels of 1,200 to 1,500 nm,
and by the absence of pores and voids, delivers fast and efficient
                                                                              Software
separations with negligible carryover and excellent robustness.
                                                                              –– Agilent Technologies OpenLAB CDS ChemStation revision
These are features typically expected from a column for mAb titer                C01.05 (35)
analysis, to successfully guide clone selection and cell-culture
optimization. We present the best practice for use of the column
in the determination of absolute mAb concentrations in Chinese                Conditions, Bio-Monolith column
hamster ovary (CHO) cell-culture supernatants. Data from a                    Parameter Value
trastuzumab biosimilar project are used for illustration purposes.            Column:      Agilent Bio-Monolith Protein A (p/n5069-3639)
Trastuzumab, marketed as Herceptin since 1998, is used in the                 Mobile       A) 50 mM phosphate, pH 7.4
treatment of HER2 positive breast cancer, and comes out of                    phase:       B) 100 mM citric acid, pH 2.8 mM acetic acid, pH 2.6
patent in 2014 in Europe, and 2018 in the United States.                      Gradient:    Time (min)             %B
                                                                                           0 to 0.5               0 (binding)
                                                                                           0.6 to 1.7             100 (elution)
Experimental                                                                               1.8 to 3.5             0 (regeneration)

                                                                              Flow rate:   1 mL/min
Materials
                                                                              Injection    Variable
Water was obtained from Biosolve (Valkenswaard,
                                                                              volume:      (50 μL, optimized for CHO cell culture supernatants)
The Netherlands). Citric acid, acetic acid, NaH2PO4 and Na2HPO4
                                                                              Detection:   UV at 280 nm
were purchased from Sigma-Aldrich, Corp. (St. Louis, MO,
USA). Humanized monoclonal antibody trastuzumab, marketed
as Herceptin, was obtained from Roche (Basel, Switzerland).
Trastuzumab biosimilar CHO cell culture supernatants were
obtained from a local biotechnology company.

Sample preparation
Herceptin stock solution present at 21 mg/mL was diluted in
mobile phase A prior to injection. Cell supernatants were diluted
1:1 in 50 mM Na2HPO4. Supernatants were centrifuged at 5,000 g
for 5 minutes prior to injection.

A                         B                                           C

Figure 1. UV 280 nm Agilent Bio-Monolith Protein A chromatogram of a trastuzumab-producing CHO clone, clone 9 (red), and of a Herceptin originator
diluted in 50 mM Na-phosphate pH 7.4 to 0.2 mg/mL (blue). Note that the supernatant was diluted 1:1 in phosphate buffer.

33                                                           Return to Contents Section
Results and Discussion                                                      mAU
                                                                            3,000
Buffer selection
                                                                            2,500
Figure 2 shows a typical chromatogram from the Protein A
column. The example chromatogram is one injection of the                    2,000
supernatant of a specific trastuzumab-producing CHO clone. The              1,500
unbound material eluted in the flow-through while the mAb was                               Binding    Elution                   Regeneration
                                                                            1,000
retained at neutral pH (binding) and was only released (elution)
after lowering the pH upon applying a step gradient. In this case,           500

50 mM Na-phosphate at pH 7.4 was used for binding/loading,                      0
and 100 mM citric acid at pH 2.8 for elution. This represents a                     0            0.5   1         1.5    2        2.5       3      min
good starting condition for any application.
                                                                            Figure 2. UV 280 nm Protein A chromatogram showing the supernatant
When developing a new method for a Protein A column, both                   of a trastuzumab-producing CHO clone. Injection volume was 50 μL.
binding and elution buffers should be optimized. For binding                Peak width at half height was 0.10 minutes for the unbound material
buffers, 50 mM Na phosphate, pH 7.4, is a good starting point,              and 0.06 minutes for the retained mAb.

and can be optimized between pH 7 and 8. For elution buffers,
the 100 mM citric acid used here is a good starting point. Other
possible elution buffers are 500 mM acetic acid, pH 2.6, 100 mM
glycine HCl, pH 2.8, and 12 mM HCl, pH 1.9.
                                                                            mAU         A
Figure 3 compares the elution of a Herceptin originator with
                                                                            1,000
acetic acid and citric acid. Very similar peak shape and area                 800
were observed, although peaks were slightly sharper using citric              600
                                                                              400
acid. In the case of this Herceptin originator, no material was               200
seen in the flow-through, which was not surprising since this                   0
                                                                                    0            0.5   1         1.5    2        2.5       3     min
represented the marketed product and was devoid of host-cell
                                                                            mAU         B
proteins. In the chromatograms shown, the flow rate was set at
                                                                             800
1 mL/min. The monolithic nature of the support, characterized                600
by convective instead of diffusive mass transfer, allowed for near           400
flow-rate independence and, hence, high-throughput separations.              200
                                                                               0
This is highly desirable in mAb titer determination, which                          0            0.5   1         1.5    2        2.5       3     min
typically requires the processing of a wide range of samples. The
maximum flow rate that can be applied on the column is 2 mL/                Figure 3. UV 280 nm Protein A chromatogram of Herceptin originator
min, which allows fast, sub-2-minute separations.                           diluted in 50 mM Na-phosphate, pH 7.4, to 0.5 mg/mL (50-μL injection,
                                                                            25-μg column load). Elution was achieved using citric acid (A) and
                                                                            acetic acid (B). Peak width at half height is 0.057 and 0.067 minutes for
                                                                            citric acid and acetic acid, respectively.

                                                           Return to Contents Section                                                             34
Precision, linearity, carryover, and injection size                                 mAU

Precision is critically important in the determination of the mAb
                                                                                     80
titer. Table 1 shows the peak area and retention time repeatability
that can typically be expected upon injecting a Herceptin                            60

originator 10 times. Chromatograms are shown in Figure 4. More
                                                                                     40
than acceptable relative standard deviation (RSD) values were
obtained for both citric acid and acetic acid as elution buffers.                    20

Carryover was simultaneously assessed by injecting a buffer
                                                                                      0
blank after the mAb injection sequence (Figure 5). At a 10-fold
                                                                                          0     0.5       1       1.5       2        2.5       3       min
column load of 5 μg, carryover appeared to be nonexistent,
which can again be attributed to the use of a monolithic support.
                                                                                    Figure 4. Replicate (n = 10) UV 280 nm Protein A chromatograms
Carryover at 1% levels became apparent upon a single load of                        of a Herceptin originator diluted in 50 mM Na phosphate, pH 7.4,
500 μg of mAb onto the column. This represents the maximum                          to 0.5 mg/mL (injection volume 5 μL). Elution was achieved using
column load and is one typically not encountered in real-life                       acetic acid.
experiments. It is worth noting that carryover was eliminated
after the injection of a second buffer blank.

Table 1. Retention time and peak area RSD values obtained for the
10-fold analysis of a Herceptin originator at 0.5 mg/mL (5 μL injection
volume).

              Acetic acid                   Citric acid

              Peak           RT             Peak           RT
              area           (min)          area           (min)

 1            361            1.669          383            1.666

 2            362            1.668          372            1.666

 3            373            1.668          365            1.665

 4            365            1.669          389            1.667

 5            370            1.669          383            1.666

 6            373            1.669          378            1.666

 7            367            1.671          379            1.678

 8            365            1.668          377            1.666

 9            366            1.670          376            1.667

 10           360            1.670          377            1.667

 Mean         366            1.669          378            1.667

 S            4.64           0.001          6.52           0.001

 % RSD        1.27           0.06           1.73           0.06

35                                                                 Return to Contents Section
The limit of detection (LOD) was around column loads of 0.5 μg.                                  In mAb titer determination, it is important to be able to assess
This put some demands on injection volume. If samples have                                       absolute mAb concentrations. These can be found by linking the
low mAb levels, high volume injections are required. Figure 6                                    peak areas measured in cell-culture supernatants to an external
shows the linearity obtained when increasing the injection volume                                calibration curve constructed by diluting a mAb standard. For
from 5 to 50 μL for a 1 mg/mL Herceptin originator. With the                                     the Herceptin biosimilar project, this standard was found in the
knowledge that 50 μL injections are perfectly feasible and that                                  originator product, which was accurately formulated at
the lowest detectable amount on-column is 0.5 μg, samples with                                   21 mg/mL. The calibration curves of a dilution series of Herceptin
mAb concentrations at 10 μg/mL are within reach.                                                 originators using citric acid and acetic acid as elution buffers are
                                                                                                 shown in Figure 7. The corresponding chromatograms are shown
                                                                                                 in Figure 8. In both cases, linearity was excellent, between 0.02
mAU
                                                                                                 mg/mL and 2 mg/mL, which is the typical mAb titer range in CHO
                                                                                                 cells.
  80

  60

                                                                                                       9,000             A
  40
                                                                                                       8,000                                                                  R 2 = 0.9999

                                                                                                       7,000
  20
                                                                                                       6,000

       0                                                                                               5,000

           0           0.5        1           1.5       2        2.5        3        min        Area   4,000
                                                                                                       3,000
Figure 5. UV 280 nm Protein A chromatograms of a Herceptin
                                                                                                       2,000
originator diluted in 50 mM Na phosphate, pH 7.4, to 0.5 mg/mL, and
a blank buffer analyzed after a sequence of 10 Herceptin injections.                                   1,000
Elution was achieved using acetic acid, and injection volumes were                                              0
5 μL.                                                                                                                0       0.2   0.4   0.6 0.8     1    1.2 1.4              1.6      1.8         2
                                                                                                                                           Concentration (mg/mL)

                                                                                                         10000

   5,000                                                                                                      9000                                                                   R 2 = 0.9996

   4,500                                                                                                      8000
                                                                       R 2 = 0.9999
   4,000                                                                                                      7000

                                                                                                              6000
   3,500
                                                                                                       Area

                                                                                                              5000
   3,000
                                                                                                              4000
Area

   2,500
                                                                                                              3000
   2,000
                                                                                                              2000
   1,500
                                                                                                              1000
   1,000
                                                                                                                0
                                                                                                                     0       0.2   0.4    0.6   0.8      1        1.2   1.4      1.6        1.8         2
           500                                                                                                                                  Concentration (mg/mL)

               0
                   0   5     10       15      20     25    30    35    40       45    50
                                                                                                 Figure 7. Herceptin Protein A calibration curve (0.02 to 2 mg/mL) using
                                           Injection volume (µL)
                                                                                                 citric acid (A) and acetic acid (B) as elution buffer.
Figure 6. Linearity obtained by increasing the injection volume of a
Herceptin originator (0.5 mg/mL) from 5 to 50 μL.

                                                                                Return to Contents Section                                                                                                  36
You can also read