This investment strategy recommendation has been prepared exclusively for Sample Client
←
→
Page content transcription
If your browser does not render page correctly, please read the page content below
e
      This investment strategy recommendation     pl
      has been prepared exclusively for
      Sample Client
                                    m
      XYZ Securities

      Joe Sample, CLU, ChFC
                    Sa

      215-407-5555 | joe@sample.com

    Proposal 287327                                                  Brinker Capital Inc., a registered investment advisor
This presentation is intended for one-on-one presentations with a financial advisor present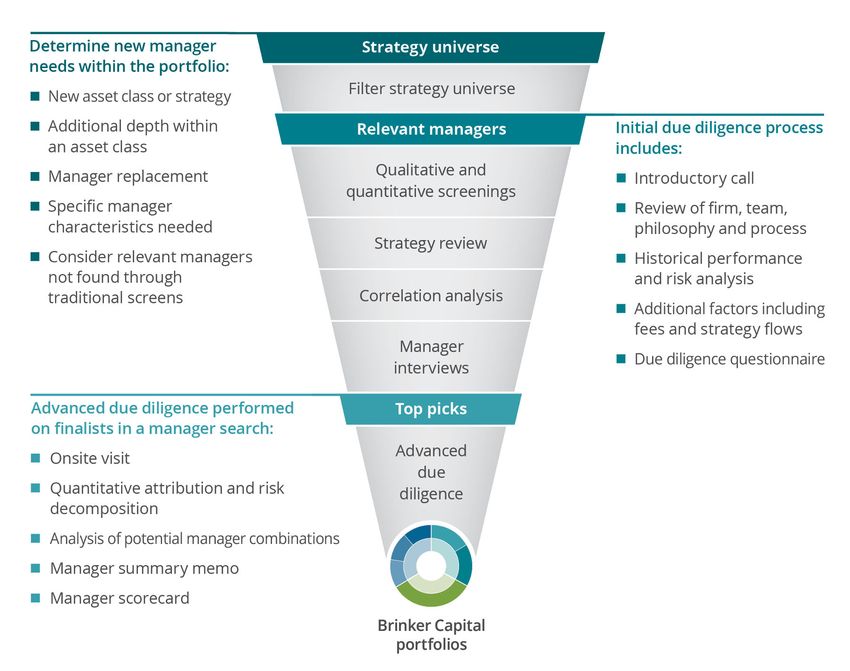
Dear Mr. & Mrs. Sample,

      Thank you for the opportunity to review your investment objectives and to provide you
      with the following investment strategy recommendation. Working together as a team,
      Brinker Capital and XYZ Securities will focus on meeting your needs and achieving your
      goals.

      This investment proposal will provide you with an overview of your investment
      objectives as well as insight into Brinker Capital's investment philosophy and approach.
      Since investments and the market can be complex, we aim to provide you with an
      improved understanding of our collaborative strategy to help you make more informed
      decisions.

      Since 1987, Brinker Capital has cultivated what we believe are great ideas from actively
      listening to the needs of financial advisors and investors. As a leading independent
      investment management firm, Brinker Capital has maintained a disciplined, broadly

                                                     e
      diversified approach to helping investors achieve better outcomes.
                                                  pl
      If you have questions about the proposed investment strategy or need adjustments
      made, please contact XYZ Securities.
                                    m
      Sincerely,
      XYZ Securities
      and
      Brinker Capital Wealth Advisory
                    Sa

    Proposal 287327                                                  Brinker Capital Inc., a registered investment advisor   1
This presentation is intended for one-on-one presentations with a financial advisor present
Investment profile
      The following is a summary of your
      investment objectives
      Sample Client Trust dated 1/1/2018 allocation factors
        Primary investment objective:                                Registration type: Trust
        Moderately Conservative - Long-term growth of
                                                                     State of residency: Pennsylvania
        capital with a modest level of volatility
                                                                     Tax bracket: 35%
        Time horizon: Five to ten years
                                                                     Subject to alternative minimum tax: No
        Income requirements: $13,666.67 monthly
                                                                     Net worth, excluding residence: $1,000,000 -
        Investment amount: $3,500,000
                                                                     $4,999,999

                                                     e
      John Sample IRA allocation factors
        Primary investment objective:
                                                  pl
        Moderately Conservative - Long-term growth of
        capital with a modest level of volatility
                                                                     Registration type: IRA

                                                                     Tax bracket: 35%

                                                                     Subject to alternative minimum tax: No
        Time horizon: Five to ten years
                                    m
                                                                     Net worth, excluding residence: $1,000,000 -
        Income requirements: None
                                                                     $4,999,999
        Investment amount: $500,000
                    Sa

      Jane Sample IRA allocation factors
        Primary investment objective:                                Registration type: IRA
        Moderately Conservative - Long-term growth of
                                                                     Tax bracket: 35%
        capital with a modest level of volatility
                                                                     Subject to alternative minimum tax: No
        Time horizon: Five to ten years
                                                                     Net worth, excluding residence: $1,000,000 -
        Income requirements: None
                                                                     $4,999,999
        Investment amount: $100,000

    Proposal 287327                                                  Brinker Capital Inc., a registered investment advisor   2
This presentation is intended for one-on-one presentations with a financial advisor present
A collaborative
approach
Brinker Capital Wealth Advisory works with your financial advisor
to identify the most appropriate investment strategy to meet your
unique needs.

   Your financial advisor will                                                            Brinker Capital will

                                                     e
      Work with you to identify                                                               Follow a disciplined approach
      goals and objectives, risk                                                              to diversify your assets across
      tolerance and time horizons                                                             multiple asset classes

      Meet with you regularly to
      explain your investment
      progress and keep you
                                                  pl                                          Perform extensive due
                                                                                              diligence on each money
                                                                                              manager considered for your
      informed                                                                                portfolio
                                    m
                                             As an investor, you are best
      Assist you in re-evaluating            served when you                                  Carefully select what we
      your investment objectives                                                              believe are the right
      whenever your needs change                                                              investment vehicles
                                                 Provide your advisor with all
                    Sa

      Coordinate activity between                relevant information about                   Provide a dedicated portfolio
      Brinker Capital and additional             your finances                                manager for ongoing support
      advisors
                                                 Determine your risk level and
                                                 establish your financial goals
                                                 and objectives

                                                 Communicate any investment
                                                 constraints or special
                                                 situations

                                                 Notify your advisor of any
                                                 changes to your goals or
                                                 financial circumstances

    Proposal 287327                                                  Brinker Capital Inc., a registered investment advisor   3
This presentation is intended for one-on-one presentations with a financial advisor present
Investment
      management
      About Brinker Capital
      Brinker Capital provides investment advisory and management
      services through customized solutions to help individuals,
      families and institutions protect and build wealth.

      We implement what we believe are great ideas
      with a disciplined approach to offer solutions
      designed to deliver better outcomes based on

                                                     e
      investors' personal goals.

      As an independent, privately-owned investment
                                                  pl
      manager backed by decades of discipline and
      fiduciary experience, we employ a multi-asset class
      approach to managing wealth.
                                    m
      This independence enables us to have the flexibility
      to make business changes, improve our enterprise,
      and act in the best interest of our clients. We
      believe that investing should be personal and
                    Sa

      focused on achieving goals and objectives.

    Proposal 287327                                                  Brinker Capital Inc., a registered investment advisor   4
This presentation is intended for one-on-one presentations with a financial advisor present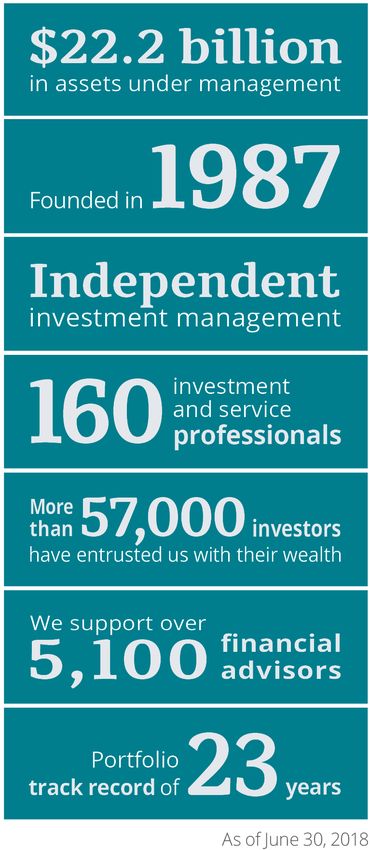
Investment
      management
      Philosophy and approach

         Wealth cannot be created if capital is not                        Dynamic, multi-asset class portfolios can deliver
         invested - and remains invested                                   more consistent risk-adjusted returns, keeping
                                                                           investors invested
         Thoughtfully constructing portfolios with a mix
         of growth, stable and diversifying assets                         Accountability and alignment of interests with
         enables investors to focus on outcomes                            our clients is paramount

                                                          e
                                                       pl
                                       m
                      Sa

Source: Brinker Capital. The chart is hypothetical in nature and is not intended to represent any Brinker Capital investment portfolio. Shown
for illustrative purposes only.

    Proposal 287327                                                        Brinker Capital Inc., a registered investment advisor      5
This presentation is intended for one-on-one presentations with a financial advisor present
Investment
management
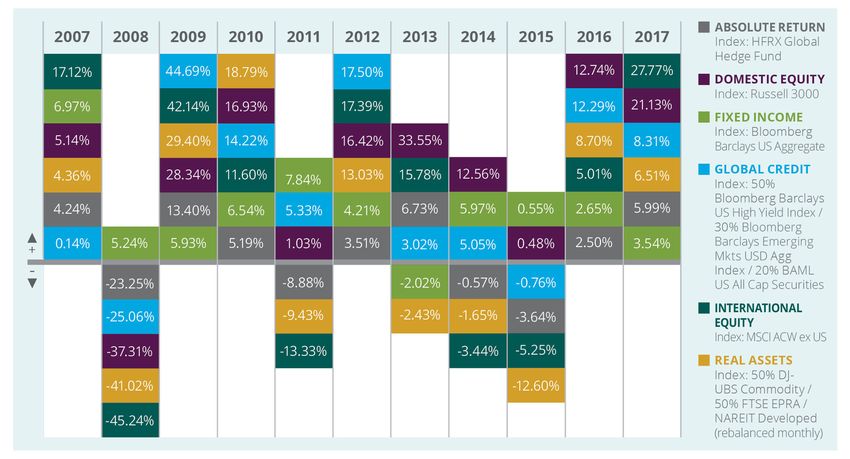
Principles and competencies
The principles that guide us are: Our core competencies are:
Diversification - Multi-asset class investing for Asset allocation - We identify cyclical and
more consistent, risk-adjusted returns secular trends to generate alpha
Innovation - We seek opportunities beyond style Manager due diligence - Active managers
boxes and published data who create value exist and can be identified
Active management - Value creation through Portfolio construction - We build dynamic
e
asset allocation and strategy selection portfolios across the risk spectrum
pl
m
Sa
Prior to April 1, 2012, the Global Credit Index was comprised of the following: 50% Bloomberg Barclays US High Yield Index / 30% Bloomberg
Barclays Emerging Markets USD Aggregate Index / 20% BAML Perpetual Preferred Security Index. Diversification does not ensure success or
guarantee against loss. Please refer to the Disclosure and Glossary of Terms pages for additional information.
Proposal 287327 Brinker Capital Inc., a registered investment advisor 6
This presentation is intended for one-on-one presentations with a financial advisor present
Investment
      management
      Dynamic asset allocation

      Our dynamic portfolios feature a strategic approach
      complemented by an active overlay.

         Set long-term strategic asset class weights

         Implement active shifts across and within asset classes

                                                          e
         Reallocations occur throughout the year as dictated
         by market conditions and our macro view
                                                       pl
                                       m
                      Sa

Source: Brinker Capital. The chart is hypothetical in nature and is not intended to represent any Brinker Capital investment portfolio. Shown
for illustrative purposes only.

    Proposal 287327                                                        Brinker Capital Inc., a registered investment advisor      7
This presentation is intended for one-on-one presentations with a financial advisor present
Investment
management
Manager research and selection
Our comprehensive approach to portfolio design within a portfolio and remain flexible in how we
goes beyond style boxes and trending investment implement our multi-asset class investment
managers. philosophy.
We consider the underlying positions of a holding, Because the markets can change quickly, we
how the managers operate and how they may maintain active oversight of our portfolios. We
complement other managers within the portfolio. strive to incorporate our best ideas into your
We find managers to play a specific role portfolio so that it reflects our most up-to-date
e
thinking and current market conditions.
pl
m
Sa
Proposal 287327 Brinker Capital Inc., a registered investment advisor 8
This presentation is intended for one-on-one presentations with a financial advisor presentInvestment
management
Construction and monitoring
Review absolute & relative performance of portfolios & managers
Evaluate performance attribution
Review market & economic charts
Leverage investment research
Communicate with managers
e
pl
Meet to review findings
Assess drift in major & sub asset class weightings
Stress test & report on risk
m
Reaffirm market outlook
Sa
Review positioning for potential reallocations
Assess the need for any new manager searches
Perform onsite meetings with all active managers
Review annual manager questionnaire
Complete a new manager scorecard
Assess asset manager performance relative to expectations
Proposal 287327 Brinker Capital Inc., a registered investment advisor 9
This presentation is intended for one-on-one presentations with a financial advisor presentPortfolio design
A comprehensive and customized approach
Tailored portfolio and risk management
Manager selection based on unique circumstances
Asset allocation, which may reflect outside assets
Tax considerations
Goals-based investment solutions
e
pl
m
Sa
Proposal 287327 Brinker Capital Inc., a registered investment advisor 10
This presentation is intended for one-on-one presentations with a financial advisor presentPortfolio
allocation themes
Our market insights and risk positioning
help shape portfolio allocations
e
pl
m
Sa
Source: Brinker Capital. Views may change over time. Themes and specific funds utilized to implement themes are discussed within the
context of Brinker Capital's managed asset allocations and are based on current market conditions and constitute Brinker Capital's judgment
and opinions, which are subject to change without notice. Past performance does not guarantee future results. Statements referring to
future actions or events, such as the future financial performance of certain asset classes or market segments, are based on the current
expectations and projections about future events provided by various sources, including Brinker Capital's Investment Management Group.
These statements are not guarantees of future performance and actual events may differ materially from those discussed.
Proposal 287327 Brinker Capital Inc., a registered investment advisor 11
This presentation is intended for one-on-one presentations with a financial advisor presentInvestment
recommendation
Considering investment timeframe, objectives and risk profile, we recommend the
following allocation:
Sample Client
Account name Strategy Amount
Sample Client Trust dated 1/1/2018 Core Asset Manager $3,500,000
John Sample IRA Core Asset Manager $500,000
Jane Sample IRA Core Asset Manager $100,000
e
Sample Client Total $4,100,000
plAsset class
DOMESTIC EQUITY
Weight
28%
Amount
$1,155,000
INTERNATIONAL EQUITY 10% $430,000
m
FIXED INCOME 53% $2,155,000
GLOBAL CREDIT 3% $110,000
Sa
ABSOLUTE RETURN 6% $250,000
Proposal 287327 Brinker Capital Inc., a registered investment advisor 12
This presentation is intended for one-on-one presentations with a financial advisor presentCustomized
portfolio allocation
As of 8/31/2018. Holdings subject to change. Information shown for comparison purposes. Please refer to the
Disclosure and Glossary of Terms pages for additional information.
Investment manager Registration name Amount Weight Estimated
income
DOMESTIC EQUITY
The London Company Income Equity Sample Client Trust dated $345,000 8.41% $9,350
Large Cap Value 1/1/2018
Sustainable Growth Advisors U.S. Sample Client Trust dated
Large Cap Growth SMA 1/1/2018 $325,000 7.93% $3,348
Domestic Equity
iShares Sample Client Trust dated $165,000 4.02% $3,069
Core S&P 500 ETF 1/1/2018
e
iShares Sample Client Trust dated $85,000 2.07% $986
Russell 2000 ETF 1/1/2018
GW&K pl John Sample IRA $235,000 5.73% $2,491
SMID Cap Core
INTERNATIONAL EQUITY
Lazard Intl Equity Select ADR SMA Sample Client Trust dated $195,000 4.76% $4,154
International Equity 1/1/2018
m
iShares Core MSCI EAFE ETF Sample Client Trust dated $80,000 1.95% $2,376
International Equity 1/1/2018
Baron Emerging Markets Fund John Sample IRA $155,000 3.78% $760
Emerging Markets
Sa
FIXED INCOME
Belle Haven Ladder PLUS SMA Sample Client Trust dated $2,055,000 50.12% $78,090
Municipal Fixed Income 1/1/2018
Roosevelt Jane Sample IRA $100,000 2.44% $4,690
Current Income Portfolio
GLOBAL CREDIT
RiverPark Strategic Income
Institutional Fund John Sample IRA $110,000 2.68% $5,225
High Yield
Proposal 287327 Brinker Capital Inc., a registered investment advisor 13
This presentation is intended for one-on-one presentations with a financial advisor presentCustomized
portfolio allocation
As of 8/31/2018. Holdings subject to change. Information shown for comparison purposes. Please refer to the
Disclosure and Glossary of Terms pages for additional information.
Investment manager Registration name Amount Weight Estimated
income
ABSOLUTE RETURN
Asset Class Strategies Sample Client Trust dated $250,000 6.10% $3,325
Absolute Return 1/1/2018
AMG River Road Long-Short Fund 1.43%
William Blair Macro Allocation Fund 1.36%
IQ Hedge Multi-Strategy Tracker ETF 1.29%
AQR Style Premia Alternative LV Fund 1.25%
e
SilverPepper Merger Arbitrage Fund 0.51%
Cash pl 0.27%
m
Sa
Proposal 287327 Brinker Capital Inc., a registered investment advisor 14
This presentation is intended for one-on-one presentations with a financial advisor presentPortfolio analytics
Risk and return (gross of fees)
Allocating assets within a risk budget is one of the key
elements for successful portfolio management.
This analysis allows an investor to gain an RECOMMENDED Blended Benchmark
understanding for the amount of risk the INVESTMENT S&P 500
STRATEGY BB US Aggregate
recommended strategy contains. In addition, it helps
illustrate how this allocation might react in different
market environments.
Risk and return (July 2013 - June Risk statistics (July 2013 - June 2018)
e
2018)
1.5
15
10
pl 1
0.5
m
5 0
-0.5
0 SHARPE RATIO BETA
ANNUALIZED RETURN STD. DEV.
Sa
Risk analysis (July 2013 - June 2018)
Annualized Standard Sharpe Max
Beta
return deviation ratio drawdown
RECOMMENDED INVESTMENT
6.08% 3.97% 1.42 -3.20% 0.36
STRATEGY
Blended Benchmark 5.06% 3.86% 1.20 -3.82% 0.37
S&P 500 13.41% 9.72% 1.34 -8.35% 1.00
BB US Aggregate 2.27% 2.68% 0.69 -3.28% -0.02
Information shown above is based on the asset allocation created by Brinker Capital based on the information supplied by the client. The
recommended investment strategy referenced does not have performance data available for the entire period. The returns are calculated
gross (before the deduction) of advisory fees payable to Brinker Capital or other expenses for services not covered by the advisory
fee. These fees and expenses will reduce your return. Investors may not invest directly in an index. Past performance is no guarantee of
future results or trends. Please refer to the Disclosure and Glossary of Terms pages for additional information.
Proposal 287327 Brinker Capital Inc., a registered investment advisor 15
This presentation is intended for one-on-one presentations with a financial advisor presentPortfolio analytics
A look at how the recommended
investment strategy would have
performed (gross of fees)
The performance graphs show the growth of a RECOMMENDED Blended Benchmark
$100,000 investment of the recommended INVESTMENT S&P 500
STRATEGY BB US Aggregate
investment strategy vs. Blended Benchmark, S&P 500
& BB US Aggregate.
Growth of $100,000 (July 2013 - June 2018)
e
$ 200 000
$ 180 000
pl
m
$ 160 000
$ 140 000
Sa
$ 120 000
$ 100 000
$ 80 000
2014 2015 2016 2017 2018
Information shown above is based on the asset allocation created by Brinker Capital based on the information supplied by the client. The
recommended investment strategy referenced does not have performance data available for the entire period. The Growth of $100,000 chart
reflects a hypothetical $100,000 investment made at inception with no additional trading and all dividends reinvested. The returns are
calculated gross (before the deduction) of advisory fees payable to Brinker Capital or other expenses for services not covered by
the advisory fee. These fees and expenses will reduce your return. Investors may not invest directly in an index. Past performance is no
guarantee of future results or trends. Please refer to the Disclosure and Glossary of Terms pages for additional information.
Proposal 287327 Brinker Capital Inc., a registered investment advisor 16
This presentation is intended for one-on-one presentations with a financial advisor presentPortfolio analytics
Recommended investment
strategy (gross of fees)
The following illustrates the recommended RECOMMENDED Blended Benchmark
investment strategy versus Blended Benchmark, S&P INVESTMENT S&P 500
STRATEGY BB US Aggregate
500 & BB US Aggregate.
Calendar year returns (January 2014 - June 2018)
30
20
RETURN %
e
10
0
-10
QTD YTD
pl 2017 2016 2015 2014
m
QTD YTD 2017 2016 2015 2014
RECOMMENDED INVESTMENT STRATEGY 1.09% 0.58% 11.27% 3.68% 1.70% 5.75%
Blended Benchmark 1.04% 0.34% 9.79% 4.12% 0.23% 4.53%
Sa
S&P 500 3.44% 2.65% 21.82% 11.94% 1.39% 13.66%
BB US Aggregate -0.16% -1.62% 3.54% 2.65% 0.55% 5.97%
Information shown above is based on the asset allocation created by Brinker Capital based on the information supplied by the client. The
recommended investment strategy referenced does not have performance data available for the entire period. The returns are calculated
gross (before the deduction) of advisory fees payable to Brinker Capital or other expenses for services not covered by the advisory
fee. These fees and expenses will reduce your return. Investors may not invest directly in an index. Past performance is no guarantee of
future results or trends. Please refer to the Disclosure and Glossary of Terms pages for additional information.
Proposal 287327 Brinker Capital Inc., a registered investment advisor 17
This presentation is intended for one-on-one presentations with a financial advisor presentPortfolio analytics
Recommended investment
strategy (gross of fees)
The following illustrates the recommended RECOMMENDED Blended Benchmark
investment strategy versus Blended Benchmark, S&P INVESTMENT S&P 500
STRATEGY BB US Aggregate
500 & BB US Aggregate.
Annualized returns (July 2013 - June 2018)
20
RETURN %
10
e
0 pl
-10
QTD YTD 1 Year 3 Years 5 Years
m
QTD YTD 1 Year 3 Years 5 Years Std. dev.
RECOMMENDED INVESTMENT STRATEGY 1.09% 0.58% 5.12% 5.06% 6.08% 3.97%
Blended Benchmark 1.04% 0.34% 4.76% 4.33% 5.06% 3.86%
Sa
S&P 500 3.44% 2.65% 14.37% 11.92% 13.41% 9.72%
BB US Aggregate -0.16% -1.62% -0.40% 1.72% 2.27% 2.68%
Information shown above is based on the asset allocation created by Brinker Capital based on the information supplied by the client. The
recommended investment strategy referenced does not have performance data available for the entire period. The returns are calculated
gross (before the deduction) of advisory fees payable to Brinker Capital or other expenses for services not covered by the advisory
fee. These fees and expenses will reduce your return. Investors may not invest directly in an index. Past performance is no guarantee of
future results or trends. Please refer to the Disclosure and Glossary of Terms pages for additional information.
Proposal 287327 Brinker Capital Inc., a registered investment advisor 18
This presentation is intended for one-on-one presentations with a financial advisor presentPortfolio analytics
A look at how the recommended
investment strategy would have
performed (gross of fees)
The following illustrates the recommended RECOMMENDED Blended Benchmark
investment strategy versus Blended Benchmark, S&P INVESTMENT S&P 500
STRATEGY BB US Aggregate
500 & BB US Aggregate.
Upside / Downside (July 2013 - June 2018)
150%
e
UPSIDE %
100%
50%
0%
pl
0% 20% 40% 60% 80% 100%
m
DOWNSIDE %
S&P 500 Index
# of qtrs Average return 1 Year Up Down R.
Sa
Up Down Up Down Best Worst capture capture squared
RECOMMENDED
15 5 2.29% -0.87% 12.18% -1.90% 42.16% 35.73% 78.05
INVESTMENT STRATEGY
Blended Benchmark 15 5 1.96% -0.87% 10.79% -3.42% 38.64% 38.77% 85.32
S&P 500 18 2 4.01% -3.59% 26.39% -6.19% 100.00% 100.00% 100.00
BB US Aggregate 14 6 1.32% -1.16% 6.61% -0.51% 8.17% -7.02% 0.41
Information shown above is based on the asset allocation created by Brinker Capital based on the information supplied by the client. The
recommended investment strategy referenced does not have performance data available for the entire period. The returns are calculated
gross (before the deduction) of advisory fees payable to Brinker Capital or other expenses for services not covered by the advisory
fee. These fees and expenses will reduce your return. Investors may not invest directly in an index. Past performance is no guarantee of
future results or trends. Please refer to the Disclosure and Glossary of Terms pages for additional information.
Proposal 287327 Brinker Capital Inc., a registered investment advisor 19
This presentation is intended for one-on-one presentations with a financial advisor presentPortfolio analytics
Monte Carlo simulation
The following graph depicts simulated values of ASSUMPTIONS:
the recommended strategy under selected MONTHLY INCOME REQUIREMENT: $13,667
probability market scenerios over the WITHDRAWAL START DATE: 8/1/2020
investment time horizon. This may be useful in PORTFOLIO FEE: 1.25%
projecting outcomes. AVERAGE RETURN: 5.26%
STANDARD DEVIATION: 6.74%
INFLATION RATE: 3.00%
Monte Carlo simulation as of 8/1/2020
$ 10 000 000
e
90th Percentile
75th Percentile
$ 8 000 000
$ 6 000 000
pl 50th Percentile
25th Percentile
10th Percentile
m
$ 4 000 000
$ 2 000 000
Sa
$0
2020 2025 2030 2035
The actual advisory fee may be more or less than the fee reflected in the above projection. Any additional fee and expenses will reduce the portfolio and
your return. See the accompanying disclosure statement regarding performance results, benchmarks, the impact of fees and other information included in
the investment strategy recommendation.
The purpose of this analysis is to provide investors with the probable 50th (Average), 10th (Lower 10 Percent). 25th (Lower 25 Percent), 75th (Upper 25
Percent) and 90th (Upper 10 Percent) percentile values that a selected portfolio will observe under hypothetical market scenarios over a period of time.
80% of simulation trials occur between the 90th and the 10th percentile range. 10% of simulated outcomes fall below the 10th percentile line and should
be examined in order to help investors recognize their level of risk tolerance. This analytical technique in which a large number of simulations are run using
random quantities for portfolio rate of return looks at the distribution of results to infer which values are most likely. The probability of various outcomes
shown in this illustration is obtained by generating 5,000 random values within the upper and lower boundaries of returns.
The Monte Carlo calculations are based on the portfolio rate of return, the portfolio standard deviation (volatility), the time period analyzed and cash flows
(contributions and withdrawals) made during the time period. Standard deviation is a statistical measure of the historical volatility of a portfolio or one or
more of its assets. More generally, it is a measure of the extent to which numbers are spread around their average. The assumed returns are adjusted
based upon the historical standard deviations of return for asset classes and/or securities which measure the volatility or deviation of annual returns of an
asset class or security from its average. Changing any of these variables will impact the probability of achieving outcomes.
IMPORTANT: The projections or other information generated by AdvisoryWorld's Monte Carlo simulation application regarding the likelihood of various
investment outcomes are hypothetical in nature, do not reflect actual investment results and are not guarantees of future results. This Monte Carlo
simulation is for illustrative purposes to educate parties about the effects of volatility and uncertainty over time. Results may vary with each use and over
time. Do not rely upon the results of this report to predict actual future performance of any investment or investment strategy.
Proposal 287327 Brinker Capital Inc., a registered investment advisor 20
This presentation is intended for one-on-one presentations with a financial advisor presentPortfolio analytics
Risk and return projections
Recommended investment 25th 50th 75th
strategy Percentile Percentile Percentile
Risk and return
Annualized return forecast 5.26%
Estimated value in 5 years $4,110,317 $4,626,990 $5,222,287
Estimated value in 10 years $3,994,830 $4,773,247 $5,718,133
Estimated value in 15 years $3,744,209 $4,891,241 $6,267,827
e
Estimated value in 20 years $3,266,221 $4,759,731 $6,715,167
Risk budget
Annualized standard deviation
forecast
pl 6.75%
m
Sharpe ratio forecast 0.49
Probability of loss over a 1 year
21.79%
period
Sa
Probability of loss over a 5 year
4.07%
period
One year 95% value at risk $239,329
As of 8/31/2018. Holdings subject to change. Information shown above is hypothetical and for comparison purposes only. Past performance
does not guarantee or predict future results. Information based on Monte Carlo model is hypothetical in nature and shown for illustrative
purposes only. Please refer to the Disclosure and Glossary of Terms pages for additional information.
Proposal 287327 Brinker Capital Inc., a registered investment advisor 21
This presentation is intended for one-on-one presentations with a financial advisor presentPortfolio analytics
Cash flow projections
25th Percentile 50th Percentile 75th Percentile
Withdrawal Market value Withdrawal Market value Withdrawal Market value
2018 $4,066,894 $4,168,723 $4,283,890
2019 $4,152,142 $4,391,242 $4,605,705
2020 $68,673 $4,203,379 $68,673 $4,508,983 $68,673 $4,816,076
2021 $168,302 $4,155,961 $168,302 $4,529,237 $168,302 $4,957,824
2022 $173,347 $4,154,593 $173,347 $4,598,533 $173,347 $5,098,582
2023 $178,544 $4,110,317 $178,544 $4,626,990 $178,544 $5,222,287
e
2024 $183,909 $4,053,481 $183,909 $4,639,033 $183,909 $5,293,041
2025
2026
$189,425
$195,104
$4,072,114
$4,070,172
pl $189,425
$195,104
$4,698,054
$4,708,280
$189,425
$195,104
$5,426,738
$5,510,746
2027 $200,953 $4,019,213 $200,953 $4,753,213 $200,953 $5,620,956
m
2028 $206,991 $3,994,830 $206,991 $4,773,247 $206,991 $5,718,133
2029 $213,200 $3,925,359 $213,200 $4,817,146 $213,200 $5,802,395
Sa
2030 $219,591 $3,884,815 $219,591 $4,884,549 $219,591 $5,935,225
2031 $226,174 $3,847,963 $226,174 $4,850,178 $226,174 $6,042,665
2032 $232,971 $3,808,182 $232,971 $4,822,056 $232,971 $6,159,282
2033 $239,958 $3,744,209 $239,958 $4,891,241 $239,958 $6,267,827
2034 $247,152 $3,638,544 $247,152 $4,849,302 $247,152 $6,384,912
2035 $254,561 $3,536,964 $254,561 $4,777,627 $254,561 $6,432,245
2036 $262,211 $3,423,325 $262,211 $4,742,439 $262,211 $6,585,773
2037 $270,075 $3,294,593 $270,075 $4,763,684 $270,075 $6,628,140
2038 $184,531 $3,266,221 $184,531 $4,759,731 $184,531 $6,715,167
Information shown above is hypothetical and for comparison purposes only. Past performance does not guarantee or predict future results.
Information based on Monte Carlo model is hypothetical in nature and shown for illustrative purposes only. Please refer to the Disclosure
and Glossary of Terms pages for additional information.
Proposal 287327 Brinker Capital Inc., a registered investment advisor 22
This presentation is intended for one-on-one presentations with a financial advisor presentDedicated
investment resources
Introducing your Brinker Capital portfolio
management team
Your dedicated investment resources will work with you
and your advisor throughout your relationship with Brinker
Capital.
Your portfolio management team will:
Your dedicated
e
Monitor your portfolio to ensure it is portfolio manager
reflective of your investment strategy
objectives pl Mitch Kerr
18 years of industry
Proactively provide reallocation advice as experience
market conditions and opportunities warrant CFA; Series 7 & 66
BBA Finance, University
m
Provide access to specialized services, as of Notre Dame
appropriate, based on your investment
management needs 610-407-8394
mkerr@brinkercapital.com
Sa
Work with you and your advisor to
recommend appropriate changes to your
investment strategy if financial circumstances
change Your dedicated
investment strategist
It is also important to stay abreast of Libin Jacob
your portfolio and the market, so we'll
6 years of industry
keep you informed through:
experience
Daily online account access Series 7 & 66
BS Finance, Villanova
Robust quarterly reports University
Market and investment commentary
610-407-5558
ljacob@brinkercapital.com
Proposal 287327 Brinker Capital Inc., a registered investment advisor 23
This presentation is intended for one-on-one presentations with a financial advisor presentClient fees
Based upon this proposal, the fees for all assets are detailed
below.
This fee covers the following costs associated with your investments:
Asset allocation and portfolio construction by Custody of assets
Brinker Capital
Detailed performance reporting, monthly
All ongoing investment manager due diligence statements and trade confirmations
provided by Brinker Capital
Continuous monitoring of your investment
Fees paid to the separate account investment strategy, relative to your risk and objectives
managers for asset management services
Proactive communications from your Brinker
Transaction/clearing costs generated in the Capital portfolio manager
e
purchase and sale of certain exchange-traded
Compensation to XYZ Securities and Joe Sample,
funds or equity securities in the portfolio. In
pl CLU, ChFC for assisting in the development and
certain cases, separate per-ticket charges may
ongoing monitoring of your investment strategy
apply*
Account name Brinker Capital program Assets Fee
m
Sample Client Trust dated 1/1/2018 Core Asset Manager $3,500,000 1.24%
John Sample IRA Core Asset Manager $500,000 1.25%
Sa
Jane Sample IRA Core Asset Manager $100,000 1.47%
Total Blended Fee for All Registrations 1.25%
This blended fee will vary based upon the allocation of assets as well as changes in asset allocation, manager selection and total portfolio
value (resulting from appreciation, depreciation, liquidations or additional contributions) for each registration. The blended fee reflects the
fees payable with respect to the proposed initial assets invested. The total annual fee is exclusive of mutual fund and exchange-traded fund
expense ratios, which are set forth in the prospectus for each fund.
*While the Brinker Capital component of the fee is fixed, fees for different strategies vary and such fees may change based upon the
allocations among managers and funds included in a strategy. Accordingly, the blended fee will fluctuate depending upon both the allocation
among the strategies and the allocations within the strategies. See Schedule C of the Investment Advisory Agreement for a detailed
breakdown of the components of the blended fee.
Proposal 287327 Brinker Capital Inc., a registered investment advisor 24
This presentation is intended for one-on-one presentations with a financial advisor presentDisclosure and Glossary of Terms
Performance Data: All return calculations are in U.S. dollars and are gross of advisory fees payable to Brinker Capital and any other
expenses not covered by the advisory fee (see “Fees” section).
Core Accounts: The performance information for the Core Investment Strategy presents back-tested performance of a hypothetical account
invested with the managers, mutual funds and other investments included in the recommended Investment Strategy based upon Brinker
Capital’s recommended allocation. No representation that any actual account has achieved such performance is intended. All calculations are
based on monthly data and assume annual rebalancing of the account to the target allocations in the recommended Investment Strategy.
Since Brinker Capital does not regularly rebalance Core accounts (unless specifically requested by the client) the actual performance of an
account invested in accordance with the recommended Investment Strategy over the historical period would likely have differed from the
performance information set forth herein.
The performance results for investment managers and private funds used to provide the performance information included herein are
based on historical composite data provided to Brinker Capital by the proposed managers and funds or by third party sources. Brinker
Capital has not independently verified such data but believes the sources for such data to be reliable and accurate.
The performance information should only be utilized as a generalized indicator of an investment manager’s or fund’s performance versus
comparable indices and should not be used by a prospective investor for any other purposes, including an investor’s specific and final
determination regarding the selection of a manager or fund or specific investment decisions. Furthermore, past performance of the
managers, funds or other investments included in the recommended Investment Strategy is not a guarantee of future results or
trends.
Calculation Methodology:Since January 1, 1993, most managers utilize a consistent methodology, based on the Performance Standards of
the Association for Investment Management and Research (AIMR-PPS), which became the U.S. and Canadian version of the Global Investment
Performance Standards (GIPS®) in 2001 and converged with the GIPS standards on January 1, 2006, for computing the performance results.
However, the individual managers that were responsible for compiling this performance data may have utilized divergent methodologies and
composites in calculating these results and consequently direct comparisons between investment managers based on this information is not
possible. All of the manager performance results included in the performance results for the Investment Strategy are time weighted
performance calculations representing total returns for the full historical period and include appreciation and reinvestment of dividends and
other income and are calculated prior to the deduction of advisory or management fees, but after the deduction of transaction expenses,
where applicable. Transaction costs normally deducted from gross performance results are not deducted from wrap fee accounts included in
e
a manager’s composite. The results may or may not include the results from any wrap fee accounts. Detailed analysis of the performance
results and other manager information, including specific information with respect to a manager’s selection criteria for the accounts included
in such manager’s performance results and the manager’s calculation methodology, are available upon request.
Actual Performance data is not available for Asset Class Strategies - Absolute Return for the period prior to 12/31/2015. In computing
pl
performance for the recommended Investment Strategy, Brinker Capital has used the return of HFRX Global for the period for which actual
performance data is unavailable. Brinker Capital believes that HFRX Global is an appropriate proxy for Asset Class Strategies - Absolute
Return performance given that it represents the most appropriate benchmark for the strategy employed by the investment manager. If
Asset Class Strategies - Absolute Return had been in operation during the entire period, its return may have been higher or lower than HFRX
Global returns.
Fund Performance: Mutual Fund and Exchange Traded Fund (ETF) performance information is based upon published performance of the
m
mutual funds or ETFs, which must be calculated by the funds in accordance with rules and regulations promulgated by the Securities and
Exchange Commission.
Certain mutual funds included in the Recommended Investment Strategy have not been in existence for the entire performance period and,
therefore, actual performance data is not available for such funds. In computing performance for the recommended Investment Strategy,
Brinker Capital has used the average return of the relevant Morningstar Category for the period for which actual fund performance data is
unavailable. Performance information for and for the Barclays US High Yield 1-3 year Index was used for RiverPark Strategic Income
Institutional Fund - High Yield prior to 10/01/2013. Morningstar Category average returns represent the unweighted average of returns of all
Sa
funds in a particular Morningstar Category. Brinker Capital believes that this is an appropriate proxy for fund performance given that our
investment approach allocates assets to various classes similar to those represented by the Morningstar Categories, and the use of Category
average returns has neither a positive or negative bias regarding our selection of funds within a Category. If the funds had been in operation
during the entire period, their returns may have been higher or lower than the Category average returns.
Benchmarks: Brinker Capital constructs the benchmark to match, to the best of its ability, the components of the recommended
Investment Strategy to the appropriate indices so as to reasonably parallel the asset allocation of the Investment Strategy. However, the
benchmarks are not intended to parallel the risk or investment style of any particular manager or mutual fund included in the recommended
Investment Strategy or reflect guidelines, restrictions, correlations, concentrations, sector allocations or volatility of the portfolio of any such
manager or mutual fund. The benchmarks are provided for comparative purposes only and do not represent actual performance. Figures for
the indices reflect the reinvestment of dividends but do not reflect any management fees, transaction costs or expenses, which would reduce
returns. Indices are unmanaged and an investor cannot invest directly in an index.
The Relative Return Blended Benchmark for Sample Client Trust dated 1/1/2018, John Sample IRA and Jane Sample IRA consists of 85.37%
Moderately Conservative Taxable Blend (24% Russell 3000 Index/10% MSCI All Country World ex USA Index/51% ICE BofAML Municipal
Securities (1-10 Y) Index/13% HFRX Global Hedge Fund Index/2% ICE BofAML 3 Month Treasury Bill Index)/ 14.63% Moderately Conservative
Qualified Blend (23% Russell 3000 Index/10% MSCI All Country World ex USA Index/48% Bloomberg Barclays US Aggregate Bond Index/17%
HFRX Global Hedge Fund Index/2% ICE BofAML 3 Month Treasury Bill Index).
Fees: The performance information does not reflect the deduction of advisory fees payable to Brinker Capital and any other expenses for
services not covered by the advisory fee that an investor may incur, which will reduce a client’s return. Brinker Capital charges one
comprehensive fee for investment management services, which includes manager and fund due diligence, asset allocation, manager fees,
custody fees and trading expenses and Solicitor fees. Brinker Capital’s fee does not include the internal management fees and operating
expenses of mutual funds in which a client’s account is invested, which are reflected in the performance information contained herein.
Brinker Capital’s fees are disclosed in Part II of its Form ADV. The net effect of the deduction of Brinker Capital’s fees on annualized
performance, including the compounded effect over time, is determined by the relative size of the fee and the account’s investment
performance. The chart below depicts the effect of a 1% management fee on the growth of one dollar over a 10-year period at 10% (9% after
fees) and 5% (4% after fees) assumed rates of return. Looked at another way, $10,000.00 invested at 10% for ten years would grow to
$25,937.42; at 9% it would grow to $23,673.64.
Year 1 2 3 4 5 6 7 8 9 10
10% 1.10 1.21 1.33 1.46 1.61 1.77 1.95 2.14 2.36 2.59
9% 1.09 1.19 1.30 1.41 1.54 1.68 1.83 1.99 2.17 2.37
5% 1.05 1.10 1.16 1.22 1.28 1.34 1.41 1.48 1.55 1.63
4% 1.04 1.08 1.12 1.17 1.22 1.27 1.32 1.37 1.42 1.48
Proposal 287327 Brinker Capital Inc., a registered investment advisor 25
This presentation is intended for one-on-one presentations with a financial advisor present4% 1.04 1.08 1.12 1.17 1.22 1.27 1.32 1.37 1.42 1.48
e
pl
m
Sa
Proposal 287327 Brinker Capital Inc., a registered investment advisor 26
This presentation is intended for one-on-one presentations with a financial advisor presentDisclosure and Glossary of Terms
60/40: Portfolio composed of 60% Russell 3000 Index and 40% Bloomberg Barclays US Aggregate Bond Index.
Absolute Return: The total return that an asset achieves over a certain period of time. Absolute return differs from relative return because it
is concerned with the return of a particular asset and does not compare it to any other measure or benchmark.
Absolute Return Strategies: Strategies that seek to generate positive absolute return regardless of the direction of financial markets.
All Cap: Investing in equity securities without regard to whether a company is characterized as small, medium or large.
Annualized Return: The gain or loss of a portfolio or index over the period of one year.
Annualized Excess Return: The annualized excess return is the return in excess of a market measure (such as an index fund) over the
period of one year.
Asset Allocation: The process of deciding how to apportion investment capital between the various possible asset classes.
Asset Class: Category of assets such as equities and fixed income, and their subcategories, including large cap, small cap, commodities, etc.
Average Return Up: The average return during an up period.
Average Return Down: The average return during a down period.
Bank of America Merrill Lynch: Source: Merrill Lynch, Pierce, Fenner & Smith Incorporated (“BofAML”), used with permission. BofAML
permits the use of the BofAML Indices and related data on an “as is” basis, makes no warranties regarding same, does not guarantee the
suitability, quality, accuracy, timeliness, and/or completeness of the BofAML Indices or any data included in, related to, or derived therefrom,
assumes no liability in connection with the use of the foregoing, and does not sponsor, endorse, or recommend Brinker Capital, Inc., or any
of its products or services.
Best 1 Year: The highest return generated over a one year period.
Beta vs. Blended Benchmark: Beta represents the systematic risk of a portfolio and measures its sensitivity to a benchmark. A portfolio with
e
a beta of one is considered as risky as the benchmark and would therefore provide expected returns equal to those of the market during
both up and down periods. A portfolio with a beta of two would move (both up and down) approximately twice as much as the benchmark.
Blended Benchmark: The rate of return produced by specific market indices representing the asset classes contained in your
Recommended Investment Strategy. pl
Bloomberg Barclays: Source: Bloomberg Index Services Limited. BLOOMBERG® is a trademark and service mark of Bloomberg Finance L.P.
and its affiliated (collectively “Bloomberg”). BARCLAYS® is a trademark and service mark of Barclays Bank Plc (collectively with its affiliates,
“Barclays”), used under license. Bloomberg or Bloomberg’s licensors, including Barclays, own all proprietary rights in the Bloomberg Barclays
Indices. Neither Bloomberg nor Barclays approves or endorses this material or guarantees the accuracy or completeness of any information
herein, or makes any warranty, express or implied, as to the results to be obtained therefrom and to the maximum extent allowed by law,
neither shall have any liability or responsibility for injury or damages arising in connection therewith.
m
Bloomberg Barclays Emerging Markets USD Aggregate Index: An index that covers the US dollar-denominated long-term tax-exempt
bond market.
Bloomberg Barclays US Aggregate Bond Index: A broad-based benchmark that measures the investment grade, US dollar-denominated,
fixed-rate taxable bond market.
Bloomberg Barclays US High Yield Index: An index that measures the US dollar-denominated, below investment grade, fixed-rate
Sa
corporate bond market.
Bloomberg Barclays US Municipal Bond Index: An index that covers the US dollar-denominated long-term tax-exempt bond market.
Bloomberg Commodity Index: An index made up of 22 exchange-traded futures on physical commodities. The index currently represents
20 commodities, which are weighted to account for economic significance and market liquidity. Weighting restrictions on individual
commodities and commodity groups promote diversification.
BofA Merrill Lynch US All Capital Securities Index: Index that includes all fixed-to-floating rate, perpetual callable and callable securities.
Closed-End Funds: A pooled investment fund that raises a fixed amount of capital through an initial public offering and is listed and traded
on a stock exchange.
Commodities: Basic raw materials and foodstuffs such as metals, petroleum, plantation crops, "softs," such as coffee and sugar, and grains
and agriculture.
Cumulative Return: The compound return over a set period.
Developed Markets: Countries that are most developed in terms of its economy and capital markets.
Dividend Growth: Strategies with an emphasis on companies that increase the growth rate of their dividend payment.
Down Capture: A measure of how badly a manager was affected by phases of negative benchmark returns.
Due Diligence: The performance of those actions that are generally regarded as prudent, responsible and necessary to conduct a thorough
and objective investigation, review and/or analysis.
Duration (Short/Intermediate/Long): Duration is the measure of a fixed income security’s sensitivity to interest rate changes.
Emerging Markets: Emerging markets generally do not have the level of market efficiency and strict standards in accounting and securities
regulation to be on par with developed economies, but emerging markets will typically have a physical financial infrastructure including
banks, a stock exchange and a unified currency.
Emerging Market Debt: Term used to encompass bonds issued by countries and companies in emerging markets.
Proposal 287327 Brinker Capital Inc., a registered investment advisor 27
This presentation is intended for one-on-one presentations with a financial advisor presentDisclosure and Glossary of Terms
Event Driven: Seeks to exploit pricing inefficiencies that may occur before or after a corporate event, such as an earnings call, bankruptcy,
merger, acquisition or spinoff.
Expense Ratio: A measure of what it costs an investment company to operate a mutual fund. An expense ratio is determined through an
annual calculation, where a fund's operating expenses are divided by the average dollar value of its assets under management.
Frontier Markets: Countries that are less established than those in the emerging and developed markets.
FTSE/EPRA NAREIT Developed Index: An index designed to track the performance of listed real estate companies and REITS worldwide.
Global Macro: A strategy that bases its holdings, such as long and short positions in various equity, fixed income, currency, and futures
markets, primarily on overall economic and political views of various countries' macroeconomic principles
Growth Stocks: Stocks of companies that exhibit growth characteristics and have shown an ability to grow at a faster rate than other firms.
HFRX Global Hedge Fund Index (USD): An asset weighted index comprised of all eligible hedge fund strategies, designed to be
representative of the overall composition of the hedge fund universe.
ICE BofAML US All Capital Securities Index: An index that is a subset of the ICE BofAML US Corporate Index that includes all fixed-to-
floating rate, perpetual callable, and capital securities.
High Dividend: Strategies that emphasize equities with above-market yields.
Information Ratio: The Information Ratio measures the excess return divided by the amount of risk the manager takes relative to the
benchmark (active risk or tracking error of the portfolio).
Intermediate Fixed Income: Focuses on the intermediate portion of the yield curve (1-10 years).
International Equities: Strategies that target either developed economies (e.g. Western Europe, Japan, Australia, Canada) or emerging
economies (e.g. China, Latin America, Eastern Europe).
e
Investment Grade Corporates: A debt security issued by a corporation and rated BBB-/Baa3 or higher by an established rating agency.
Large Cap: A company whose market cap typically exceeds $17 billion (using Russell Index methodology).
Long/Short Credit: Seeks to take exposure to credit-sensitive securities, long and/or short, based upon credit analysis of issuers and
securities, and credit market views.
pl
Long/Short Equity: Strategies that seek to profit from stock gains in long positions and price declines in short positions.
Managed Futures: These funds typically take long and short positions in futures options, swaps and foreign exchange contracts, both listed
and over-the-counter, based on market trends or momentum.
m
Manager Tenure: The length of time a portfolio manager has been responsible for managing the specific investment strategy.
Master Limited Partnership (MLP): An exchange-traded partnership that typically operates in the energy industry.
Maximum Drawdown: The maximum loss (compounded, not annualized) that the manager incurred during any sub-period. Drawdowns are
calculated on quarterly returns.
Merger Arbitrage: Exploits merger activity to capture the spread between current market values of securities and their values after
Sa
successful completion of a merger, restructuring or similar corporate transaction.
Micro Cap: A company whose market cap is typically between $30 million and $700 million (using Russell Index methodology).
Mid Cap: A company whose market cap is typically between $2 billion and $17 billion (using Russell Index methodology).
Mortgage-Backed Securities: An asset-backed security secured by a pool of mortgages.
MSCI - Source: MSCI. The MSCI information may only be used for your internal use, may not be reproduced or redisseminated in any form
and may not be used as a basis for a component of any financial instruments or products or indices. None of the MSCI information is
intended to constitute investment advice or a recommendation to make (or refrain from making) any kind of investment decision and may
not be relied on as such. Historical data and analysis should not be taken as an indication or guarantee of any future performance analysis,
forecast or prediction. The MSCI information is provided on an “as is” basis and the user of this information assumes the entire risk of any
use made of this information. MSCI, each of its affiliates and each other person involved in or related to compiling, computing or creating any
MSCI information (collectively, the “MSCI Parties”) expressly disclaims all warranties (including, without limitation, any warranties of
originality, accuracy, completeness, timeliness, non-infringement, merchantability and fitness for a particular purpose) with respect to this
information. Without limiting any of the foregoing, in no event shall any MSCI Party have any liability for any direct, indirect, special,
incidental, punitive, consequential (including, without limitation, lost profits) or any other damages. (www.msci.com).
MSCI All Country World Index ex USA: A market-capitalization-weighted index maintained by MSCI Inc. and designed to provide a broad
measure of stock performance throughout the world, with the exception of U.S.-based companies. The MSCI All Country World Index Ex-U.S.
includes both developed and emerging markets.
MSCI EAFE Index: An equity index which captures large and mid cap representation across Developed Markets countries around the world,
as defined by MSCI, excluding the US and Canada. With 927 constituents, the index covers approximately 85% of the free float-adjusted
market capitalization in each country.
MSCI Emerging Markets Index (MSCI Emg Mkts): An equity index which captures large and mid cap representation across 24 Emerging
Markets (EM) countries, as defined by MSCI. With 846 constituents, the index covers approximately 85% of the free float-adjusted market
capitalization in each country.
Municipal Bond: A debt security issued by a state or local municipality.
Natural Resources: Strategies that invest in equities of commodity-oriented companies.
Proposal 287327 Brinker Capital Inc., a registered investment advisor 28
This presentation is intended for one-on-one presentations with a financial advisor presentDisclosure and Glossary of Terms
Preferred Stock: A stock that entitles the holder to a fixed dividend, whose payment takes priority over common stock dividends.
Private Equity:: Composed of funds and investors that directly invest in private companies, or that engage in buyouts of public companies,
resulting in the delisting of public equity.
Real Assets: Real assets consist of ownership interests in investment vehicles that typically invest in physical assets and exhibit a high
correlation to inflation and provide high levels of current cash flow. Real assets include real estate, commodities, timber, and oil and gas
interests.
Real Estate Investment Trust (REIT): A type of security that invests in real estate through property or mortgages and trades on major
exchanges like a stock.
Relative Value: Attractiveness measured in terms of risk, liquidity and return of one instrument.
Return: The change in the value of a portfolio over an evaluation period, including any distributions made from the portfolio during that
period.
Russell: Source: London Stock Exchange Group plc and its group undertakings (collectively, the “LSE Group”). © LSE Group 2018. FTSE Russell
is a trading name of certain of the LSE Group companies. “Russell®” is a trade mark of the relevant LSE Group companies and is/are used by
any other LSE Group company under license. All rights in the FTSE Russell indexes or data vest in the relevant LSE Group company which
owns the index or the data. Neither LSE Group nor its licensors accept any liability for any errors or omissions in the indexes or data and no
party may rely on any indexes or data contained in this communication. No further distribution of data from the LSE Group is permitted
without the relevant LSE Group company’s express written consent. The LSE Group does not promote, sponsor or endorse the content of this
communication.
Russell 3000 Index: A market capitalization weighted index that seeks to be a benchmark of the entire U.S. stock market. This index
encompasses the 3,000 largest U.S.-based companies.
S&P 500 Index: A market capitalization weighted index consisting of 500 stocks chosen for market size, liquidity and industry grouping,
among other factors. The S&P 500 is designed to be a representation of large capitalization U.S. equities.
e
Sharpe Ratio: The Sharpe Ratio is a measure of reward per unit of risk. It is a portfolio's excess return over the risk-free rate divided by the
portfolio's standard deviation. The portfolio's excess return is its geometric mean return minus the geometric mean return of the risk-free
instrument (by default, T-bills). The lower the Sharpe Ratio, the less return per unit of total risk the manager has generated.
Small Cap: A company whose market cap is typically between $130 million and $3 billion (using Russell Index methodology).
volatility.
pl
Standard Deviation: A statistical measure of volatility indicates the "risk" associated with a return series. The lower the number the less
Tracking Error: Tracking error, also known as the "active risk" of the portfolio vs. benchmark, is the variability of the excess returns in
relation to the index. The tighter the tracking error (i.e., the lower the number), the less the variation of excess returns vs. the index. A lower
tracking error indicates more consistency of excess returns around the index.
m
Treasuries: Notes and bonds issued by the US government.
Treasury Inflation Protected Securities (TIPS): A treasury security that is indexed to CPI inflation.
Up Capture: A measure of how well a manager was able to replicate or improve on phases of positive benchmark returns.
US High Yield: Bonds issued by corporations that are rated below BBB or Baa3, by an established credit rating agency.
Sa
Worst 1 Year: The lowest return generated over a one year period.
# Quarters Up: The number of positive periods for a given return series.
# Quarters Down: The number of zero and negative returns for a given return series.
Proposal 287327 Brinker Capital Inc., a registered investment advisor 29
This presentation is intended for one-on-one presentations with a financial advisor presentYou can also read