The value of climate-resilient seeds for smallholder adaptation in sub-Saharan Africa - PIK
←
→
Page content transcription
If your browser does not render page correctly, please read the page content below

Climatic Change
https://doi.org/10.1007/s10584-020-02817-z

The value of climate-resilient seeds for smallholder
adaptation in sub-Saharan Africa

Oscar J. Cacho 1 & Jonathan Moss 1 & Philip K. Thornton 2 & Mario Herrero 3 &
Ben Henderson 3,4 & Benjamin L. Bodirsky 5 & Florian Humpenöder 5 & Alexander Popp 5 &
Leslie Lipper 6

Received: 19 January 2020 / Accepted: 4 August 2020/
# The Author(s) 2020

Abstract
Climate change is threatening food security in many tropical countries, where a large
proportion of food is produced by vulnerable smallholder farmers. Interventions are
available to offset many of the negative impacts of climate change on agriculture, and
they can be tailored to local conditions often through relative modest investments.
However, little quantitative information is available to guide investment or policy choices
at a time when countries and development agencies are under pressure to implement
policies that can help achieve Sustainable Development Goals while coping with climate
change. Among smallholder adaptation options, developing seeds resilient to current and
future climate shocks expected locally is one of the most important actions available now.
In this paper, we used national and local data to estimate the costs of climate change to
smallholder farmers in Malawi and Tanzania. We found that the benefits from adopting
resilient seeds ranged between 984 million and 2.1 billion USD during 2020–2050. Our
analysis demonstrates the benefits of establishing and maintaining a flexible national seed
sector with participation by communities in the breeding, delivery, and adoption cycle.

Keywords Climate change adaptation . Smallholders . Improved seeds . Climate policy

Acronyms
AEZ                   Agro-ecological zone
BDA                   Breeding delivery and adoption
CSA                   Climate-smart agriculture
FAO                   Food and Agriculture Organization of the United Nations

Electronic supplementary material The online version of this article (https://doi.org/10.1007/s10584-020-
02817-z) contains supplementary material, which is available to authorized users.

* Oscar J. Cacho
  ocacho@une.edu.au

Extended author information available on the last page of the article

Climatic Change

FAO                 EPIC Economics and Policy Innovations for Climate-Smart
                    Agriculture Programme of the Food and Agricultural
                    Organization of the United Nations
GCM                 Global circulation models (also global climate models) The 4 models
                    used are:
GFDL-ESM2M          Geophysical Fluid Dynamics Laboratory Earth System Model
HadGEM2-ES          Hadley Global Environment Model 2 Earth System
IPSL-CM5A           Institut Pierre Simon Laplace Earth System Model for the 5th
                    IPCC report
NorESM1-M           Norwegian Earth System Model
IPCC                Intergovernmental Panel on Climate Change
LPJmL               Lund-Potsdam-Jena managed Land model
MAgPIE              Model of Agricultural Production and its Impact on the Environment
RCP                 Representative concentration pathways
SDG                 Sustainable Development Goals
SSA                 Sub-Saharan Africa
SSP                 Shared socioeconomic pathways
TZNPS               Tanzania National Panel Survey

1 Introduction

By reducing agricultural production and incomes, increasing risks, and disrupting markets,
climate change poses a serious threat to the achievement of Sustainable Development Goal 2
(SDG 2), which aims to end hunger, achieve food security and improved nutrition, and promote
sustainable agriculture by 2030 (https://www.un.org/sustainabledevelopment/). SDG 2.3 has
the objective of doubling the agricultural productivity and incomes of small-scale food pro-
ducers by 2030, through secure and equal access to productive resources among other means.
SDG 2.4 calls for the implementation of resilient agricultural practices that increase productivity
and production. Climate change is already affecting crop and livestock production in many
parts of the world, posing serious challenges to achieving SDG2 (IPCC 2014). These effects can
be long lasting, as risk exposure and increased uncertainty affect investment incentives and
reduce the likelihood of effective farm innovations while increasing that of low return activities
(Hurley 2010; Dercon and Christiaensen 2011; Wossen et al. 2018). In the future, losses in
aggregate production are projected for wheat, rice, and maize especially in tropical regions for
2 °C of local warming, unless adaptation occurs to offset these losses (Challinor et al. 2014).
    Strategies that can enhance the resilience of agricultural systems are needed to reduce the
risk of food insecurity in the present as well as in the future (Lipper et al. 2014; Zhang et al.
2016; Smith and Frankenberger 2018). This is particularly true for climate hotspots: areas that
are characterized by both a “strong climate signal” and concentration of vulnerable populations
(De Souza et al. 2015). Smallholder agricultural producers in developing countries constitute
one of the most vulnerable groups to climate change, being exposed to strong climate signals
with limited capacity to adapt. The vulnerability of the agricultural sector in these countries to
climate change is recognized, being a dominant sector in adaptation initiatives, particularly in
semiarid areas (Mkonda and He 2018).
    From a policy standpoint, delivering smallholder adaptation strategies as packages may
improve their effectiveness. By addressing shortcomings along the value chain, we can ensure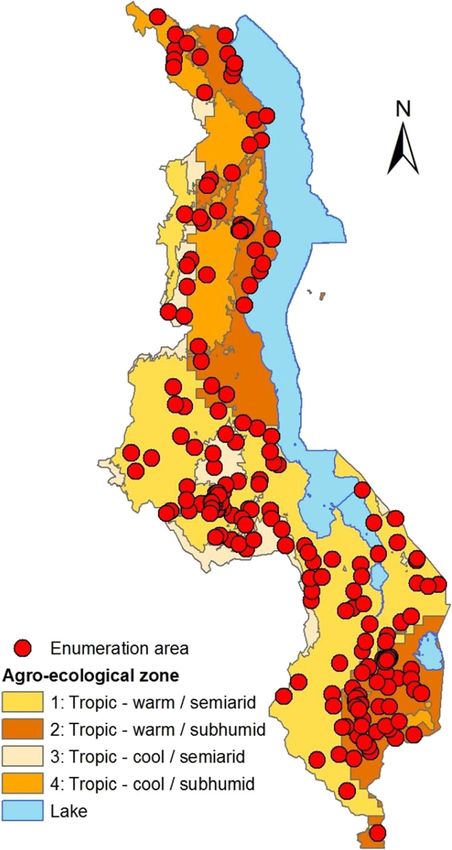
Climatic Change

that obstacles faced by farmers are reduced, thereby improving the chances of success. As well
as removing obstacles, policy packages may provide infrastructure and incentives that enable
farmers to adopt climate-smart technologies and access better markets. The policy goal is to
enable autonomous adaptation to occur as farmers respond to price signals, incentives, and
opportunities. Essentially, the approach helps vulnerable groups “help themselves” by devel-
oping resilience to climate shocks while also contributing toward Sustainable Development
Goals.
    Policy packages may involve investments such as irrigation infrastructure, improved crop
varieties, grain storage facilities, and transportation networks. Here, we focus on development
and delivery of climate-resilient seeds suited to local conditions. We justify this choice based
on demands by African countries for crops that are heat- and drought-resistant.
    Providing farmers with access to improved and adapted seeds is a fundamental and
proactive adaptation strategy widely applicable in climate hotspots. The use of improved seeds
in poor smallholder systems has been found to increase both productivity and incomes.
Between 1980 and 2010, the use of improved crop varieties in sub-Saharan Africa was
estimated to have increased productivity by an average of 47% and is known to have played
a significant role in reducing poverty in several sub-Saharan African countries (Walker and
Alwang 2015). There is considerable demand for this form of adaptation. The most common
adaptation action across the The nationally determined contribution (NDCs) in 18 East African
countries is the development and adoption of crop varieties that are better suited to future
climatic conditions (Burke et al. 2009). In relation to “crop management,” drought- and heat-
tolerant crop varieties feature prominently in planned adaptation measures in Africa (Richards
et al. 2016, Richards 2019). Depending on local context, different traits may be needed:
drought tolerance, heat tolerance, or faster biomass accumulation to offset shorter crop
durations as a result of higher temperatures (Atlin et al., 2017).
    Identifying strategies to increase the adaptive capacity of smallholder farmers in a way that
can enhance productivity and incomes is essential to meeting the objectives of SDG2 and
contributing to NDCs at the same time. Although there are other options, we focus on climate-
resilient seeds due to their prevalence in the NDCs of countries in sub-Saharan Africa. We do
not seek to compare this option with alternative investments such as irrigation.
    Smallholders in sub-Saharan Africa are already adapting to perceived climate changes by
adjusting planting dates and crop mixes (Ouédraogo et al. 2016), and such autonomous
adaptation may be complemented by planned adaptation to reduce the damage of climate
change and associated costs. However, a more proactive approach is needed if the targets of
SDG2 indicators are to be met. Historical adoption rates of “improved” technology in sub-
Saharan Africa have often been much lower than expected as smallholders face major barriers
to access, indicating the need for deliberate and targeted interventions. Increasing access
requires not only breeding climate-resilient seeds but also investments in seed production
and distribution, including seed bulking facilities, expanded extension services, and input
subsidies (Thornton et al. 2018). Targeted policies are needed to ensure that appropriate
interventions can be adopted in the time frame and scale needed. At present, breeding,
delivery, and adoption (BDA) of new crop varieties may take 30 years, and shortening this
cycle is a priority for adaptation (Challinor et al., 2016).
    There is limited quantitative information on the economic benefits and costs of adapting
seed resilient to current and future climate shocks. This study aims to address this paucity by
providing estimates on these costs and benefits to inform policy and guide investment to
increase food security. We take a novel approach by combining global projections on climate
Climatic Change
and agricultural productivity and production, provided by the Model of Agricultural Produc-
tion and its Impacts on the Environment (MAgPIE), with survey data at the farm level to
establish the potential costs of climate change to smallholders in two climate hotspot countries:
Malawi and Tanzania. We use farm household modelling to estimate the benefits of policy
measures intended to generate seed production and distribution capacity as well as provide
incentives to smallholders to adopt improved and adapted crop varieties at enhanced rates in
the near term. The nationally representative household data available for these two countries
allows us to derive national estimates while accounting for household-level constraints.
2 Modelling the cost of climate change to smallholders
Consider the case of a country divided into J agro-ecological zones (AEZ), which may differ in
terms of crop suitability, climate impacts, and other factors. Within each AEZ, there is a set of
Ij typical farm household types, which may differ in terms or their risk aversion, land use
pattern, human and financial capital, resources available (land, labor and other inputs), and
capability of adopting complex technologies.
The total farm revenue in agro-ecological zone j at time t under scenario S and policy P is
denoted as Rjt(S|P). The monetary effect of climate change on farmers in zone j is:
Gjt ðSjPÞ ¼ Rjt ðSjPÞ−Rjt ð0jPÞ ð1Þ
where the functional relationship (0|P) denotes the scenario with no climate change
for the given policy P. The sign of Gjt (S|P) indicates whether farmers in zone j are
expected to gain or lose from climate change in year t under scenario S given policy
P. The total effect of climate change over the planning horizon (0,...,T) at a discount
rate of δ is expressed as a present value:
T
GTj ðSjPÞ ¼ ∑ Gjt ðSjPÞ½1 þ δ−t ð2Þ
t¼0
The effect of any given policy k is quantified relative to the baseline policy for any climate
scenario as:
V j ðPk jS Þ ¼ GTt ðSjP ¼ Pk Þ−GTt ðSjP ¼ Pbase Þ ð3Þ
Policy analysis is undertaken by changing P to represent any given policy package and
comparing the resulting Vj with the cost of the policy. We simulate the case where
a program is introduced to produce improved seeds that are drought- and heat-
resistant as well as high yielding. This allows us to estimate the value of providing
improved seeds tailored to local conditions at different points in the planning horizon
for different climate scenarios.
The aggregate response represented in Eqs. (1) to (3) is the result of many individual
farmers making decisions on crops to grow and techniques to adopt as they experience
changing yields and prices in an autonomous adaptation process. This means we need a
behavioral model for farm households to create the link between farm-level decisions and
financial impacts at the AEZ level. Our approach is based on utility maximization by risk-
averse farmers subject to resource constraints and experiencing the effects of climate scenario
S and policy P. The link occurs through Rjt in Eq. (1) using an approach similar to that ofClimatic Change
Shively and Coxhead (2004). The total farm revenue at time t under scenario S and policy P
for the population of interest is:
Rjt ðSjPÞ ¼ ∑ rijt ðSjPÞ nijt ðSjPÞ ð4Þ
i
Rt ðSjPÞ ¼ ∑ ∑ rijt ðSjPÞ nijt ðSjPÞ ð5Þ
j i
Equations (4) and (5) represent farm revenues aggregated at the agro-ecological zone (AEZ)
and country level, respectively; rijt is the expected revenue of farm system i ∈ (1,...,I) in agro-
ecological zone j ∈ (1,...,J) in year t ∈ (1,...,T); and nijt is the expected number of farms of type i
in AEZ j.
The individual farm revenues that enter Eqs. (4) and (5) are those obtained by applying the
optimal crop mix w* for the given farming system:
0
rijt ðSjPÞ ¼ f t 0 ðSjPÞ w*ijt aijt ð6Þ
where w* is a vector of optimal crop proportions, f is a vector of revenues per hectare of crop,
and a is the area of the farm. The value of w* is obtained by solving the optimization problem:
1
max : U ijt ðSjPÞ ¼ f 0 ðSjPÞwijt − w0 ijt ½ri VðSjPÞwijt ð7Þ
w 2
Subject to:
Ai ðSjPÞwijt ≤bi ðSjPÞ ð8Þ
½10 wijt ¼ 1 ð9Þ
wijt ≥0 ð10Þ
where V is the variance-covariance matrix of crop revenues, r is the risk-aversion coefficient of
the farmer, A is a matrix of technical coefficients, and b is a vector of constraints. The solution
to this problem yields the optimal crop mix w* expressed as the proportion of farm area
planted to each crop. The matrix A contains technical coefficients related to the requirements
of each crop for land, labor, capital, and other resources.
Equation (7) implies that farmers make decisions based on expected prices and yields of
crops and their variability, both of which are affected by climate and policy scenarios. The
revenues per hectare of crop (f) are calculated as yield × price for each crop. For any particular
climate scenario, farmers react to changes in prices and yields by adjusting their crop mix to
maximize their utility, subject to constraints in available resources, knowledge, and ability.
The quadratic utility function for a risk-averse individual (Eq. (7)) is positively related to
expected returns and negatively related to variability of returns. The maximization is based on
revenues as a proxy for household welfare.
3 Data and methods
We consider four scenarios, S ∈ (0,...,3), representing no climate change (0) and three
representative concentration pathways (RCP), RCP 2.6, RCP 6.0, and RCP 8.5 (Moss et al.
2008), which can be characterised as optimistic, intermediate, and pessimistic respectively. WeClimatic Change
used SSP 2, the “middle of the road” shared socioeconomic pathway (Kriegler et al. 2014;
O’Neill et al. 2015) in all simulations. Rjt is calculated by aggregating the revenues of
individual farms (see Eqs. (4) and (5)). Farm households select their crop mix based on a
utility maximization process (Eqs. 7–10). In the behavioral model, risk-averse farmers select
the crop mix that maximizes their utility for the expected yields and prices under climate
scenario S.
The time horizon of the analysis is 30 years (2020–2050), in line with other studies on
impacts of climate change in agriculture. Projections of climate change to 2100 show an
accelerating trend, implying that more severe damages are expected after 2050. However, we
limited our analysis to 30 years, as this is the relevant horizon for policies aimed at strength-
ening the seed sector in developing countries. We used a discount rate of 5%, reflecting the
public good nature of the proposed policy (help vulnerable farmers adapt), for which the use
commercial discount rates is not appropriate.
We use two types of input data: nationally representative farm household survey datasets
and projections of crop prices and yields under alternative climate scenarios. Geo-referenced
survey data used consists of panels for Malawi (2281 households) and Tanzania (2213
households) with two waves of sampling (Figs. 1 and 2). For Malawi, farm household-level
data were from the nationally representative sample from the Third Integrated Household
Survey (IHS3) for 2010/2011 and 2013, implemented by the Malawi National Statistics
Office. For Tanzania, farm household-level data were from the nationally representative
sample from the 2008/2009 and 2010/2011 waves of the Tanzania National Panel Survey
(TZNPS). Both datasets were matched to historical measures of temperature and rainfall
variability by the FAO-EPIC team.
The crops available for selection in the optimisation model were based on those present in
the farm household survey datasets. The main crop cultivated in both countries was maize,
with 79% and 49% of households cultivating this crop in Malawi and Tanzania, respectively.
Maize was followed by legumes in both countries: 19% of households planted groundnut in
Malawi and 20% of households planted beans in Tanzania. There were variations in crop
proportions among agro-ecological zones (see Tables A4 and A5 in Supplementary Informa-
tion for more details).
Price and yield projections for 2010–2050 for the crops of interest were generated through
simulations under alternative representative concentration pathways (RCP) (Moss et al. 2008)
with no CO2 fertilization using the MAgPIE/LPJml model (Popp et al. 2017; Lotze-Campen
et al. 2008; Bondeau et al. 2007). MAgPIE results for yields and prices were obtained for 4
global circulation models (GCMs). The GCMs used were: (1) Geophysical Fluid Dynamics
Laboratory Earth System Model (GFDL-ESM2M); (2) Hadley Global Environment Model 2
Earth System (HadGEM2-ES); (3) Institut Pierre Simon Laplace Earth System Model for the
5th IPCC report (IPSL-CM5A); and (4) Norwegian Earth System Model (NorESM1-M).
The gridded data obtained from the MAgPIE/LPJml model were at a spatial resolution of 0.5°.
Each crop was simulated with and without irrigation for all global grid cells for all RCP-GCM
combinations. Yield values were extracted for the pixels corresponding to Malawi (1419 points) and
Tanzania (10,547 points). Price projections relative to 2010 were uniform for the whole African
region, and they were adjusted by AEZ based on price data from the country datasets prior to use in
our simulations. We used only non-irrigated yields in this analysis, as the study is based on dryland
systems, and options for investment in irrigation infrastructure were not considered.
The model described in Eqs. (1)–(10) was solved for the 4 climate scenarios and using
projections from the 4 GCMs listed above. We simulate a policy measure intended to generateClimatic Change Fig. 1 Agro-ecological zones and enumeration areas in Malawi. Data were geo-referenced farm household-level data from the nationally representative sample from the Third Integrated Household Survey (IHS3) for 2010/ 2011 and 2013 implemented by the Malawi National Statistics Office. This dataset was also matched to historical measures of temperature and rainfall variability by the FAO-EPIC team seed breeding, production, and distribution capacity as well as provide incentives to small- holders to adopt improved and adapted seeds at enhanced rates. This policy is compared against a baseline where no such incentives exist to obtain a measure of the value of the policy from the standpoint of improving the welfare of vulnerable smallholder farmers experiencing the effects of climate change. Parameters for the household model were obtained from the country survey data. Four different farm types were identified for each AEZ depending on two variables: (1) whether they apply climate
Climatic Change

Fig. 2 Agro-ecological zones and enumeration areas in Tanzania. Data were geo-referenced farm household-
level data from the nationally-representative sample from the 2008/2009 and 2010/2011 waves of the Tanzania
National Panel Survey (TZNPS). This dataset was also matched to historical measures of temperature and rainfall
variability by the FAO-EPIC team

smart agriculture (CSA) farming or conventional methods and (2) whether their resilience is at the
low or high end within the sample. Farmers at the low resilience end of the spectrum tend to be more
risk averse. The risk aversion coefficient (r) for each farmer type was obtained numerically using Eq.
(7) to find the value of r that results in a crop mix similar to the average for the group.

4 Results

4.1 Yield projections

Crop yields are expected to be below the no climate change reference scenario by 2050 for most
crops, with average yields as low as 0.83 relative to 2010 (Table 1). However, there is substantial
geographical variation in the projections of different global climate models (GCMs), and yield
increases are expected to occur in some areas for maize, the main staple crop (Fig. 3). Similar maps
were produced for the main crops in each country (see Supplementary Information).
Climatic Change

Table 1 Relative yield projections in 2050 for the main crops grown by smallholders in Malawi and Tanzania,
expressed as the ratio of yields under each RCP to yields under the no climate change reference scenario, with no
CO2 fertilization (mean ± SD)

                               RCP*

Crop                           2.6                               6.0                               8.5

                               Malawi
Maize                          0.966 ± 0.085                     0.937 ± 0.090                     0.918 ± 0.097
Groundnut                      0.901 ± 0.082                     0.864 ± 0.094                     0.832 ± 0.102
Beans                          0.932 ± 0.022                     0.905 ± 0.024                     0.882 ± 0.014
Soybean                        0.903 ± 0.050                     0.868 ± 0.064                     0.825 ± 0.033
Rice                           0.914 ± 0.027                     0.877 ± 0.039                     0.846 ± 0.017
Tobacco                        0.966 ± 0.086                     0.938 ± 0.090                     0.919 ± 0.097
                               Tanzania
Maize                          0.929 ± 0.079                     0.916 ± 0.087                     0.880 ± 0.101
Beans                          0.924 ± 0.029                     0.911 ± 0.031                     0.877 ± 0.018
Cassava                        0.961 ± 0.091                     1.067 ± 0.148                     1.039 ± 0.146
Sorghum                        0.924 ± 0.030                     0.915 ± 0.035                     0.875 ± 0.022
Rice                           0.905 ± 0.036                     0.888 ± 0.047                     0.839 ± 0.027

Projections were generated using four GCMs and a grid of 5-arcmin pixels. The mix of crops differs between
countries based on the farm household datasets used in the analysis
*Representative concentration pathways (RCP) are used by the IPCC as the new standard to represent a range of
climate scenarios through time. The numbers (2.6, 6.0, and 8.5) refer to radiative forcing, with higher numbers
representing more severe warming (Moss et al. 2008)

4.2 Climate change impacts on smallholders

The financial impacts of climate change on smallholders were estimated as the difference in
cropping revenues between the no climate change case and each RCP scenario (Eq. (1)).
Results indicate that expected farm revenues beyond 2020 will be lower for both countries
under climate change compared with the no climate change case, despite farmers adjusting
their crop mix to respond to changing prices and yields (Table 2).
   The total costs of climate change to smallholders, in present-value terms, for the period
2020–2050 are $1.6 (± 1.3) billion and $8.1 (± 1.0) billion for Malawi and Tanzania, respec-
tively (Table 2). There is a wide range of uncertainty around these expected values, especially
for Malawi, reflecting differences in yield projections from the four GCMs combined with
spatial variation as shown in in Fig. 3.
   In annual terms, the costs of climate change to smallholders in Table 2 are equivalent to
$103 (± 79) million per year for Malawi and $520 (± 64) million per year for Tanzania. At the
farm level, these represent average annual income reductions of 7.7% and 5.1%, respectively,
and this is after autonomous adaptation to yield and price changes caused by climate change.
In short, without more concentrated adaptation actions, some of the poorest people on Earth
are likely to experience significant cuts in their incomes—and food security.

4.3 Evaluating climate-resilient seeds

Seeds that are drought- and heat-resistant can increase yields by up to 25% under climate
patterns expected in Africa by 2050 with RCP 8.5, compared with expected yields with current
seeds (Islam et al. 2016). We explore the potential benefits of farmers adopting these adapted
seeds under three different scenarios (Table 3). First, an optimistic scenario where these
Climatic Change
Climatic Change

R   Fig. 3 Maize yields projected in 2050 for three representative concentration pathways (RCP 2.6, RCP 6.0, and
    RCP 8.5) relative to the reference no climate change case in Malawi and Tanzania. Projections were obtained
    with four different global circulation models (NorESM1, IPSL, HadGEM2, and GFDL) with no CO2
    fertilization. The three RCP scenarios selected represent the range from optimistic (RCP 2.6) to pessimistic
    (RCP 8.5). Details of projected yields and prices of all crops considered are presented in the Supplementary
    Information. Blank pixels are water

    improved seeds are available for all main crops starting in 2020 results in aggregate benefits of
    $635 million in Malawi and $1470 million in Tanzania. Although this will not be achievable, it
    shows the potential benefits of early planning for climate change adaptation, focusing on the
    main crops in addition to maize. In a second scenario, we assumed that these improved seeds
    only become available in 2030. In this case, smaller but still significant benefits are obtained
    (at $524 million in Malawi and $1156 million in Tanzania). In the third scenario, we assumed
    that the availability of improved seeds starts only in 2040 (Table 3 final column). In this most
    pessimistic case, the benefits of policies to promote adoption of improved seeds have
    decreased to $315 million for Malawi and $669 million for Tanzania. In terms of annual
    benefits per hectare, there are variations among agro-ecological zones, with higher benefits
    generally accruing to warmer regions compared with cooler regions, but with some variation
    arising from geographical differences within agro-ecological zones.

    5 Discussion

    Uncertainty in climate projections means that climate-resilient seeds need to be readily available to
    farmers for a range of possible climate change outcomes rather than a single expected outcome. It
    follows that programs to propagate improved seeds adapted to local conditions, and the seed

    Table 2 Present value of the cost of climate change to smallholders in Malawi and Tanzania (mean ± SD)

    Country/AEZ*                                   Total cost +($ million)

    Malawi                                         1600 ± 1227
    Tanzania                                       8102 ± 1000
                                                    Cost by AEZ ($/ha)                          Total area (1,000 ha)
    Malawi
    Tropic–warm/semiarid                           765 ± 536                                    857
    Tropic–warm/subhumid                           786 ± 525                                    1,046
    Tropic–cool/semiarid                           460 ± 545                                    256
    Tropic–cool/subhumid                           35 ± 622                                     133
    Tanzania
    Tropic–warm/semiarid                           852 ± 73                                     703
    Tropic–warm/subhumid                           964 ± 88                                     4178
    Tropic–warm/humid                              1096 ± 156                                   140
    Tropic–cool/semiarid                           689 ± 101                                    647
    Tropic–cool/subhumid                           707 ± 125                                    3997
    Tropic–cool/humid                              1068 ± 160                                   45

    Based on projections for the period 2020–2050 under RCP8.5 using four GCMs. The top portion of the table
    presents total costs considering all smallholder farmers in each country. The bottom portion of the table presents
    results per hectare by agro-ecological zone (AEZ)*. Figures are in 2010 US Dollars at a discount rate of 5%.
    *Agro-ecological zones are as classified by IFPRI -Sebastian, K. (2015). Agro-ecological zones of Africa
    (Publication no. hdl/1902.1/22616) from Harvard Dataverse http://hdl.handle.net/1902.1/22616
    + These   costs were estimated from Eq. (2) as − ∑ GTj ðSjPÞ, with S = 4 and P = Pbase
                                                      j
Climatic Change
Table 3 Present value of benefits provided by adapted seeds (mean ± standard deviation) to cope with climate
change under RCP 8.5
Seed improvement assumption
Country/AEZ (2020–2050) (2030–2050) (2040–2050)
Total benefit of seeds to smallholders, PV ($ million)*
Malawi 635 ± 179 524 ± 134 315 ± 50
Tanzania 1470 ± 379 1156 ± 363 669 ± 183
Benefits by AEZ, annualized PV ($/ha/year)
Malawi
Tropic-warm/semiarid 16.5 ± 4.6 13.7 ± 3.4 8.2 ± 1.2
Tropic–warm/subhumid 19.1 ± 5.3 15.7 ± 4.0 9.4 ± 1.5
Tropic–cool/semiarid 3.8 ± 1.2 3.1 ± 1.0 1.9 ± 0.4
Tropic–cool/subhumid 1.4 ± 0.4 1.2 ± 0.3 0.7 ± 0.1
Tanzania
Tropic–warm/semiarid 11.1 ± 1.6 8.4 ± 2.2 4.9 ± 1.0
Tropic–warm/subhumid 45.5 ± 12.1 36.0 ± 10.6 20.5 ± 5.3
Tropic–warm/humid 1.9 ± 0.5 1.5 ± 0.5 0.8 ± 0.2
Tropic–cool/semiarid 6.6 ± 1.2 5.1 ± 1.6 3.1 ± 0.8
Tropic–cool/subhumid 28.6 ± 8.8 22.8 ± 8.5 13.4 ± 4.6
Tropic–cool/humid 0.5 ± 0.2 0.4 ± 0.2 0.2 ± 0.1
a. Based on the potential yield increase of drought + heat tolerance + high yield maize in Africa according to
Islam et al. (2016)
*These figures were obtained using Eq. (3) with differing policy assumptions and assuming 30 percent adoption,
based on Thornton and Herrero (2010)
Assumptions on the timing of improved seed availability differ between columns. The improved seeds are
assumed to reduce the yield gap by a maximum 25% relative the no climate change casea . The planning horizon
is 2020–2050 and values are in 2010 US dollars at a discount rate of 5%
production facilities needed to support them, will be important proactive adaptation strategies. It will
be necessary to have seed systems capable of producing a wider range of traits that can respond to
the multiple threats of climate change, and these systems need to be flexible and sensitive to local
conditions. This in turn implies the need for adaptation measures to increase the flexibility and scope
of local seed systems, including access to a diversity of cultivars. A focus of breeding for increased
diversity to provide cultivars that are more resilient in changing and uncertain conditions would be
an asset for the success of the proposed policy.
The cost of delays in these actions can be estimated by comparing the three columns of
Table 3. For the two countries, considered investment delays of 10 and 20 years, respectively,
cost 425 and 1221 million USD in present value of foregone benefits for 2020–2050 (Table 4).
Table 4 Cost of delaying investment in seeds adapted to cope with climate change under RCP 8.5 compared
with implementation in 2020
Cost by implementation year ($/ha)
Country 2030 2040
Malawi 111 ± 45 320 ± 129
Tanzania 314 ± 65 801 ± 219
Total 425 ± 101 1121 ± 348
Assumptions on delay in improved seed availability differs between columns and values are present value terms
(mean + standard deviation). Values in 2010 US Dollars at a discount rate of 5%Climatic Change
These differences can be viewed as the benefits of early action to justify investments that
enhance adoption of adapted varieties by vulnerable farmers. To make this happen, the whole
seed supply chain needs to be considered, starting from the breeding phase. In this regard, it is
important to have a diversity of cultivars available to breed for desirable traits.
The analysis focuses on the main crops present in the country datasets (Table 1), with maize
being the most prominent. The optimal solution at the farm level involves crop mixes that
maximize utility for risk-averse farmers. There are other promising crops for climate adapta-
tion in Africa that were not included in the analysis (such as cowpea and millet) because of
their absence in the datasets.
Maize will be hit hard by climate change in low latitudes (Mbow et al. 2019), and at the
same time, maize continues to be of critical importance in diets, with more than a 30%
contribution to the calories consumed by the population of sub-Saharan Africa. There is a
reluctance by farmers and consumers to shift to other staple crops. This is evidenced by the
adoption rates of modern maize varieties, about 50% in sub-Saharan Africa, which is quite
high compared with other crops (Ekpa et al. 2019). In our analysis, we express the costs of
climate change in terms of lost cropping revenues to smallholder farmers in the climate hotspot
countries of Malawi and Tanzania. We use these costs to estimate the expected impact of a
policy designed to enhance adoption rates of adapted seed varieties and find that there is an
immediate and significant benefit to such policies in reducing the negative impacts of climate
change for some of the world’s poorest and most food-insecure people. The analysis indicates
that accelerating the adoption of adapted crop varieties can be an effective means of achieving
the SDG2 objectives while explicitly accounting for the challenges posed by climate change. It
is important to recognize that although the adaptation strategy considered here is one that
countries already have considerable institutional capacity and experience in implementing,
they may lack financial resources to achieve the scale of implementation envisioned here.
The costs of producing seeds and making them available to farmers depend on a range of
factors, including the time required for seeds multiplication in sufficient quantities for mar-
keting and the time it takes to disseminate the new varieties and for farmers to adopt them
(Challinor et al. 2016). The mean times required for new varieties to complete national testing
and go to market were estimated at 4.9 years in Malawi and 4.2 years in Tanzania by Challinor
et al. (2016). The FAO Investment Assessment Project (FAO 2011) estimated the costs of
establishing decentralized seed production facilities at a global average of US$500,000 per
1,000 t of certified seed for cereal crops, pulses, and oilseeds. This estimate is based on the cost
of decentralized seed production facilities including buildings, equipment, early generation
seed production, and support to the national seed sector, with plant refurbishment and
equipment replacement assumed by 2025. Assuming an application rate of 25 kg of seed
per ha (based on data for maize in Tanzania), 1,000 t of seed would cover 40,000 ha, resulting
in an average cost of $12.50/ha/year for building and maintaining seed production facilities
and supporting the national seed sector. This rough estimate does not account for economies of
scale which may occur as the seed sector expands and local suppliers become established.
To establish the conditions under which the policy we consider here compares favorably
with alternative policies, we need to know two types of costs: the cost of strengthening the
national seed sector to enable rapid response in the BDA cycle for adapted seeds and the cost
of complementary policies required to enhance adoption rates to help meet SDG2. Obtaining
those costs will require more research work focusing on the seed sectors of the target countries.
Our analysis focusses on only one aspect of climate change adaptation—enhancing the
production and adoption of improved seeds adapted to changing climate conditions. Even withClimatic Change
our conservative assumptions regarding potential yield improvements, our results indicate that
the benefits to pursuing this strategy can be sizeable in some agro-ecological zones, but
obviously, we expect that a richer portfolio of complementary policies would lead to higher
benefits.
A major uncertainty is the magnitude of the CO2 fertilization effect for different plant
groups with Ciscar et al. (2018) finding that additional research is required to understand this
effect. In this study, we modelled only the case of no CO2 fertilization. This reflects the case of
low input cropping systems where little scope exists for crops to express CO2 yield benefits
because of other constraints to crop growth. Also, estimating the potential cost of inaction
under the worst scenario (RCP8.5 with no CO2 fertilization) provides a useful starting point for
evidence-based policy analysis using large household datasets. The probability of this scenario
coming to pass can be estimated separately and adjusted over time as international negotiations
and emission outcomes progress. This type of analysis can help countries plan to prevent the
worse-case outcomes.
Seeds that are heat- and drought-resistant and high yielding are a key tool for adaptation of
vulnerable farmers in sub-Saharan Africa (SSA) and ultimately for achieving SDG2. New
seeds represent relatively straightforward adaptation: farmers know the crops and varietal
changes generally present few challenges, provided there are no issues around acceptability
with respect to taste, color, or other plant attributes, for example (Thornton et al. 2018). The
time required to develop and disseminate these seeds depends on a number of factors, to do not
only with access to expertise, facilities, and appropriate germplasm (Challinor et al. 2016), but
also with the efficiency of supply chains and national-level requirements for testing and
approval. This means there is room for improvement in streamlining regulation, funding
capacity building, and forming integrated networks for seed production and testing. Systems
that integrate participatory breeding and dissemination have the potential to improve the
overall efficiency of the BDA process (Challinor et al. 2016). The right balance between
centralized and decentralized approaches needs to be found based on the specific situation of
each country.
6 Concluding comments
Evidence from previous studies indicates that for effective adaptation, an entire package of
complementary measures is needed. In the case of a policy to subsidize the dissemination and
use of improved seeds, farmers’ participation in the scheme is a necessary but not sufficient
condition for success. Once the improved seeds are produced, they should be distributed in
conjunction with complementary technologies, such as nutrient, water, and carbon manage-
ment packages appropriate to local conditions. This means not only improving the coverage
and quality of extension services but also supply chain capacity to provide inputs in a timely
manner. The costs of an integrated adaptation package will be higher than those of an
intervention into a single sector as presented here, but the benefits will also be higher.
Integrated adaptation strategies can also provide local employment and training opportunities,
allowing households to diversify their income sources or exit agriculture, thereby reducing
land fragmentation that can lead to farm sizes becoming unviable for maintaining livelihoods
from farming activities (Thornton and Herrero 2015; Rippke et al. 2016).
Using an integrated modelling approach, we have shown that investments in the seed sector
now can avoid some of the considerable costs that climate change is likely to impose on poorClimatic Change
and food-insecure farmers in sub-Saharan Africa and allow them to achieve the productivity
and income gains embodied in SDG 2.3.
There is significant overlap in the types of policies that are good for agricultural develop-
ment in general and those required for climate adaptation, but climate change brings urgency
to these actions and requires investments to focus on expected future conditions that differ
spatially and are subject to high uncertainty. Investing now in capacity to develop and apply
key technologies may take a decade or longer to bear fruit, hence the urgency to act now.
There is a need to apply similar analyses for broad sets of climate-smart practices, especially
now as countries are seeking to implement their NDCs. This kind of information can help them
to identify policy mixes that will provide the highest return on investment.
Authors’ contributions OJC designed the initial conceptual model. OJC, JM, PKT, MH, BH, and LL refined
the initial model and contributed to iterative analysis of results. OJC and JM undertook statistical analyses and
implemented the numerical model. BB, FH, and AP undertook yield modelling under climate change to obtain
the key inputs for the analysis. Everyone wrote the paper.
Funding information This work was funded by the Food and Agriculture Organization of the United Nations
(FAO). We are grateful to the EPIC team at FAO for providing data and support; Aslihan Aslan and Caterina
Sucameli provided clean datasets for Malawi and Tanzania. PKT acknowledges support provided to the CGIAR
Research Program on Climate Change, Agriculture and Food Security (CCAFS) from CGIAR Fund Donors, and
through bilateral funding agreements (please see ccafs.cgiar.org/donors). MH and BH acknowledge support from
the CSIRO Science Leaders Programme and the FACCE/JPI Belmont Forum funded DEVIL project (Delivering
Food Security on Limited Land).
Open Access This article is licensed under a Creative Commons Attribution 4.0 International License, which
permits use, sharing, adaptation, distribution and reproduction in any medium or format, as long as you give
appropriate credit to the original author(s) and the source, provide a link to the Creative Commons licence, and
indicate if changes were made. The images or other third party material in this article are included in the article's
Creative Commons licence, unless indicated otherwise in a credit line to the material. If material is not included
in the article's Creative Commons licence and your intended use is not permitted by statutory regulation or
exceeds the permitted use, you will need to obtain permission directly from the copyright holder. To view a copy
of this licence, visit http://creativecommons.org/licenses/by/4.0/.
References
Atlin GN, Cairns JE, Das B (2017) Rapid breeding and varietal replacement are critical to adaptation to
cropping systems in the developing world to climate change. Global Food Security 12:31–37
Bondeau A, Smith PC, Zaehle S, Schaphoff S, Lucht W, Cramer W et al (2007) Modelling the role of agriculture
for the 20th century global terrestrial carbon balance. Global Change Biology 13(3):679–706
Burke MB, Lobell DB, Guarino L (2009) Shifts in African crop climates by 2050, and the implications for crop
improvement and genetic resources conservation. Global Environmental Change 19(3):317–325
Challinor A, Watson J, Lobell D, Howden S, Smith D, Chhetri N (2014) A meta-analysis of crop yield under
climate change and adaptation. Nature Climate Change 4:287–291
Challinor, A. J., Koehler, A. K., Ramirez-Villegas, J., Whitfield, S., & Das, B. (2016). Current warming will
reduce yields unless maize breeding and seed systems adapt immediately. [Letter]. Nature Clim. Change,
advance online publication, doi:https://doi.org/10.1038/nclimate3061
Ciscar J, Fisher-Vanden K, Lobell DB (2018) Synthesis and review: an inter-method comparison of climate
change impacts on agriculture. Environmental Research Letters 13(7):1–7
De Souza K, Kituyi E, Harvey B, Leone M, Murali KS, Ford JD (2015) Vulnerability to climate change in three
hot spots in Africa and Asia: key issues for policy-relevant adaptation and resilience-building research.
[journal article]. Regional Environmental Change 15(5):747–753. https://doi.org/10.1007/s10113-015-0755-
8.Climatic Change
Dercon S, Christiaensen L (2011) Consumption risk, technology adoption and poverty traps: evidence from
Ethiopia. Journal of development economics 96(2):159–173
Ekpa O, Palacios-Rojas N, Kruseman G, Fogliano V, Linnemann AR (2019) Sub-Saharan African maize-based
foods-processing practices, challenges and opportunities. Food Reviews International 35(7):609–639
FAO (2011). Annex 1: Investment Methodological Framework. FAO Investment Assessment Project: Food and
Agriculture Organization (FAO) of the United Nations, Unpublished.
Hurley TA (2010) A review of agricultural production risk in the developing world. Harvest Choice Working
Paper 11. International Food Policy Research Institute, Washington, DC
IPCC (2014) Summary for policymakers. In: Field CB, Barros VR, Dokken DJ, Mach KJ, Mastrandrea MD,
Bilir TE et al (eds) Climate Change 2014: impacts, adaptation, and vulnerability. Part A: Global and
Sectoral Aspects. Contribution of Working Group II to the Fifth Assessment Report of the Intergovernmental
Panel on Climate Change. Cambridge University Press, Cambridge, pp 1–32
Islam S, Cenacchi N, Sulser TB, Gbegbelegbe S, Hareau G, Kleinwechter U et al (2016) Structural approaches to
modeling the impact of climate change and adaptation technologies on crop yields and food security. Global
Food Security 10:63–70. https://doi.org/10.1016/j.gfs.2016.08.003
Kriegler E, Edmonds J, Hallegatte S, Ebi KL, Kram T, Riahi K et al (2014) A new scenario framework for
climate change research: the concept of shared climate policy assumptions. Climatic Change 122(3):401–
414
Lipper L, Thornton P, Campbell BM, Baedeker T, Braimoh A, Bwalya M et al (2014) Climate-smart agriculture
for food security. [Perspective]. Nature Climate Change 4(12):1068–1072. https://doi.org/10.1038
/nclimate2437.
Lotze-Campen H, Müller C, Bondeau A, Rost S, Popp A, Lucht W (2008) Global food demand, productivity
growth, and the scarcity of land and water resources: a spatially explicit mathematical programming
approach. Agricultural Economics 39(3):325–338
Mbow, C., Rosenzweig, C., Barioni, L.G., Benton, T.G., Herrero, M., Krishnapillai, M., Liwenga, E., Pradhan,
P., Rivera-Ferre, M.G., Sapkota, T.B. and Tubiello, F.N. (2019). Food security. In Climate Change and
Land: an IPCC special report on climate change, desertification, land degradation, sustainable land man-
agement, food security and greenhouse gas fluxes in terrestrial ecosystems. IPCC.
Mkonda M, He X (2018) Vulnerability assessment of the livelihoods in Tanzania’s semi-arid agro-ecological
zone under climate change scenarios. Climate 6(2):1–27
Moss, R. H., Babiker, M., Brinkman, S., Calvo, E., Carter, T., Edmonds, J. A., et al. (2008). Towards new
scenarios for analysis of emissions, climate change, impacts, and response strategies. Pacific Northwest
National Laboratory (PNNL), Richland, WA (US).
O’Neill, B. C., Kriegler, E., Ebi, K. L., Kemp-Benedict, E., Riahi, K., Rothman, D. S., et al. (2015). The roads
ahead: narratives for shared socioeconomic pathways describing world futures in the 21st century. Glob
Environ Chang, doi: https://doi.org/10.1016/j.gloenvcha.2015.01.004.
Ouédraogo M, Zougmoré R, Moussa AS, Partey ST, Thornton PK, Kristjanson P et al (2016) Markets and
climate are driving rapid change in farming practices in Savannah West Africa. [journal article]. Regional
Environmental Change:1–13. https://doi.org/10.1007/s10113-016-1029-9.
Popp A, Calvin K, Fujimori S, Havlik P, Humpenöder F, Stehfest E et al (2017) Land use futures in the shared
socio-economic pathways. Global Environmental Change 42:331–345
Richards M. (2019). National plans to address adaptation and mitigation in agriculture: an analysis of nationally
determined contributions. CCAFS dataset. Wageningen, Netherlands: CGIAR Research Program on Climate
Change, Agriculture and Food Security (CCAFS).
Richards M, Bruun TB, Campbell B, Gregersen LE, Huyer S, Kuntze V, Madsen STN, Oldvig MB, Vasileiou I.
(2016). How countries plan to address agricultural adaptation and mitigation: an analysis of intended
nationally determined contributions. CCAFS dataset version 1.2. Copenhagen, Denmark: CGIAR
Research Program on Climate Change, Agriculture and Food Security (CCAFS).
Rippke U, Ramirez-Villegas J, Jarvis A, Vermeulen SJ, Parker L, Mer F et al (2016) Timescales of transforma-
tional climate change adaptation in sub-Saharan African agriculture. Nature Climate Change 6:605–609
Shively G, Coxhead I (2004) Conducting economic policy analysis at a landscape scale: examples from a
Philippine watershed. Agriculture, Ecosystems & Environment 104:159–170. https://doi.org/10.1016/j.
agee.2004.01.014.N
Smith L, Frankenberger TR (2018) Does resilience capcity reduce the negative impact of shocks on household
food security? Evidence from the 2014 floods in northern Bangladesh. World Development 102:358–376
Thornton PK, Herrero M (2010) Potential for reduced methane and carbon dioxide emissions from livestock and
pasture management in the tropics. Proceedings of the National Academy of Sciences 107(46):19667–19672
Thornton PK, Herrero M (2015) Adapting to climate change in the mixed crop and livestock farming systems in
sub-Saharan Africa. [Perspective]. Nature Climate Change 5(9):830–836. https://doi.org/10.1038
/nclimate2754.Climatic Change
Thornton PK, Rosenstock T, Förch W, Lamanna C, Bell P, Henderson B et al (2018) A qualitative evaluation of
CSA options in mixed crop-livestock systems in developing countries. In: Zilberman D, Lipper L, McCarthy
N, Asfaw S, Branca G (eds) Climate Smart Agriculture - Building Resilience to Climate Change. FAO -
Springer Nature, London, pp 385–423
Walker, T. S., and Alwang, J. (Eds.). (2015). Crop improvement, adoption and impact of improved varieties in
food crops in sub-Saharan Africa. CABI.
Wossen T, Berger T, Haile MG, Troost C (2018) Impacts of climate variability and food price volatility on
household income and food security of farm households in East and West Africa. Agricultural Systems 163:
7–15
Zhang W, Cao G, Li X, Zhang H, Wang C, Liu Q et al (2016) Closing yield gaps in China by empowering
smallholder farmers. Nature 537(7622):671–674
Publisher’s note Springer Nature remains neutral with regard to jurisdictional claims in published maps and
institutional affiliations.
Affiliations
Oscar J. Cacho 1 & Jonathan Moss 1 & Philip K. Thornton 2 & Mario Herrero 3 & Ben
Henderson 3,4 & Benjamin L. Bodirsky 5 & Florian Humpenöder 5 & Alexander Popp 5 &
Leslie Lipper 6
1
University of New England, Armidale, Australia
2
CGIAR Research Program on Climate Change, Agriculture and Food Security (CCAFS), International
Livestock Research Institute (ILRI), Nairobi, Kenya
3
Commonwealth Scientific and Industrial Research Organization (CSIRO), Brisbane, Australia
4
Organization of Economic Cooperation and Development, Paris, France
5
Potsdam Institute for Climate Impact Research (PIK), Potsdam, Germany
6
Independent Science and Partnership Council, CGIAR, Rome, ItalyYou can also read