The Thing Metabolome Repository family (XMRs): comparable untargeted metabolome databases for analyzing sample-specific unknown metabolites
←
→
Page content transcription
If your browser does not render page correctly, please read the page content below
D660–D677 Nucleic Acids Research, 2023, Vol. 51, Database issue                                                          Published online 24 November 2022
https://doi.org/10.1093/nar/gkac1058

The Thing Metabolome Repository family (XMRs):
comparable untargeted metabolome databases for
analyzing sample-specific unknown metabolites
Nozomu Sakurai 1,2,3,*,† , Shinichi Yamazaki4,† , Kunihiro Suda2 , Ai Hosoki1 ,
Nayumi Akimoto2 , Haruya Takahashi 5 , Daisuke Shibata2 and Yuichi Aoki4,6,*
1
  Bioinformation and DDBJ Center, National Institute of Genetics, 1111 Yata, Mishima, Shizuoka 411-8540, Japan,
2
  Kazusa DNA Research Institute, 2-6-7 Kazusa-kamatari, Kisarazu, Chiba 292-0818, Japan, 3 Sakura Scientific Co.

                                                                                                                                                              Downloaded from https://academic.oup.com/nar/article/51/D1/D660/6833247 by guest on 09 October 2023
Ltd., 35 Horinouchi, Odawara, Kanagawa 250-0853, Japan, 4 Tohoku Medical Megabank Organization, Tohoku
University, 2-1 Seiryo-machi, Aoba-ku, Sendai, Miyagi 980-8573, Japan, 5 Division of Food Science and
Biotechnology, Graduate School of Agriculture, Kyoto University, Gokasho, Uji, Kyoto 611-0011, Japan and
6
  Graduate School of Information Sciences, Tohoku University, 6-3-09 Aramaki-Aza-Aoba, Aoba-ku, Sendai, Miyagi
980-8679, Japan

Received August 10, 2022; Revised October 21, 2022; Editorial Decision October 24, 2022; Accepted October 25, 2022

ABSTRACT                                                                                 INTRODUCTION
The identification of unknown chemicals has                                              A major bottleneck in systems biology is the poor
emerged as a significant issue in untargeted                                             availability of complete datasets of chemical compounds
metabolome analysis owing to the limited avail-                                          (metabolome) present in the samples. Using high-sensitivity
ability of purified standards for identification;                                        and high-throughput mass spectrometry (MS) in an untar-
this is a major bottleneck for the accumulation                                          geted manner, several thousands of signals derived from the
                                                                                         chemicals are detected simultaneously from a sample. How-
of reusable metabolome data in systems biol-                                             ever, it is not possible to identify most of the chemicals be-
ogy. Public resources for discovering and pri-                                           cause of the limited availability of purified standard chem-
oritizing the unknowns that should be subject                                            icals required for the identification. To overcome this issue,
to practical identification, as well as further de-                                      bioinformatics methods for predicting chemical structures
tailed study of spending costs and the risks of                                          using the mass spectra of fragmented unknown molecules
misprediction, are lacking. As such a resource,                                          have been studied eagerly and a prediction accuracy of over
we released databases, Food-, Plant- and Thing-                                          70% has been observed in recent years (1,2). Furthermore,
Metabolome Repository (http://metabolites.in/foods,                                      an approach for structural elucidation based on the sim-
http://metabolites.in/plants, and http://metabolites.                                    ilarity of mass spectral features to those of known com-
in/things, referred to as XMRs) in which the sample-                                     pounds (molecular networking) has been provided by the
specific localization of unknowns detected by liquid                                     GNPS consortium (3). However, even when these predic-
                                                                                         tion results are available, there is still a lack of information
chromatography–mass spectrometry in a wide vari-
                                                                                         to help prioritize unknowns from the many candidates for
ety of samples can be examined, helping to discover                                      further detailed investigation and identification. To iden-
and prioritize the unknowns. A set of application pro-                                   tify a genuinely unknown chemical, the researcher will en-
gramming interfaces for the XMRs facilitates the use                                     counter high costs, for example for purification or organic
of metabolome data for large-scale analysis and data                                     synthesis and the direct determination of its chemical struc-
mining. Several applications of XMRs, including in-                                      ture, along with considerable risk for failed identification
tegrated metabolome and genome analyses, are pre-                                        owing to misprediction. A lack of resources for discovering
sented. Expanding the concept of XMRs will acceler-                                      and prioritizing unknowns for further detailed investiga-
ate the identification of unknowns and increase the                                      tions after their selection by statistical analysis has emerged
discovery of new knowledge.                                                              as a long-standing practical issue in untargeted metabolome
                                                                                         studies and is considered a bottleneck in systems biology.

* To
   whom correspondence should be addressed. Tel: +81 55 981 6895; Fax: +81 55 981 9448; Email: sakurai@nig.ac.jp; ns@sakura-kagaku.com
Correspondence may also be addressed to Yuichi Aoki. Tel: +81 22 274 6040; Fax: +81 22 274 6040; Email: yuichi.aoki.e3@tohoku.ac.jp
†
    The authors wish it to be known that, in their opinion, the first two authors should be regarded as Joint First Authors.


C The Author(s) 2022. Published by Oxford University Press on behalf of Nucleic Acids Research.
This is an Open Access article distributed under the terms of the Creative Commons Attribution License (http://creativecommons.org/licenses/by/4.0/), which
permits unrestricted reuse, distribution, and reproduction in any medium, provided the original work is properly cited.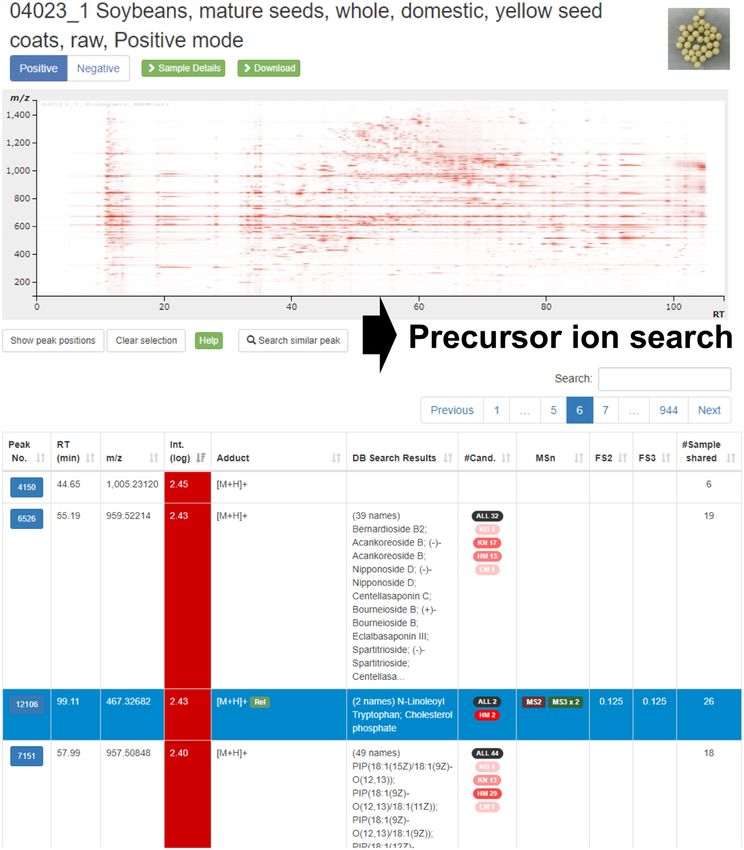
Nucleic Acids Research, 2023, Vol. 51, Database issue D661

   A potential way to discover and prioritize unknowns is         sample-specific localizations as evaluated by the precur-
to establish a public resource that provides sample-specific      sor ion mass, retention time, and MSn or MS/MS spec-
localization of the unknowns. Sample metadata such as tis-        tra. First, we released the Food Metabolome Repository
sue specificity and taxonomic relationships significantly im-     (FoodMR, http://metabolites.in/foods) in 2017, which con-
proves metabolite identification (4). A successful example        tained data from 136 food samples (14). Since then, we have
of the identification of unknowns based on sample speci-          expanded the sample variety for FoodMR up to 222 foods
ficity was biomarker discovery for specific cancer cells us-      and implemented several new functions, such as search
ing a database (BinBase) of gas chromatography (GC)–              functions based on the mass spectral similarity and neu-
MS-based metabolome data obtained from various sam-               tral loss. Furthermore, we developed another database for
ples (5). GC–MS, which is suitable for detecting volatiles        plants (Plant Metabolome Repository, PlantMR, http://
and primary metabolites, is advantageous for data compar-         metabolites.in/plants) and have been developing a database
ison by the reproducibility of the fragmentation based on         for anything (Thing Metabolome Repository, ThingMR,
electron ionization and the normalized retention time (re-        http://metabolites.in/things) (hereafter, we refer to the three

                                                                                                                                    Downloaded from https://academic.oup.com/nar/article/51/D1/D660/6833247 by guest on 09 October 2023
tention index). In liquid chromatography (LC)–MS-based            databases as XMRs). We used specific LC–MS instruments
metabolomics, which is suitable for detecting a wide vari-        and conditions to ensure the data comparison between ar-
ety of liquid-soluble unknowns such as plant-derived sec-         bitrary samples. Although the detected compounds are lim-
ondary metabolites, sample specificity can also be used to        ited by the particular methods applied, we can evaluate
discover unknowns. For example, Olivon et al. (6) discov-         the sample-specific localization of an unknown by the mass
ered seven bioactive natural compounds by combining in-           value of the precursor ion, retention time, and mass spec-
formation about taxonomy, bioactivity, and MS/MS spec-            tra of product ions. It is notable that the search, download,
tral similarity with in-house LC–MS data from 292 plant           and browsing functions of the XMRs are available as ap-
species in Euphorbiaceae. We also previously annotated            plication programming interfaces (APIs) to use the data
tomato metabolites by comparing untargeted LC–MS data             from the other computational programs. The untargeted
of tomatoes with those from Arabidopsis, Medicago trun-           metabolome data have now been used directly by bioinfor-
catula, and Jatropha curcas (7). However, a public resource       matics tools in systems biology. In this report, we briefly
for LC–MS-based untargeted metabolome data has not                introduce the statistics and principal functions of XMRs,
been established.                                                 presenting examples of their practical use and precautions,
   A major reason for the lack of public resources is the         and discuss the consequences of expanding the concept of
difficulty of comparing LC–MS data between different              XMRs.
studies in the public repositories. A considerable amount
of metabolome data obtained from various samples has              MATERIALS AND METHODS
been accumulated in public repositories; examples include
MetaboLights (8) and Metabolomics Workbench (9). How-             Untargeted metabolome analysis
ever, to the best of our knowledge, there is no report of         The details of the data acquisition and processing of un-
data mining of unknowns involving extensive use of the            targeted metabolome data deposited to XMRs are pro-
registered data across a wide range of samples. A major           vided in the Supplementary Methods. Briefly, a uniform
reason for this is the difficulty of data comparisons be-         metabolite extraction method and the two LC–MS plat-
tween different studies. It is even difficult to judge whether    forms for FoodMR/PlantMR and ThingMR, respectively
two given data are comparable by checking the analytical          (Table 1), were used for data acquisition. PowerGet-
methods (metadata) and actual accuracy/resolution of the          Batch software (https://www.kazusa.or.jp/komics/software/
detector when the data are measured. Searches based on            PowerGetBatch) (14,15) was used for peak detection, char-
mass spectra and precursor ion mass, such as those pro-           acterization, and alignment. The parameter setting files
vided by MASST (10), foodMASST (11), ReDU (12) and                of PowerGetBatch are available on the download page of
Metabolomics Workbench (9), are powerful tools for find-          XMRs.
ing samples that may contain the queried metabolite. How-
ever, the absence and thus sample-specific localization of the    Construction of the database system
queried metabolite cannot be examined using their datasets
consisting of mixed conditions. In the case of mass spectra,      The XMR system was developed using SpringBoot (Povital
controlling the dependence on the instruments and condi-          Software, Inc.) and MariaDB 5.5, and run on a Linux server
tions, mass spectral quality, and coverage of the metabolite      (RedHat EL 7.1). The details of the sample metadata were
peaks are still aspects to be resolved for comparison. One        registered in Metabolonote (http://metabolonote.kazusa.or.
approach to tackle this is to develop datasets obtained by        jp/) (16) under the accession IDs as follows: FoodMR,
a uniform condition. The dataset of ∼3600 foods from the          SE112-123, SE169-172; PlantMR, SE61, SE198-205; and
Global FoodOmics Project used in foodMASST would be a             ThingMR, SE221-226 (July 2022). The peak tables and raw
good example of mass spectral data (13). However, compa-          and mzXML-converted mass chromatogram data are avail-
rable datasets for precursor ion mass data, which would be        able on the download page of the XMRs.
more advantageous than mass spectra in terms of covering
the chemical space, are scarce (7).                               Statistics for ThingMR
   Here, we report a series of LC–MS-based untargeted             The peak table consists of the valid peaks detected in 535
metabolome databases as public resources for discover-            samples in ThingMR (March 2022) was constructed us-
ing and prioritizing unknown metabolites based on their           ing the alignment function of the PowerGetBatch software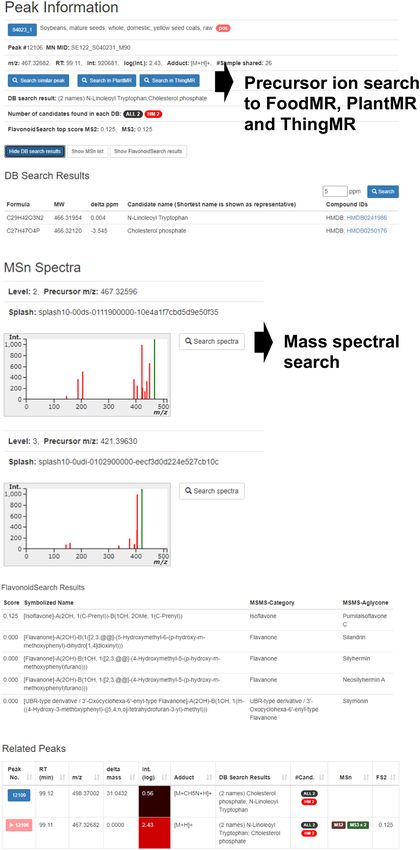
D662 Nucleic Acids Research, 2023, Vol. 51, Database issue

Table 1. General properties of XMRs
Database                                                      FoodMR                         PlantMR                    ThingMR
Samples targeted                                                foods                          plants                    anything
# samples                                                        222                             28                   734 (July 2022)
LC                                                                      Agilent 1100 (Agilent)                      Nexera2 (Shimadzu)
  Column                                                                     C18 (Tosoh)                             C18 (GL Science)
  Total elution time                                                           107 min                                    42 min
  Retention time drift *                                    ± ∼1% (1 min)                   ± ∼2% (2 min)            ± ∼1% (0.5 min)
MS                                                               LTQ-FT (Thermo Fisher Scientific)                   Compact (Bruker)
  MS/MS conditions                                                    MS2 , MS3 by Iontrap MS                       MS/MS by Q-ToF
  Mass accuracy (precursor ion analysis) *                                    ± 5 ppm                                    ±20 ppm
  Mass accuracy (product ion analysis) *                                      ± 0.5 Da                                   ±20 ppm

*Recommended given tolerances for peak search.

                                                                                                                                           Downloaded from https://academic.oup.com/nar/article/51/D1/D660/6833247 by guest on 09 October 2023
(14,15) run on the NIG supercomputer, and the results from                  Other methods
524 samples, excluding standard compounds, were used.
Each row of the peak table, namely, a set of aligned peaks                  The detailed method for datamining for novel
with the same or similar precursor m/z value and retention                  flavonoid candidates, statistics for MetagoLights, and
time in the sample(s), was referred to as a tentative unique                identification/annotation procedures for metabolites de-
peak (TUP). The TUPs per number of samples (Supple-                         scribed in the ‘Application of XMRs’ section are provided
mentary Figures S1 and S2) were calculated for every 25                     in the Supplementary Methods.
samples that were randomly selected from the 524 samples.
Ten replicates of the random selection were performed. The
peak share rate (PSR) of the TUPs and the average PSR                       RESULTS
(APSR) of the samples (Figure 1) were calculated as fol-
lows:                                                                       Development of XMRs
           Number o f the samples wher e the TU P was detected              We first established the Food Metabolome Repository
   PSR =                                                           (1)
                      Total number o f the samples                          (FoodMR, http://metabolites.in/foods) in 2017, with data
                                                                            from food items analyzed in an untargeted manner using
                                                                            reverse-phase LC coupled with high-resolution MS (Ta-
                  1
                                         Number o f TU Ps                   ble 1) (14). Foods were selected as the target samples be-
    APSR =                                                  PSRi   (2)      cause they contain a large variety of chemicals derived
           Number o f TU Ps                                                 from various biological sources and processing techniques,
                                               i =1
                                                                            such as mixing, cooking, and fermentation; therefore, the
   The peak table (alignment results) and parameter setting                 database could be helpful in research fields beyond food
files of PowerGetBatch were available from the download                     science. Since the initial report containing data from 136
page of ThingMR. The other statistics were calculated and                   foods (14), we have expanded the number of samples to
visualized using Microsoft Excel software (Microsoft Japan                  222. The details of the samples and analytical methods
Co., Ltd) with the support of in-house Java programs.                       (metadata) are hosted by Metabolonote (16) and there-
                                                                            fore searchable through MetabolomeXchange (http://www.
                                                                            metabolomexchange.org/).
                                                                               We used a uniform analytical method and a data analy-
Integrated metabolome and genome analysis
                                                                            sis procedure for all samples to ensure arbitrary data com-
The orthologous gene groups of 80 plant species with scaf-                  parison and then depict sample-specific localization of the
fold or chromosome-level genome assembly information                        unknowns. The identity or similarity of the peaks was exam-
obtained from NCBI or Ensembl (Supplemental Table S3)                       ined by the mass value and retention time at 5 ppm and 1%
were constructed using OrthoFinder version 2.3.12 with de-                  (∼1 min) tolerances, respectively. In addition, the similar-
fault parameters (17). Then, the gene presence/absence pro-                 ity of the peaks can be examined by their multi-stage mass
file (where species that retained a gene of interest in their               spectra (MS2 and MS3 ) obtained by data-dependent acqui-
genome were coded as 1, and species that did not have a gene                sition (DDA) using ion-trap MS if available.
of interest were coded as 0) was calculated for each ortholo-                  The FoodMR provides some additional information
gous gene group. Likewise, the metabolite presence/absence                  for peak annotation. The compound database search re-
profile (species with a TUP of interest were coded as 1, and                sults after searching by the measured mass values and
species without a TUP of interest were coded as 0) was cal-                 assigned adduct ions of the peaks were available. The
culated for 120 plant metabolome data (ESI-positive mode,                   following compound databases were used: KEGG (18),
Supplementary Table S4) in the aligned 535 samples. Then,                   KNApSAcK (19), HMDB (20), LIPID MAPS (21) and a
in order to discover the common phylogenetic distribution                   flavonoid database (http://metabolomics.jp/wiki/Category:
patterns between genes and metabolites, an all-to-all simi-                 FL). In addition, possible flavonoid aglycones estimated
larity comparison of the gene presence/absence profiles and                 by the FlavonoidSearch tool (https://www.kazusa.or.jp/
the metabolite presence/absence profiles was performed us-                  komics/software/FlavonoidSearch) (22) based on the MS2
ing in-house Python and R scripts.                                          and MS3 spectra were available. For further detailed anno-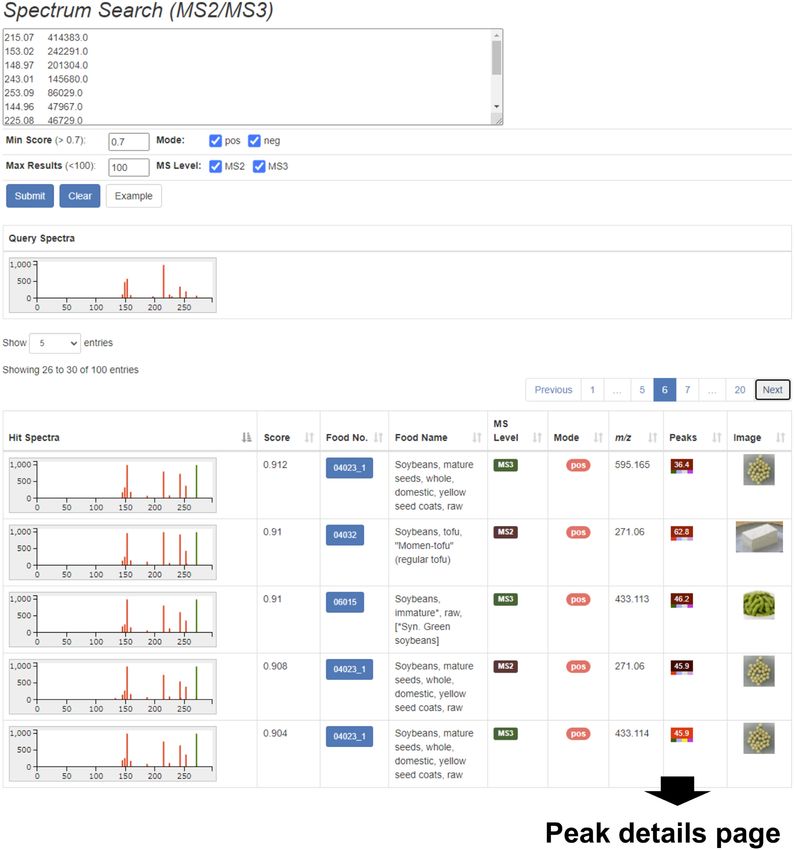
Nucleic Acids Research, 2023, Vol. 51, Database issue D663

                           A

                                                                                                                                                       Downloaded from https://academic.oup.com/nar/article/51/D1/D660/6833247 by guest on 09 October 2023
                           B

Figure 1. The distribution of averaged peak share rate (APSR) and number of peaks of the samples in FoodMR. The APSR is an index of the richness
of sample-specific peaks in the sample. A sample with a lower APSR contains a higher number of sample-specific peaks. (A) ESI-positive mode, and (B)
ESI-negative mode. The values were calculated using 524 samples published in ThingMR (March 2022), except for the standard chemicals.

tation of the peak, mass chromatogram data converted to                     plant-related samples, including model plants, Arabidop-
mzXML format are available. Using the software support-                     sis, rice, Lotus japonicas, tomato, cultured tobacco cells,
ing the mzXML format, such as MassChroViewer (https://                      Physcomitrella patents, Marchantia polymorpha, and poplar
www.kazusa.or.jp/komics/software/MassChroViewer) (14),                      are available. Some samples contain the predicted atom
users can analyze the data and annotate the unknown peaks                   numbers of nitrogen and sulfur in the chemical structure
in detail.                                                                  of the peaks estimated by the comparison with fully labeled
   We developed the PlantMR (http://metabolites.in/plants)                  plant samples using 15 N or 34 S. This information helps the
in 2020 for plant samples, including the inedible parts                     metabolite annotation.
of plants uncategorized in foods (Table 1). FoodMR and                         Since 2021, we have been developing the ThingMR
PlantMR are compatible as essentially the same procedures                   (http://metabolites.in/things), suitable for any samples,
are adopted, although the control of the retention time in                  because––as mentioned later––the compound annotation
PlantMR is not as strict as in FoodMR. Data from 28                         is improved synergistically by enlargement of sample va-
D664 Nucleic Acids Research, 2023, Vol. 51, Database issue
riety. Four bio-resource centers that joined the National
(97%)
(84%)
(7%)
Bio-Resource Project (NBRP, https://nbrp.jp/en/resource-
search-en/) in Japan provided 132 samples from basic
strains of model organisms (July 2022). We used another
36 56 502
35 33 782
30 60 639
Negative
2 39 035
LC–MS condition for constructing ThingMR because we
4982
could not add new data to FoodMR and PlantMR owing
-
-
-
-
734 (July 2022)
to discarding the LC–MS instrument used. Therefore, the
ThingMR
data in ThingMR are not fully compatible with those in
FoodMR and PlantMR (Table 1). Although the MS3 spec-
(91%)
(79%)
(16%)
(7%)
(1%)
tra are not available in ThingMR, the mass accuracy of the
MS/MS fragmentation is higher (Nucleic Acids Research, 2023, Vol. 51, Database issue D665
increase in unique peaks per addition of a new sample was Peak search by precursor ion mass value and retention time.
estimated in two ways. The first is based on the regression Users can search peaks detected in the samples based on
lines calculated with the data obtained from 400–524 sam- the precursor ions that match a given accurate mass value
ples (Supplementary Figure S1). The slopes of the regres- and a retention time of LC (Figure 4). The search result was
sion lines suggested that approximately 666 and 450 unique represented as a table in which the rectangle icons for the
peaks were included in a single sample in positive and nega- matched peaks are arranged in the columns corresponding
tive modes, respectively. The second is based on the distribu- to their nominal retention time. The peak icon shows the
tion of TUPs commonly detected in the samples. As shown peak intensity and retention time by the color and the num-
in Supplementary Figure S2, the distribution strongly fol- ber, respectively. This presentation of the results table helps
lowed the power laws. Therefore, using the number of TUPs users to grasp the sample specificity of the queried peak.
detected in only a single sample (326,396 for ESI-positive The small rectangles at the bottom of the peak icon show
and 221,996 for ESI-negative modes), we calculated the av- the other characteristics of the peak, namely the availabil-
erage TUPs per sample as 623 and 424 for ESI-positive and ity of MSn spectra, the availability of database search re-
Downloaded from https://academic.oup.com/nar/article/51/D1/D660/6833247 by guest on 09 October 2023
ESI-negative modes, respectively. These results were in good sults, the type of adduct ion assigned, and the Flavonoid-
agreement with the first estimation. Search score. These help users to check the appropriateness
of adduct ion assignment, obtain the MSn spectra when it
The uniqueness of the chemical profile of the sample. To lacks in the queried peak, and facilitate further annotation
represent the uniqueness of the chemical profile, we de- of the peak.
fined averaged peak share rate (APSR) of the samples. The In the case of the peaks registered in XMRs, users can
PSR, defined as the rate of samples where a TUP was de- directly perform the search using the peak information by
tected to the total sample number (524) was calculated for two procedures. One is selecting the row of the peak on the
each TUP. Then, the averaged value of the PSRs of the peak list of the sample and clicking the ‘Search similar peak’
TUPs detected in a sample was defined as APSR. There- button (Figure 2). The other is clicking the ‘Search similar
fore, the sample with a smaller APSR would have a larger peak’ button on the detailed peak information page (Figure
number of sample-specific peaks (Supplementary Table S1, 3). From the peak information page, users can search for
Figure 1). The samples with smaller APSRs included ani- similar peaks in the other XMR databases based on the m/z
mal samples (ragworms, urine of cat and dog, etc.), bacte- value and the approximated retention time (Figure 3).
ria (yeast), and environmental samples (water from a paddy More generally, as described below, in the case of the
field, etc.). These are in the less frequently analyzed sam- peaks measured by other LC–high resolution MS platforms
ple category in ThingMR. The samples in ThingMR had or compounds of known formula, the users can obtain the
various APSRs and peak numbers (Figure 1, Supplemen- potential counterparts in XMRs by not specifying the re-
tary Table S1). Rosemary (Lamiaceae) and Inuyomogi and tention time in the search. The results show the candidate
Ryuno-giku (Asteraceae) had a large number of peaks and isomers and their sample specificity. The number of possi-
smaller APSRs, although many samples in these families ble isomers and differences in their MSn spectra will also
are included in ThingMR. These species may biosynthe- help the prioritization and structural annotation of the un-
size many species-specific chemicals. When the distribution known peak. Furthermore, users can identify the counter-
was viewed by categories, the plants were scattered widely. part peak in XMRs if similar LC–MS conditions were ap-
Foods contained a lower number of peaks and higher AP- plied in the user’s platform by following these steps: ana-
SRs. This suggests that most of the chemicals we eat in foods lyzing the same or similar sample using the user’s platform;
are ubiquitous. The distribution shown in Figure 1 will identifying the commonly detected peaks in the platform
change in future, as the number of samples increases. The and XMR; and calculating the equations to convert the re-
samples in the category with lower APSRs should be ac- tention time from one to the other based on, for example,
tively analyzed to efficiently enhance the coverage of chem- the regression curve for the retention times of commonly
icals. detected peaks. As an example, we present the construction
of a converter for the LC–MS systems used in a study in
MetaboLights (MTBLS771) (24) (Supplementary Data 1).
We have also provided an MS Excel file for the conversion
Functions of XMRs
between ThingMR and FoodMR/PlantMR on the down-
This section briefly introduces the major functions of load page. Therefore, we can generally use the peak infor-
XMRs for obtaining insight into sample-specific localiza- mation in XMRs as a reference for annotating unknown
tions of the metabolites peaks, namely, search functions peaks detected by a wide range of LC–MS instruments.
and APIs. XMRs also provide essential functions as web- The following given tolerances for mass value and re-
based databases, such as browsing peak lists (Figure 2) tention time are recommended for searching: mass value,
and peak details (Figure 3) and downloading the raw and 5 ppm (FoodMR and PlantMR) and 20 ppm (ThingMR);
processed data files. In addition, the mass chromatogram and retention time, 1 min (FoodMR), 2 min (PlantMR) and
data, presented in two-dimensional images, are available in 0.5 min (ThingMR) (Table 1). The actual mass accuracy of
Microsoft PowerPoint files named ‘MassChroBook.’ The FT-ICR MS used in the FoodMR and PlantMR is less than
two-dimensional pictures help to present intuitively the 2 ppm in most cases. However, some peaks with higher in-
similarity/difference in the metabolic profiles that may be tensity showed mass drift up to 5 ppm. Therefore, we rec-
missed out by statistical methods such as multivariate anal- ommend giving 5 ppm mass tolerances for arbitrary peak
ysis. comparisons for FoodMR and PlantMR. The actual massD666 Nucleic Acids Research, 2023, Vol. 51, Database issue
Downloaded from https://academic.oup.com/nar/article/51/D1/D660/6833247 by guest on 09 October 2023
Figure 2. The peak list page of a sample in FoodMR. An example of the data obtained from soybean (Food ID: 04023 1) in ESI-positive mode is shown.
The button with a peak ID at the left of the table row links to the detailed peak page (Figure 3). The ‘Search similar peak’ button performs the precursor
ion search (Figure 4) using the m/z and retention time of the selected peak (the row highlighted in blue). The number in the ‘#Sample shared’ column
represents the number of samples detected by the similar peak search with 5 ppm and 1 min tolerance for m/z value and retention time, respectively. Similar
to the APSR in Figure 1, the number represents a sample specificity measure of the peak and facilitates searching sample (group)-specific peaks.
accuracy of Q-ToF used in the ThingMR is below 5 ppm ined using the search functions based on the mass spectral
in most cases. However, in some cases, such as peaks with similarity (Figure 5). Because DDA is applied for MSn or
lower intensity, the accuracy is not within 15 ppm. There- MS/MS analysis in XMRs, fragmentation data are avail-
fore, we recommend allowing 20 ppm for ThingMR. The able for only a proportion of the peaks. Nevertheless, we
reproducibility of the retention time is usuallyNucleic Acids Research, 2023, Vol. 51, Database issue D667
Downloaded from https://academic.oup.com/nar/article/51/D1/D660/6833247 by guest on 09 October 2023
Figure 3. The detailed peak information page of FoodMR. The example of the peak ID 12106 detected in soybean (Food ID: 04023 1) in ESI-positive
mode is shown. The buttons ‘Search similar peak’ and ‘Search in PlantMR’ buttons perform the precursor ion search (Figure 4) using the m/z value and
retention time of the peak to FoodMR and PlantMR, respectively. The button ‘Search in ThingMR’ performs a similar peak search to ThingMR using
the m/z value and approximate retention time. The ‘Search spectra’ buttons at the right of the mass spectral image perform a mass spectral search (Figure
5) using the spectra. The predicted flavonoid aglycones based on the spectrum and related peaks, such as different adduct ions, are also available.D668 Nucleic Acids Research, 2023, Vol. 51, Database issue
Downloaded from https://academic.oup.com/nar/article/51/D1/D660/6833247 by guest on 09 October 2023
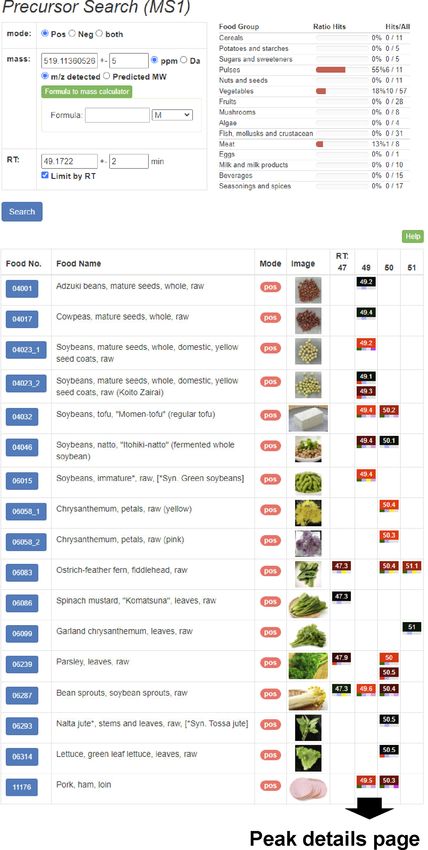
Figure 4. The precursor ion search function of FoodMR. The example of the results matching a peak detected with ESI-positive mode in soybean (m/z
519.1136, retention time 49.17 min) with given mass and retention time tolerances of 5 ppm and 2 min, respectively, is shown. The ratios of samples that
contained the matched peaks per the samples in the category (food group) are summarized in the top-right. In the results table on the bottom, the matched
peaks represented as peak icons (colored rectangles) are aligned by their nominal retention time. The peak icon summarizes the retention time, peak
intensity, presence of MSn spectral data, compound database search results, adduct ions, and FlavonoidSearch results. Details of the icons are available on
the help page of FoodMR (http://metabolites.in/foods/about/help). The peak icon links to the details of the peak information (Figure 3).Nucleic Acids Research, 2023, Vol. 51, Database issue D669
Downloaded from https://academic.oup.com/nar/article/51/D1/D660/6833247 by guest on 09 October 2023
Figure 5. The mass spectra search function of FoodMR. The example of results obtained with one of MS3 spectra (precursor m/z 271.1) of a soybean
peak (Food ID: 04023 1, Peak ID: 5065) detected in ESI-positive mode is shown. The queried mass spectrum and the mass spectra of matched peaks are
represented by images (bar graphs). Both MS2 and MS3 match in this example. The peak icon links to the peak details page (Figure 3).
The search results are provided along with images spectra in the results table (Figure 5). In the calculation of
of mass spectra to allow intuitive judgment of the the similarity score, the mass spectral data were rounded to
identity/similarity of the spectra (Figure 5). The mass spec- nominal mass values. The rounding was adopted because
tral similarity is estimated by the cosine product correla- of the low mass accuracy of ion-trap MS (D670 Nucleic Acids Research, 2023, Vol. 51, Database issue
ety of samples. We can search for candidates of compound species-specificity; among them, four orthogroups were in-
derivatives that display the same fragmentation in MS3 as in dole glucosinolate O-methyltransferases. The results sug-
the MS2 spectrum of the compound. This helps, for exam- gest that this metabolome–genome integrated analysis fa-
ple, achieve a comprehensive search for potential glycosides cilitated the discovery of reasonable metabolite and gene
of a known or unknown aglycone. pairs in species-specific metabolic pathways. Using the same
As a precaution for general use, please note that the com- approach, we found a pair of putative isomers of cucur-
patibility of the mass spectra between platforms should be bitacin S (m/z 481.29 in positive mode, RT 22.0 and 18.44)
considered for a proper understanding of the search results. and an ortholog cytochrome P450 89A2 that were de-
The mass spectrum of a compound obtained by linear-ion- tected in Cucurbitaceae species, Citrullus lanatus, Cucumis
trap MS in FoodMR and PlantMR differs from that ob- melo and Cucumis sativus, but not in other plants. The
tained by Q-Tof MS in ThingMR. Similarly, the spectra detailed metabolic pathway for the biosynthesis of cucur-
in XMRs differ from the users’ own data. Therefore, when bitacin S and the specific substrate of the cytochrome P450
the cross-sample distribution of the peaks that have simi- 89A2 are not fully understood. Therefore, the results pro-
Downloaded from https://academic.oup.com/nar/article/51/D1/D660/6833247 by guest on 09 October 2023
lar mass spectra is evaluated, users should seek a counter- vide a new working hypothesis for further identifying can-
part peak in the XMRs first and then, if found, perform the didate metabolites and studying this pathway in depth. The
spectral search based on the counterpart peak. The mass precise annotation procedures for these metabolites are de-
spectral search of XMRs did not aim at searching for the scribed in the Supplementary Methods. Briefly, the candi-
own mass spectra of the users by themselves, as provided dates were annotated using precursor ion mass and MS/MS
by MASST (10) and the mass spectral library MassBank spectra at the confidence level of 3 (putatively characterized
(25). compound classes) proposed by the Metabolomics Stan-
dards Initiative (MSI) (26,27).
APIs. It is a significant feature of XMRs that the untar-
geted metabolome data obtained from a wide range of sam- Annotation of carpaine-related metabolites in papaya. The
ples are ready to use for bioinformatics via application pro- sample-specific localization of peaks in FoodMR supported
gramming interfaces (APIs). XMRs provide APIs in repre- annotation of the carpaine-related biosynthetic and/or
sentational state transfer (REST) format for most of all the degradation intermediates in papaya (28). Carpaine, found
available functions on web browsers. Therefore, the users di- in papaya, is an alkaloid with antiviral and antiplasmodial
rectly use these functions from the external computational activities (29), but the biosynthetic pathway of carpaine is
programs. The APIs allow the users to perform the auto- not fully understood. Hiraga et al. (28) annotated eight
matic and massive search of a large number of data and carpaine-related metabolites, including carpaine, carpaic
subsequent complex data analysis, which is not practical acid, and three novel putative structures in papaya fruits,
to perform only in web browsers. The search results of the based on their accurate mass values and MS/MS spectra
APIs are available in JavaScript Object Notation (JSON) obtained by LC–MS. They did not identify these metabo-
format, which is suitable for processing with computational lites, probably owing to the limited availability of their au-
programming languages such as Python. Sample program thentic standards. However, they showed strong support
codes for the use of the APIs written in Python are available for the annotation using FoodMR in which untargeted
on the help page. Sample codes for searching candidates metabolome data from mature papaya fruits are registered.
of novel flavonoids (described later) and searching peaks The mass values of the eight carpaine-related metabolites,
specifically accumulated in certain specific sample groups except two abundantly accumulated in immature fruits,
(e.g. helpful for biomarker discovery) have been currently were detected in the mature papaya fruits in FoodMR. Fur-
provided (July 2022). A URL-based RESTful format as the thermore, the mass values of these were not detected in
API input is also advantageous for easy and precise record- other 221 foods. As carpaine was found in specific plants,
ing and sharing of specific information in XMRs, search papaya and Azima tetracantha (30), these results strongly
conditions, and so on. Examples are shown in the column suggested that the annotated metabolites were carpaine
‘Link to the peak information in FoodMR’ in Table 3. derivatives. Using the APIs of FoodMR, we were able to
find other candidate carpaine derivatives specific to papaya,
e.g. a putative derivative of dehydrocarpamic acid (http:
Application of XMRs
//metabolites.in/foods/peak/07109/pos/2567) with the same
An integrated analysis for discovery of metabolite and gene MS3 spectrum as that of dehydrocarpamic acid. We an-
candidates in species-specific metabolic pathways. Using notated the candidate using precursor ion mass and MS2
the peak table constructed from 535 samples in ThingMR and MS3 spectra at the MSI confidence level of 3 (pu-
(March 2022) and the published genome data, we calcu- tatively characterized compound classes) (Supplementary
lated the pairs of metabolite peaks and orthologs that are Methods). These candidates would be prioritized for fur-
detected in specific biological classes (Figure 6). We found ther identification and functional estimation.
a metabolite peak (m/z 207.057 in positive mode, RT 10.67)
that was specifically detected in Brassica oleracea, Bras- Identification of okaramines in the rhizosphere of hairy
sica rapa, Capsella bursa-pastoris and Raphanus sativus, vetch. The accumulation of food metabolome data led
and not detected in other plant species. A candidate for us to the identification of non-food-derived compounds,
this peak was an intermediate metabolite in the glucosino- okaramines. We identified pesticidal okaramines for the first
late biosynthesis pathway, 3-indolylmethylthiohydroximate. time from nature (31). Okaramines were first identified in
We found 905 orthogoups that showed the same plant soybean pulp (okara) inoculated with Penicillium simplicis-Table 3. Candidate novel flavonoids found by data mining in FoodMR
Peak Retention m/z ([M + FlavonoidSearch Link to the peak information in
Food ID Category Name ID time (min) H]+) score (MS3 ) Observation Candidate substituent* FoodMR
05014 Nuts and Walnuts, roasted 2560 40.0 785.0703 0.500 Walnuts specific http://metabolites.in/foods/peak/
seeds 05014/pos/2560
06058 2 Vegetables Chrysanthemum, 1704 37.8 553.1189 0.600 Present in pink but (Malonyl)-Galactosyl, http://metabolites.in/foods/peak/
petals, raw (pink) absent in yellow flowers (Malonyl)-Glucosyl, 06058 2/pos/1704
of chrysanthemum (Glucuronosyl)-Lactoyl
06267 Vegetables Spinach, leaves, all 7956 60.8 683.1613 0.667 Spinach specific (Rhamnosyl)- http://metabolites.in/foods/peak/
season, raw Galacturonosyl, 06267/pos/7956
((OMe)-Rhamnosyl)-
Glucosyl
06267 Vegetables Spinach, leaves, all 8020 61.5 713.1721 0.667 Spinach specific (Glucuronosyl)- http://metabolites.in/foods/peak/
season, raw Glucuronosyl 06267/pos/8020
06314 Vegetables Lettuce, green leaf 1507 35.7 727.1357 0.650 Asteraceae specific (Malonyl)- http://metabolites.in/foods/peak/
lettuce, leaves, raw (Glucuronosyl)-Glucosyl 06314/pos/1507
07078 Fruits Citrus, ‘Sudachi’, 5754 57.8 643.1668 0.500 ‘Sudachi’ specific Dihydrophaseoyl, http://metabolites.in/foods/peak/
peel, raw (p-Hydroxybenzoyl)- 07078/pos/5754
Galactosyl,
(p-Hydroxybenzoyl)-
Glucosyl
03001 Sugars and Sugars, brown sugar 4749 47.9 587.0706 0.800 A lot of peaks with the (Sulfo)-Glucuronosyl http://metabolites.in/foods/peak/
sweeteners lamp same MS3 spectra are 03001/pos/4749
found in rice leaves in
PlantMR.
03002 Sugars and Sugars, ‘Wasanbonto’ 2542 47.5 587.0699 0.667
sweeteners (traditional
non-centrifugal soft
white cane sugar)
17001 Seasonings Japanese Worcester 2102 47.7 587.0708 0.667
and spices sauce, common type
17031 Seasonings Seasoning sauce, 3085 47.8 587.0708 0.667
and spices oyster sauce
*Known substituents were identified by FlavonoidSearch tool.
Nucleic Acids Research, 2023, Vol. 51, Database issue D671
Downloaded from https://academic.oup.com/nar/article/51/D1/D660/6833247 by guest on 09 October 2023D672 Nucleic Acids Research, 2023, Vol. 51, Database issue
Raphanus sativus var. hortensis (Japanese radish)
A Brassicaceae
Brassica rapa var. perviridis (spinach mustard)
Capsella bursa-pastoris (shepherd's purse)
Brassica oleracea var. capitata (cabbage)
B Cucurbitaceae
Momordica charantia (bitter melon)
Citrullus lanatus (watermelon)
Cucumis sativus (cucumber)
Cucumis melo (melon)
Downloaded from https://academic.oup.com/nar/article/51/D1/D660/6833247 by guest on 09 October 2023
others
others
Metabolome: 1 in 2 peaks Metabolome: 1 in 41 peaks
Putative Indolylmethylthiohydroximate Putative Cucurbitacin S
Genome: 4 in 905 orthogroups Genome: 1 in 64 orthogroups
Indole glucosinolate O-methyltransferase Cytochrome P450 89A2
Figure 6. Metabolite and gene candidates found in the integrated metabolome and genome analysis. Using the peak table constructed from 535 samples in
ThingMR (March 2022) and published genome data, the candidate metabolites and orthologs localized in specific plant species were found. The candidates
putatively related to (A) glucosinolate and (B) cucurbitacin biosynthetic pathways and their cross-species distribution are shown.
simum AK-40 (32) and were found to have insecticidal ac- such as those detected in specific foods and those with neu-
tivity same as that of ivermectin (33). However, the pres- tral loss masses that have not been well reported previously
ence of okaramines in nature is unknown. We found sev- (Table 3). Although the candidates were not identified us-
eral candidates of okaramine species in the rhizosphere soil ing authentic standards (annotated at the MSI confidence
of the manure plant hairy vetch (Vicia villosa Rotch subsp. level of 3 ‘putatively characterized compound classes,’ see
villosa) in a metabolome analysis of soil samples. The MSn Supplementary Methods), they might be targets in a fu-
spectra showed good agreement with their chemical struc- ture study. The Python program code used for this search
tures. In addition, we found that no peaks matched the is available on the help page of FoodMR as an example of
okaramines of the 969 000 peaks from 222 foods (ESI- the use of APIs.
positive mode) registered in FoodMR. The absence in gen- During this investigation, we noticed that sample speci-
eral foods was reasonable when assuming the candidate ficity in non-food data helped to annotate the peaks in
peaks were okaramines that were probably derived from soil foods. Among the 23 peaks, a single candidate was hard
bacteria in the rhizosphere. This was a strong driver for us to annotate by its sample specificity in FoodMR. The peak
to identify okaramines using authentic standards. Finally, with m/z 587.07 was specifically detected in the food cat-
we identified okaramine A, B and C at the MSI confidence egory ‘Sugars and sweeteners’ and foods in ‘Seasonings
level of 1 (identified compounds) by the accurate precur- and spices,’ which includes sugars. The peak was present
sor ion mass, retention time, and MS2 and MS/MS spectra in brown sugar lumps and ‘Wasanbonto’ (traditional non-
(Supplementary Methods). centrifugal sugar), but absent in granulated sugar. The key
to annotating the situation was determined by PlantMR.
Discovery of novel flavonoid candidates. By data mining We found many peaks in rice leaves with the same MS3 spec-
using the APIs of XMR, we found several candidates for tra as that of the unannotated peak. This information re-
novel flavonoids in this study. The peaks in FoodMR that minded us that both brown sugar lump and ‘Wasanbonto’
matched the following conditions are potential candidates are made from sugar cane. Therefore, the peak in the sugars
of novel flavonoid derivatives: (i) no results in the com- might be a flavonoid with an aglycone actively biosynthe-
pound database search; (ii) MS3 spectra and (iii) a high sized in Poaceae.
similarity score from FlavonoidSearch for MS3 spectrum
(see Supplementary Methods). A search with multiple con- Detection of caffeine in honey. We found a peak annotated
ditions like this case is not practical for manual operation as caffeine––a plant-derived alkaloid established to accu-
in a web browser. Using APIs, we can perform complex mulate in coffee and tea––was also detected in honey in
searches easily and within a short time. Through a search FoodMR. We identified the peak in ThingMR as caffeine
of approximately 969 000 peaks in FoodMR (ESI-positive using an authentic standard compound at the MSI confi-
mode), we found 23 peaks that matched the conditions dence level of 1 (identified compounds) based on the iden-
above in 10 min. Then, we manually checked the sample tical accurate mass value of the precursor ion, the retention
specificity and features of the putative substituents using the time confirmed by co-injection, and MS/MS spectra (Sup-
FoodMR website. We found some interesting candidates, plementary Methods). We found that the presence of caf-Nucleic Acids Research, 2023, Vol. 51, Database issue D673
feine depends on the honey products; namely four out of ions is also possible. The alignment results on the download
seven honey products contained caffeine. This observation page may contain misalignments. The database search re-
was in good agreement with previous reports. Some citrus sults and FlavonoidSearch results only provide candidates
plants accumulate caffeine in the flowers and nectar, and and do not guarantee the presence or absence of the com-
caffeine can be found in honey (34). Moreover, rewarding pounds. These possibilities must be carefully examined dur-
honeybees with caffeine enhanced their memory of the flo- ing further investigations, especially for peaks annotated
ral scent (35). Therefore, caffeine production in the flower is solely by precursor ion mass values.
understood as a strategy for increasing reproductive bene-
fits by enhancing the pollinator’s fidelity (35). Although this
DISCUSSION
case was a rediscovery of previous knowledge on the known
compound caffeine, is also showed that the comparison of Comparable untargeted metabolome data, which have been
the large variety of samples with XMRs could lead to the lacking in systems biology and are now provided by XMRs,
construction of new and proper working hypotheses with- are a good resource for further data-driven research into
Downloaded from https://academic.oup.com/nar/article/51/D1/D660/6833247 by guest on 09 October 2023
out any prerequisite knowledge in a specific research field. unknown chemicals based on their sample-specific local-
izations. As exemplified in the integrated analysis of the
metabolome and the genome, the data resource facilitates
Precautions for data interpretation and use
the use of metabolome data in multi-omics studies. In the
We should draw users’ attention to precautions to avoid example of papaya and okaramines, FoodMR provided ap-
mis- and over-interpretation of XMR results, although propriateness for the presence of both the unknown un-
some of them are mentioned elsewhere in this study. In ad- knowns (truly novel compounds) and known unknowns
dition, when using the XMR results for further establish- (known compounds not described in the sample) (36), re-
ment of working hypotheses and investigation, it is always spectively, in the specific samples. Using caffeine as an ex-
necessary for users to confirm the results. First, the sample ample, the comparison of the various samples that are not
specificity results from the precursor ion mass search de- compared in a general design of a single study would find
pend on the samples deposited at the time of the search. an unexpected occurrence of metabolites that can lead to
Please consult the kind of samples (presence or absence) us- new working hypotheses. In the example of the data min-
ing the sample list for appropriate interpretation. Moreover, ing for novel flavonoids, the APIs of XMRs were used as a
sample specificity results based solely on the mass spectral powerful bioinformatics tool for the top-down discovery of
search are further dependent on the coverage of mass spec- unknowns based on their sample specificity. Although the
tra obtained through DDA. Combined use of the precursor sample specificity-based discovery of unknown metabolites
search would be required for proper interpretation (see the has been reported using GC–MS-based database (5), as far
section ‘Peak search by mass spectra’). Second, peak quality as we know, XMRs is the first public databases in which
should be considered. Please note that a significant number LC–MS-based untargeted metabolome data are compara-
of metabolites are undetectable under the LC–MS condi- ble based on the precursor ion mass, retention time, and
tions used in XMRs. For example, as shown on the ‘Com- MSn or MS/MS spectra in total 984 various samples. The
pound’ page, only 6 out of 20 amino acids were separated, provision of such datasets will strongly promote further use
ionized, and detected in ThingMR. Caffeine was only de- of the metabolome data, for example, correlation analysis
tected by the ESI-positive mode. The unique ‘not detected’ of metabolites and genes and the discovery of unknown
information for examined authentic standards on the ‘Com- metabolites for quality control markers of specific organ-
pound’ page would help users in speculating the detectable isms, among others.
metabolites based on their hydrophobicity, mass values, etc. Information on the precursor ion rather than the MS/MS
The similarity of the precursor ion mass, retention time, and or MSn spectra is useful in a public resource for depicting
MS/MS spectra to those of authentic standards strongly the sample-specific localization of the metabolites. MS/MS
suggests that the peak is the standard compound. However, or MSn spectra are often used for comparisons of struc-
the peak could still not be the standard but a rather simi- tural identity and the prediction of the structures of the
lar isomer that cannot be separated and distinguished un- metabolites (3,37). However, the data are dependent on the
der our conditions. At the very least, our system cannot dis- instruments and collision energy conditions; hence, the in-
tinguish between most of stereoisomers. Third, peak quan- terpretation and confidence of the results remain under dis-
tity (intensity) is neither an absolute nor accurate value be- cussion. In contrast, the accurate mass value of the pre-
cause it depends on various factors such as the amount of cursor ions is robustly obtained with commonly used high-
sample injected, metabolite extraction and ionization effi- resolution MS. As exemplified here, the papaya-specific lo-
ciency, ion suppression or enhancement, detector sensitiv- calization of the carpaine-related candidates was success-
ity at the time of analysis, and peak signal distribution (for fully examined based on the accurate mass values obtained
the log-transformed intensity centered by the median). Fi- by a different MS platform from that used in FoodMR (28).
nally, more general remarks should be made. The peak data Thus, the use of precursor ions is advantageous for enlarg-
in XMRs contain potential false positives and false nega- ing the comparison spaces of the metabolites. We also pre-
tives. Failures in estimating precursor ion mass could also viously demonstrated the usefulness of the accurate mass
occur as a result of monoisotopic ion peak mischaracter- records (AMRs) for the annotation of unknown metabo-
ization. This case is more likely to occur in the case of a lites and pointed out the limited availability of AMRs in
higher mass value and a multivalent peak with a low-signal the public domain as an issue for promoting the annotation
intensity for the monoisotopic ion. Misestimation of adduct (7). XMRs provide more than 11 107 619 AMRs obtainedD674 Nucleic Acids Research, 2023, Vol. 51, Database issue
from 984 samples in total (Table 2, July 2022). The availabil- would be helpful in discovering the volatiles and their water-
ity of these data on the XMR website and via APIs should soluble glycosides as storage forms by correlation analysis
promote the discovery, annotation, and identification of un- of their sample specificity.
knowns.
To assist further valuable knowledge discoveries, the con- Number of comparable datasets. Not only our XMRs, but
cept of XMR should be expanded, and some issues should also other comparable datasets should be constructed in dif-
be solved, as discussed below. ferent countries. For the efficient enlargement of the above-
mentioned points (sample variety and metabolite coverage),
the specification of a base center that can actively produce
Expansion of the concept of XMR
high-quality and comparable data is ideal, for two main
The concept of XMR should be expanded through the fol- reasons. First, a general metabolome analysis service where
lowing four aspects. samples are provided by the researchers is not suitable be-
cause the sample diversity is affected by researchers’ inter-
Downloaded from https://academic.oup.com/nar/article/51/D1/D660/6833247 by guest on 09 October 2023
Variety of the samples. The variety of the samples should ests, causing it to be biased toward some specific samples,
be increased. As exemplified in the discovery of novel such as humans and model organisms. For example, out of
flavonoids, the non-food data obtained from plant sam- 128 156 data entries measured by reversed-phase LC–MS
ples helped to annotate the unknown metabolites found in published from MetaboLights (January 2022), 50.9%, and
foods. Conversely, the okaramine cases showed that food 16.1% were samples from humans and perennial ryegrass,
data helped to identify the metabolites derived from non- respectively; only 767 unique organism parts were present.
food samples. These results obtained by the previously un- The active collection and analysis of unanalyzed samples
expected specific comparisons suggest that increasing the are required to enlarge the sample variety efficiently. Sec-
sample varieties synergistically accelerates the annotation ond, a general analysis service/center where the analysis
of the unknowns based on their sample-specific localiza- methods are customized according to the users’ requests
tions. Therefore, not only the samples in specific categories is not suitable to maintain sufficient data quality. The re-
(such as foods and plants) should be measured, but also stricted use of the analytical instruments in constant con-
any other samples (e.g. from animals, bacteria, the environ- ditions with a single or several specific method(s) is re-
ment, waste, artificial products, historical samples) can be quired for the production of robust and comparable untar-
added into a dataset for comparison. Consequently, we are geted metabolome data. This machine use policy is espe-
now expanding ThingMR. As demonstrated in Supplemen- cially important for producing high-quality data using mul-
tary Figure S1, the unique peaks have not yet been satu- tiple platforms for expanding metabolite coverage. How-
rated. The index APSR (Figure 1) we proposed in this arti- ever, it is not practical to establish a centralized base that
cle would facilitate selecting the category of the unanalyzed analyses all ‘things’ from all over the world owing to the
samples. maintenance costs, throughput bottlenecks, and need for
international shipping of the materials. Therefore, multi-
Coverage of the metabolites. The coverage of metabolites ple datasets in which the sample data are comparable in
should also be expanded by the addition of several robust the dataset should be constructed by individual base cen-
instrumental platforms. Only a single reversed-phase LC ters established in various countries. As exemplified here,
method was used for the construction of XMRs. Therefore, even a single dataset contributes to knowledge discovery.
a large portion of the metabolites, such as highly hydrophilic Furthermore, some datasets can be compared based on the
compounds (e.g. sugars, organic acids and most amino similarity of the analytical methods, as demonstrated in the
acids), highly hydrophobic compounds (e.g. carotenoids comparisons between FoodMR and ThingMR or data from
and non-polar lipids), and volatiles (e.g. low-molecular ter- MetaboLights and XMRs (Supplementary Data 1). Data
penes, aldehydes, and alcohols) are omitted and not com- obtained from a common sample readily available in every
pared in the current XMRs. The use of other separation country, such as a major crop, could be used to link and
technologies for constructing them, such as lipid-focused standardize the datasets.
LC–MS or supercritical fluid chromatography–MS, hy-
drophilic interaction chromatography (HILIC)–MS for hy- Bioinformatic researchers. An increase in the number of
drophilic compounds, GC–MS for volatiles, and CE–MS bioinformatic researchers who discover new knowledge and
for ionic water-soluble compounds, and the establishment working hypotheses and add value to the database is es-
of robust measurement procedures for arbitrary compari- sential for expanding the concept of XMR. We expect that
son of a large number of samples are required. Also, the the number of bioinformatic researchers who are interested
mass accuracy and coverage of MS/MS spectra should be in XMRs will increase as the abovementioned points oc-
improved using high-spec MS instruments. Some widely curs. The provision of APIs, which enables the integration
targeted approaches will facilitate the annotation of the of metabolome data to other studies, such as genome, tran-
data. Furthermore, any other compound detection tech- scriptome, proteome, and phenome data, is critical for the
nologies, such as chemical sensors, may be applicable as bioinformatic use of XMR. For this purpose, further en-
long as they are reproducible and robust for large-scale richment of sample metadata, such as biological taxonomy,
comparison. The application of multiple platforms to the treatment, and processing, as well as provision of the meta-
same sample set should strongly enhance the annotation data described with proper ontology and controlled vocab-
and discovery of novel metabolites. For example, the com- ulary as a machine-readable format should be promoted in
bined use of LC–MS and GC–MS for various samples the future (see the next section). Broadening the researchYou can also read