The territorial impact of COVID-19: Managing the crisis across levels of government
←
→
Page content transcription
If your browser does not render page correctly, please read the page content below
1
The territorial impact of COVID-19:
Managing the crisis across levels of
government
Updated 10 November 2020
COVID-19 has governments at all levels operating in a context of radical
uncertainty. The regional and local impact of the COVID-19 crisis is highly
heterogeneous, with significant implications for crisis management and
policy responses. This paper takes an in-depth look at the territorial impact
of the COVID-19 crisis in its different dimensions: health, economic, social
and fiscal. It provides examples of responses by national and subnational
governments to help mitigate the territorial effects of the crisis, and offers
ten takeaways on managing COVID-19’s territorial impact. Finally, the
paper offers a forward looking perspective to discuss the crisis’ implications
for multi-level governance as well as points for policy-makers to consider as
they build more resilient regions.
THE TERRITORIAL IMPACT OF COVID-19: MANAGING THE CRISIS ACROSS LEVELS OF GOVERNMENT © OECD 2020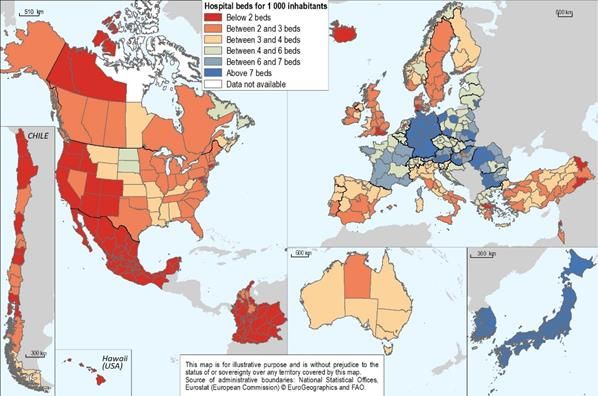
2
In 2020 COVID-19 affected almost all countries and more than 50 million people around the world. It has
governments operating in a context of radical uncertainty, and faced with difficult trade-offs given the
health, economic and social challenges it raises. By spring 2020, more than half of the world’s population
had experienced a lockdown with strong containment measures. Beyond the health and human tragedy of
the coronavirus, it is now widely recognised that the pandemic triggered the most serious economic crisis
since World War II. Many economies will not recover their 2019 output levels until 2022 at the earliest
(OECD, 2020[1]). A rebound of the epidemic in autumn 2020 is increasing the uncertainty. The nature of
the crisis is unprecedented: beyond the short-term repeated health and economic shocks, the long-term
effects on human capital, productivity and behaviour may be long-lasting. The COVID crisis has massively
accelerated some pre-existing trends, in particular digitalisation. It has shaken the world, setting in motion
waves of change with a wide range of possible trajectories (OECD, 2020[2]).
This paper highlights the strong territorial dimension of the COVID-19 crisis. Subnational governments –
regions and municipalities – are at the frontline of the crisis management and recovery, and confronted by
COVID-19’s asymmetric health, economic, social and fiscal impact – within countries but also among
regions and local areas. For example, the health of populations in some regions is more affected than in
others. Large urban areas have been hard hit, but within them deprived areas are more strongly affected
than less deprived ones. Over the past few months, the health impact has spread towards less populated
regions in some countries. In the United States for instance, the highest increase in the number of deaths
occurring in October were in the rural counties not adjacent to a metropolitan areas. The various risks vary
greatly depending on where one lives. This regionally differentiated impact calls for a territorial approach
to policy responses on the health, economic, social, fiscal fronts, and for very strong inter-governmental
coordination.
Many governments at all levels have reacted quickly, applying a place-based approach to policy
responses, and implementing national and subnational measures for in response to the COVID-19 crisis:
On the health front, many countries are adopting differentiated territorial approaches, for example
on policies surrounding masks or lockdowns.
On the socio-economic front, governments are providing massive fiscal support to protect firms,
households and vulnerable populations. They have spent more than USD 12 trillion globally since
March 2020. Many countries, and the EU, have reallocated public funding to crisis priorities,
supporting health care, SMEs, vulnerable populations and regions particularly hit by the crisis. In
addition, more two thirds of OECD countries have introduced measures to support subnational
finance – on the spending and revenue side – and have relaxed fiscal rules.
Many governments announced large investment recovery packages – already much larger than
those adopted in 2008 – focusing on public investment. These investment recovery packages
prioritise three areas: strengthening health systems; (ii) digitalisation; (iii) accelerating the transition
to a carbon neutral economy.
This paper provides good practice examples on policy responses to help mitigate the impact of the crisis
on regions and municipalities in all OECD countries, and beyond. Below are ten early takeaways on
managing COVID-19’s territorial impact, its implications for multi-level governance, subnational finance
and public investment, as well as points for policy-makers to consider as they build more resilient regions.
Introduce, activate or reorient existing multi-level coordination bodies that bring together national
and subnational government representatives to minimise the risk of a fragmented crisis response.
Support cooperation across municipalities and regions to help minimise disjointed responses and
competition for resources. Promote inter-regional or inter-municipal collaboration in procurement
especially in emergency situations. Promote the use of e-government tools and digital innovation
to simplify, harmonise and accelerate procurement practices at subnational level
THE TERRITORIAL IMPACT OF COVID-19: MANAGING THE CRISIS ACROSS LEVELS OF GOVERNMENT © OECD 2020
3
Cross-border cooperation should be actively pursued and supported at all levels of government, in
order to promote a coherent response recovery approach across a broad territory (e.g. border
closure and reopening, containment measures, exit strategies, migrant workers).
Consider adopting a “place based” or territorially sensitive approach for measures to fight the
pandemic
Strengthen national and subnational-level support to vulnerable groups to limit further deterioration
in their circumstances and to strengthen inclusiveness, including by simplifying and facilitating
access to support programmes, ensuring well-targeted services, introducing adequate and/or
innovative fiscal support schemes, and identifying the needs for revising fiscal equalisation policies.
Foster continuous dialogue between national and subnational governments regarding COVID-19’s
fiscal impact on subnational budgets using shared evidence and data and taking into account the
differentiated impact of the crisis. Help subnational governments reduce the gap between
decreasing revenues and increasing expenditures during the COVID-19 crisis to avoid
underfunded and unfunded mandates and possible sharp cuts in subnational spending. Special
grant schemes could help close these gaps.
Explore and introduce other temporary or permanent, fiscal tools and measures, including tax
arrangements, easier access to external financing (debt), and more flexible, modern and innovative
financial management tools. Focus on reviewing subnational financial management and
strengthening expenditure and revenue effectiveness, as a means to contribute to restoring fiscal
stability over the medium and long terms.
Integrate a territorial dimension in national investment recovery strategies and involve subnational
governments in their implementation early on, and not only municipalities but regions as well.
Draw some lessons from the 2008 crisis in the implementation of investment recovery strategies
to avoid some mistakes which were made at that time. Among the risks to avoid are to atomise the
allocation of the funding in a myriad of small infrastructure projects to spend the money rapidly at
the expense of long-term priorities (e.g. sustainability and resilience).
Use public investment across at all levels of government to support COVID-19 recovery over time:
avoid using it as an adjustment variable; minimise fragmentation in the allocation of investment
funds targeting COVID-19 responses; ensure allocation criteria are guided by strategic regional
priorities; integrate social and climate objectives into recovery plans designed by all levels of
government; and consider introducing a resilience-building criteria for the allocation of public
investment funding for all levels of government.
The territorial impact of COVID-19
Introduction
The COVID-19 crisis has governments around the world operating in a context of radical uncertainty, and
faced with difficult trade-offs given the health, economic and social challenges it raises. Within the first
three months of 2020, the novel coronavirus developed into a global pandemic. Schools and universities
were closed in spring 2020 for more than one billion students of all ages. By November 2020, COVID-19
spread to almost all countries and affected more than 50 million people around the world, resulting in more
than 1.25 million deaths. More than half of the world’s population has experienced a lockdown with strong
containment measures – the first time in history that such measures are applied on such a large scale.
Beyond the health and human tragedy of COVID-19, it is now widely recognised that the pandemic
triggered the most serious economic crisis since World War II. All economic sectors are affected by
disrupted global supply chains, weaker demand for imported goods and services, a drop in international
tourism (OECD, 2020[3]), a decline in business travel, and most often a combination of these. Measures to
THE TERRITORIAL IMPACT OF COVID-19: MANAGING THE CRISIS ACROSS LEVELS OF GOVERNMENT © OECD 2020
4
contain the virus’ spread have hit SMEs and entrepreneurs particularly hard (OECD, 2020[4]).
Unemployment levels and the number of aid seekers have increased, sometimes dramatically. Many
countries “exited” virus containment measures to mitigate the impact of the economic crisis only to face a
rising wave of cases in autumn 2020, jeopardising recovery The exit strategy from the crisis is not linear,
with possible “stop and go” strategies of lockdowns until a treatment or vaccine or cure is available.
Estimates released by the OECD in September 2020 indicate that real global GDP is projected to decline
by 4.5% in 2020 before picking up by 5% in 2021. OECD unemployment is projected to rise to 9.4% in Q4
2020 from 5.4% in 2019. The projections assume that sporadic local outbreaks of the virus will continue,
with these being addressed by targeted local interventions rather than national lockdowns; wide availability
of a vaccination is not expected until late in 2021. (OECD, 2020[1])
Figure 1. Global GDP projections
Constant prices, Index 2019 Q4 = 100
Source: OECD (2020), OECD Economic Outlook, Interim Report September 2020
Given the multi-faceted nature and unprecedented scale of the COVID-19 crisis, comparisons with past
crises, including the 2008-2009 financial crisis, have significant limitations. COVID-19 is proving unique in
its generation of both a supply side and a demand side shock, and its impact on all sectors and regions of
the world. The uncertainty is also much higher. Governments face a difficult trade off: managing the
economic recovery and mitigating the impact of a second wave of the virus.
The COVID-19 crisis has a strong territorial dimension with significant policy implications for managing its
consequences. Two central considerations for policy makers are:
The regional and local impact of the crisis is highly asymmetric within countries. Some regions,
particularly the more vulnerable ones, such as deprived urban areas, have been harder hit than
others. Certain vulnerable populations, too, have been more affected. In economic terms, the
impact of the crisis is differing across regions, at least in its initial stages. Differentiating factors
include a region’s exposure to tradable sectors, its exposure to global value chains and its
specialisation, such as tourism.
THE TERRITORIAL IMPACT OF COVID-19: MANAGING THE CRISIS ACROSS LEVELS OF GOVERNMENT © OECD 2020
5
Subnational governments – regions and municipalities – are responsible for critical aspects of
containment measures, health care, social services, economic development and public investment,
putting them at the frontline of crisis management. Because such responsibilities are shared among
levels of government, coordinated effort is critical.
The COVID-19 pandemic will have short- medium- and long-term effects on territorial development and
subnational government functioning and finance. One risk is that government responses focus only on the
short term. Longer-term priorities must be included in the immediate response measures in order to boost
the resilience of regional socio-economic systems.
The territorial impact of the health crisis
COVID-19, like all pandemics, has a spatial dimension that needs to be managed (McCoy, 2020[5]). By
November 2020, it is clear that the impact of the COVID-19 crisis differs markedly not only across countries,
but also across regions and municipalities within countries, both in terms of declared cases and related
deaths. In the People’s Republic of China (hereafter ‘China’), 83% of confirmed cases were concentrated
in Hubei province. In Italy, the country’s north was hardest hit, and one of the wealthiest region in Europe,
Lombardy, registered the highest number of cases (47% as of November) (Italian Government Covid-19
Data Platform, 2020[6]). In France, the regions of Île-de-France and Grand Est were the most affected with
34% and 15% of national cases respectively (French Government Covid-19 Data Platform, 2002[7]). In the
United States, New York the largest share of federal cases (14.6%), followed by Texas (8%). In Canada,
the provinces of Quebec and Ontario accounted for respectively 61% and 31% of total cases as of
November (Canadian Government Covid-19 Data Platform, 2020[8]). In Chile, Metropolitan Santiago
accounted for 70% of cases as of November (Chile Ministry of Health, 2020[9]). In Brazil, Sao Paulo
registered 25% of cases as of November (Brazilian Government Covid-19 Data Platform, 2020[10]). In India,
the State of Maharashtra registered 21% of confirmed cases in India and in Russia, Moscow represented
24% of total cases as of November.
COVID-19-related mortality rates also exhibit a strong regional concentration (Figure 2). Within-country,
COVID-19 deaths per 100 000 inhabitants can vary greatly, particularly in most hard hit countries. For
example, in Italy, Calabria is the least affected region with 5.5 deaths per 100 000 inhabitants against 171
per 100 000 inhabitants in Lombardy, the most affected. Similarly in the United States, Vermont recorded
9.3 deaths per 100 000 inhabitants versus 184 in New Jersey. In Brazil, Minas Gerais recorded 41.8 deaths
per 100 000 inhabitants while Distrito General death toll reached 120 per 100 000. Regions in South Korea
and New Zealand were less affected overall. Sejong recorded 0 deaths per 100 000 while Daegu recorded
8.1 deaths per 100 000.
THE TERRITORIAL IMPACT OF COVID-19: MANAGING THE CRISIS ACROSS LEVELS OF GOVERNMENT © OECD 2020
6
Figure 2. Within-country differences in COVID-19 fatalities
COVID-19 fatalities per 100,000 inhabitants, NUTS-2 (TL2) regions as of November 2020
lowest average highest
New Zealand West Coast
Korea Daegu
Japan Ishikawa
Australia Victoria
Austria Vienna
Germany Bavaria
Denmark Hovedstaden
Poland Mazowieckie
Czech Republic Karlovy Vary
Switzerland Ticino
Portugal Área Metropolitana de Lisboa
Canada Quebec
Netherlands Limburg
Sweden Stockholm
France Île-de-France
Italy Lombardy
Colombia Amazonas
United Kingdom Tameside
United States New Jersey
Chile Metropolitana (Santiago)
Mexico Ciudad de Mexico
Spain Castile La Mancha
Brazil Distrito Federal
Belgium Brussels
0 20 40 60 80 100 120 140 160 180 200
COVID-19 fatalities per 100,000 inhabitants
Note: The 24 countries are OECD countries plus Brazil. Among the 37 OECD countries, Estonia, Latvia and Luxembourg have no regions at
NUTS 2 level; there are no data at NUTS 2 level for Iceland, Ireland, Israel, Finland, Greece, Hungary, Lithuania, Norway, Slovak Republic and
Slovenia. For New Zealand, data is available by District Health Boards. For Canada and Japan, one province (Prince Edward Island) and one
prefecture (Iwate) respectively are missing. For the United States, only the 50 States are considered. Data were retrieved between 24 October
and 2 November.
Source: (Australian Broadcasting Corporation, 2020[11]; Austria Federal Ministry of Social Affairs, Health, Care and Consumer Protection,
2020[12]; Belgium Infectious Diseases Data Exploration Platform, 2020[13]; Brazilian Government Covid-19 Data Platform, 2020[10]; Canadian
Government Covid-19 Data Platform, 2020[8]; Chile Ministry of Health, 2020[9]; Colombia National Institute of Health, 2020[14]; Czech Republic
Ministry of Healthcare, 2020[15]; Dutch Ministry of Health, Welfare and Sport, 2020 [16]; French Government Covid-19 Data Platform, 2002[7])
(Italian Ministry of Health, 2020[17]; Japanese Covid-19 Data Platform, 2020[18]; John Hopkins University Centre for Systems Sciences and
Engineering, 2020[19]; Mexican Government Covid-19 Platform, 2020[20]; New Zealand Ministry of Health, 2020[21]; Poland Ministry of Heath,
2020[22]; Robert Koch Institute, 2020[23]; South Korea Ministry of Health and Welfare, 2020[24]; Spanish Ministry of Health, 2020[25]; Statens Serum
Institut, Denmark, 2020[26]) (Swedish Public Health Agency, 2020[27]; Swiss Government Covid-19 Data Platform, 2020[28]; United Kingdom
Government Covid-19 Platform, 2020[29])
There are a number of factors that contribute to the differentiated impact of COVID-19, which also may
explain the disparities observed in countries as diverse as Canada, Chile, Korea and the UK. One factor
relates to how the first “clusters” of cases developed and highlights the difficulty in typifying or anticipating
where the virus may start. In many instances, large cities, with their dense international links – including
international markets, business travel, tourism, etc. – were often the entry points for the virus and were
particularly affected. Contagion can spread more quickly in large urban areas, due to proximity, if
preventive, protective or containment measures are not introduced early enough. However, it is not
THE TERRITORIAL IMPACT OF COVID-19: MANAGING THE CRISIS ACROSS LEVELS OF GOVERNMENT © OECD 2020
7
possible to establish a clear correlation between density and incidence of the disease. Some very densely
populated Asian cities, such as Hong Kong (7.5 million), and Seoul (9.8 million) Singapore (5.6 million)
and Tokyo (9.3 million) saw limited diffusion of COVID-19 thanks to early and very proactive measures,
mask wearing and extensive testing (OECD, 2020[30]). It appears that the problem is more a combination
of density plus other factors such as a lack of appropriate measures such as contact tracing, poor housing
conditions, or limited access to health care.
Rural areas also experienced “first clusters”, and regions with high numbers of elderly people were
affected. Rural regions tend to be equipped with fewer hospital beds. Overall, metropolitan areas and their
adjacent regions are better equipped in terms of hospital beds than regions far from metropolitan areas. In
2018, regions close to metropolitan areas had almost twice as many hospital beds per 1 000 inhabitants
than remote regions. This gap has grown significantly since 2000 (OECD, Forthcoming[31]).
While often the virus first took hold in urban areas, over the past few months some countries saw the health
impact spread towards less populated regions. In the US for instance, the highest increase in the number
of deaths (as a share of a county’s population) occurring in October 2020 were in rural counties not
adjacent to a metropolitan areas. The latter are under strain as daily deaths have continued to increase,
reaching 0.86 per 100 000 in October, compared to 0.11 in May 2020. Daily deaths rate in metro areas
counties of above 1 million people peaked in May 2020 at 0.49 and have remained at or below 0.35 since
then (Figure 3).
Figure 3. COVID-19 deaths per county group (rural-urban), United States
COVID-19 daily deaths per 100,000 population, United States by county, 7-day rolling average
1.0
Completely rural or less than 2,500 urban population, not adjacent to a metro area
Completely rural or less than 2,500 urban population, adjacent to a metro area
0.9 Urban population of 2,500 to 19,999, not adjacent to a metro area
Urban population of 2,500 to 19,999, adjacent to a metro area
0.8 Urban population of 20,000 or more, not adjacent to a metro area
Urban population of 20,000 or more, adjacent to a metro area
Counties in metro areas of fewer than 250,000 population
0.7
Counties in metro areas of 250,000 to 1 million population
Counties in metro areas of 1 million population or more
0.6
0.5
0.4
0.3
0.2
0.1
0.0
01-20 02-20 03-20 04-20 05-20 06-20 07-20 08-20 09-20 10-20
THE TERRITORIAL IMPACT OF COVID-19: MANAGING THE CRISIS ACROSS LEVELS OF GOVERNMENT © OECD 2020
8
Note: Counties are classified according to United States Rural-Urban Continuum Codes. Data on COVID-19 deaths span from January 22 to
October 22, 2020.
Source: Author’s elaboration based on data from: USDA, USA Facts
Density per se is not the problem. The problem is density associated with poverty, poor housing conditions
and limited access to health care (Basset, 2020[32]). Poverty and access to hospitals are more important
indicators than density. Within cities, some neighbourhoods are also more affected. These are often areas
with lower incomes, such as the Bronx in New York City, or Seine-Saint-Denis in the Paris region. New
York City Health Department data indicate that Manhattan, the borough with the highest population density,
was not the hardest hit. Deaths are concentrated in the less dense, more diverse boroughs. Factors that
do seem to explain clusters of COVID-19 deaths in the US include household crowding, poverty, socio-
economic segregation and participation in the work force (Basset, 2020[32]).
Deprived areas are the most strongly affected
According to the United Kingdom (UK) Office for National Statistics (ONS), there is evidence that more
deprived areas in England and Wales are experiencing a disproportionate rate of deaths due to COVID-
19 compared to less deprived ones (Iacobucci, 2020[33]). The ONS study underlines that poverty and
population density significantly increase the risk of death due to the coronavirus. For example, in Wales,
the most disadvantaged areas had registered around 45 COVID-19 deaths per 100 000 people, while
areas with less deprivation have experienced close to 23 COVID-19 deaths per 100 000 inhabitants
(Iacobucci, 2020[33]) between January and April 2020.
In France, mortality rates are twice as large in municipalities in the first quartile of the national income
distribution than in municipalities in higher quartiles (Brandily, 2020[34]). This heterogeneity maybe
explained by municipal differences in housing conditions and occupational exposure.
In the US, lagging counties have recorded more deaths (60 COVID-19 deaths per 100 000 people) than
wealthier ones (48 COVID-19 deaths per 100 0000). In the first income quintile of per capita GDP, new
COVID-19 deaths were significantly higher than in other quintiles between August and October (Figure 4).
While density associated with poor housing conditions plays a role in the spread of the virus, it is worth
noting that mortality rates are also determined by the health system capacity, and pre-existing health
conditions (e.g. high blood pressure, obesity, and diabetes), which themselves tend to be correlated to
income and education.
THE TERRITORIAL IMPACT OF COVID-19: MANAGING THE CRISIS ACROSS LEVELS OF GOVERNMENT © OECD 2020
9 Figure 4. COVID-19 deaths per county group (GDP per capita), United States COVID-19 daily deaths (7-day rolling average) per 100,000 population, United States, by counties according to county GDP per capita (2018) Note: United States counties are classified according to GDP per capita quintiles based on data from the BEA for 2018. Data on COVID-19 deaths span from January 22 to October 22, 2020. Source: Author’s elaboration based on data from: Bureau of Economic Analysis, Local Area Gross Domestic Product, 2018 THE TERRITORIAL IMPACT OF COVID-19: MANAGING THE CRISIS ACROSS LEVELS OF GOVERNMENT © OECD 2020

10
Figure 5. The asymmetric impact of the health crisis
Italy, total confirmed cases per 100,000 (October 12, 2020) Canada, total confirmed cases (October 12, 2020)
United Kingdom, total confirmed cases (October 12, 2020) Mexico total confirmed cases (October 26, 2020)
Germany, total confirmed cases (November 8, 2020) United States, total confirmed cases (October 26, 2020)
Note: For United Kingdom, Isles of Scilly cases combined with Cornwall
Source: (Italian Government Covid-19 Data Platform, 2020[6]); (Canadian Government Covid-19 Data Platform, 2020[8]); (BBC, 2020[35]) based
on (United Kingdom Government Covid-19 Platform, 2020[29]); (Mexican Government Covid-19 Platform, 2020[20]); (BBC, 2020[35]) based on
(United Kingdom Government Covid-19 Platform, 2020[29]); (New York Times, 2020[36]) based on (New York City Department of Health and
Mental Hygiene, 2020[37]);
THE TERRITORIAL IMPACT OF COVID-19: MANAGING THE CRISIS ACROSS LEVELS OF GOVERNMENT © OECD 2020 11
Most regions were underprepared for a crisis of such magnitude
Most countries, regions and cities were not well prepared for this pandemic for several reasons: i) they
underestimated the risk when the outbreak emerged; ii) many did not have crisis management plans for
pandemics (with the exception of Asian countries that battled the SARs pandemic, and some others, such
as the Nordic countries, where crisis management plans are required); iii) they lacked basic, essential
equipment, such as masks; and iv) they absorbed reduced public expenditure and investment in health
care/hospitals. Since the start of the “Great Recession” launched by the 2008 financial crisis up until 2018,
the number of hospital beds per capita decreased in almost all OECD countries, declining 0.7% per year,
on average.
Not all regions are equally equipped to battle the crisis. Regional disparities in access to health care are
quite high in some countries when measured by the number of hospital beds per 1 000 inhabitants
(Figure 6). These disparities appear to be regardless of whether health care spending is decentralised. It
should be noted, however, that the number of hospital beds alone is a limited measure for real health care
capacity and quality. Much depends on health worker density and distribution, and the quality of hospital
equipment. Some research suggests that regional disparities in health outcomes in Spain and Italy have
not increased after the decentralisation of health care spending (Lopez-Casasnovasa, Costa-Font and
Planas, 2005[38]; Bianco and Bripi, 2010[39]). Furthermore, a recent OECD Fiscal Federalism Network study
showed that hospital costs are lower in countries with a higher degree of administrative decentralisation,
even after controlling for particular treatments (Kalinina et al., 2019[40]). The decentralisation and
concentration debates need to be distinguished for the different categories, notably basic health and
intensive care. For the most advanced care, there are obvious quality arguments for concentrating
(although not necessarily centralising) services. In such cases, however, there remains a need to ensure
that travel times to care centres do not prevent service use.
Figure 6. Large regional disparities in access to health services
Hospital beds per 1 000 inhabitants by region, 2018
Note: data for Iceland and Quebec are from OECD Health Statistics.
Source: OECD Regional Database – oe.cd/2Wd
THE TERRITORIAL IMPACT OF COVID-19: MANAGING THE CRISIS ACROSS LEVELS OF GOVERNMENT © OECD 202012
Subnational governments at the frontline of crisis management
Since the outbreak of the pandemic in early 2020, regional and local governments have been at the
forefront of managing the COVID-19 health crisis and its social and economic consequences. Together
with central governments and social security bodies, they have significant responsibilities in the different
areas affected by the COVID-19 crisis. In many countries, subnational governments are responsible for
critical aspects of health care, from primary care to secondary care, including hospital management,
accounting for 25% of total public health expenditure, on average (Figure 7).
Figure 7. The share of subnational government in public expenditure by sector in OECD countries,
2017
80% 76%
70% 64%
59%
60%
48%
50%
40% 34%
30% 25% 24%
21%
20% 14%
10%
1%
0%
Housing and Environment Recreation, Education Economic Health Public Order General Social Defense
Community Culture and Affairs &Safety Services Protection
Amenities Religion
Note: The OECD average (unweighted) is calculated for 33 countries (no data for Canada, Chile, and Mexico). The functional areas correspond
the Classification of the Functions of Government (COFOG), which distinguishes 10 areas. The total of general government spending is non-
consolidated.
Source: (OECD, 2018[41])
Since the beginning of the crisis, regions and cities are facing urgent social care demands from the elderly,
children, disabled, homeless, migrants and other vulnerable populations – all of whom are directly and/or
indirectly affected by the coronavirus. In many countries, subnational government are also responsible for
welfare services and social transfers. In addition, subnational governments play a large role in delivering
education, representing 50% of public education spending. Regional and local governments are managing
the closing and re-opening of schools under very strict health measures.
Subnational governments are also ensuring the continuity of public services in a crisis context, adapting
these as necessary, and protecting their own staff. Citizens expect seamlessness in essential public
services, such as water distribution and sanitation, waste collection and treatment, street cleaning and
hygiene, public transport, public order and safety, and basic administrative services, and the proper
delivery of many of these are fundamental in managing the pandemic. In some countries, emergency
services and police are managed by state, regions and municipalities, and they have been called upon
during confinement periods to ensure control, security and rescue.
Regional and local governments are responding by maintaining essential services, if not at full service-
levels then at adjusted ones, and by developing or providing better access to tele-services (tele-health
consultations, tele-education). Finally, the emergency situation has led many subnational governments to
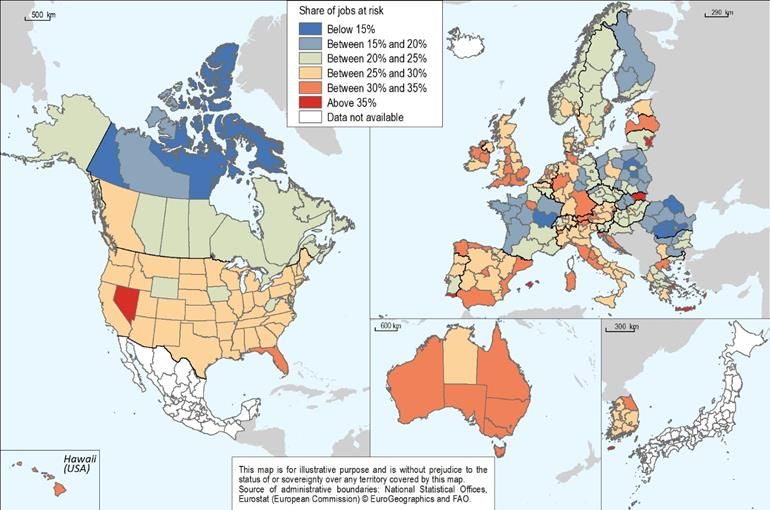
THE TERRITORIAL IMPACT OF COVID-19: MANAGING THE CRISIS ACROSS LEVELS OF GOVERNMENT © OECD 2020 13 take initiatives in areas outside the scope of their responsibilities, either upon request by the central government or because they decided to do so in response to emergencies that arose. The territorial impact of the economic crisis engendered by COVID-19 Many comparisons have been made between the COVID-19 crisis and the 2008 global financial crisis, but they differ radically in scope, origin (endogenous in 2008 versus exogenous in 2020), and consequences. Both crises are also very different in their impact on territories, with the 2020 crisis having a more differentiated impact than that of 2008. The economic impact of the COVID-19 crisis differs across regions, depending on the region’s exposure to tradable sectors and global value chains. For example, regions with economies that are heavily dependent on tourism will be more affected by the coronavirus than other regions. Capital regions or other metropolitan regions show a relatively higher risk of job disruption than other regions (OECD, 2020[42]). In the US for example, analysis of county-level infection by Brookings and economic data shows that the nation’s COVID-19 case load not only remains heavily concentrated, but that the hardest-hit counties and metropolitan areas constitute the very core of the nation’s productive capacity. According to Brookings, the 50 hardest-hit US counties “support more than 60 million jobs and 36% of its GDP” (Muro, Whiton and Maxim, 2020[43]). The crisis’ impact on regional employment may also vary significantly across regions within countries. Regions with large shares of non-standard employment can help explain within-country differences arising from the COVID-19 crisis. Evaluating the share of jobs potentially at risk from a lockdown is one way to assess the territorial impact of the COVID-19 crisis. These shares can be estimated based on the specific sectors of activity considered to be at risk in a region, following an OECD note on the economic impact of containment measures (OECD, 2020[44]). Regional disparities in the share of jobs potentially at risk in the short term as a result of confinement measures are stark. In May 2020, the OECD estimated that these shares ranged from less than 15% to more than 35% across 314 regions in 30 OECD and 4 non-OECD European countries (Figure 8). In one out of five OECD/EU regions, more than 30% of jobs are potentially at risk during a lockdown (OECD, 2020[42]). In the short term, tourist destinations and large cities are suffering the most from COVID-19 containment measures. The importance of tourism and of local consumption – including large retailers, general-purpose stores, and businesses in the hospitality industry, such as coffee shops and restaurants – partially explains this. The extent to which activities have recovered during the high tourist season is an important factor to determine the actual economic decline in tourist destinations. THE TERRITORIAL IMPACT OF COVID-19: MANAGING THE CRISIS ACROSS LEVELS OF GOVERNMENT © OECD 2020
14
Figure 8. Share of jobs potentially at risk from COVID-19 containment measures
Source: (OECD, 2020[42]) [calculations done in May 2020]
The longer and more stringent the containment measures, the higher the risk for regional economies. In
summer 2020, targeted (localised) lockdowns were adopted in a number of countries to minimise the costs
of national lockdowns. In autumn 2020, some countries are going back to national confinement measures
to mitigate the impact of a second wave of cases. Possible stop-and-go measures are expected in the
coming months, until a vaccination is available. The full impact for 2020 is yet to be calculated. Previous
OECD work shows that the recovery of OECD regions after the 2008 global financial crisis took years. In
more than 40% of OECD and EU regions, even seven years after the start of the crisis, per capita GDP
was still below pre-crisis levels.
Mitigating the impact of confinement and facilitating social distancing: the impact of telework
The extent to which occupations can be performed remotely is an important mitigating factor with respect
to economic impact and cost of COVID-19 containment measures. Occupations amenable to remote
working depend strongly on the nature of the tasks carried out, which can differ significantly even within
the same workplace. For example, academic researchers in universities can often continue working during
a lockdown or under social distancing requirements, while canteen staff working in the same university
may be forced to cease or strongly reduce their activities.
The OECD recently estimated the share of occupations amenable to remote working in OECD regions
based on the task performed by workers1. This work reveals that the potential for remote working is
1The method is detailed in Capacity for Remote Working can Affect Lockdown Costs Differently across Places (OECD,
2020[45]).
THE TERRITORIAL IMPACT OF COVID-19: MANAGING THE CRISIS ACROSS LEVELS OF GOVERNMENT © OECD 2020 15
unevenly distributed within countries. Urban areas a nine percentage point higher share of occupations
that can be performed remotely than rural areas (OECD, 2020[45]).
In most cases large cities and capital regions offer highest potential for remote working within countries
(Figure 9). Such a capacity might contribute to a territorial differentiation in resilience. On average, there
is a 15 percentage point difference between the region with the highest and lowest potential for remote
working in a given country. This difference reaches more than 20 percentage points in the Czech Republic,
France, Hungary, and the U.S., driven by comparatively high levels of potential remote working in their
capitals. It is important to note that these findings hold under the assumption that all workers – regardless
of location – have access to an efficient internet connection and to the necessary equipment. As a
consequence, differences across space arising from disparities connectivity and available equipment might
determine the extent to which the potential to telework translates into an actual opportunity.
Figure 9. The possibility to work remotely differs among and within countries
Share of jobs that can potentially be performed remotely (%), 2018, NUTS-1 or NUTS-2 (TL2) regions
Minimum National Average Maximum
LUX
GBR North East London
SWE Norra Mellansverige Stockholm
CHE Ostschweiz Zurich
NLD
ISL
DNK Nordjylland Hovedstaden
FRA Basse-Normandie Ile de France
FIN Pohjois-Suomi Helsinki-Uusimaa
NOR Hedmark og Oppland Oslo og Akershus
BEL West-Vlaanderen Brabant Wallon
LTU Lietuvos regionas Sostines regionas
EST
IRL Northern and Western Eastern and Midland
GRC Sterea Ellada Attica
DEU Chemnitz Hamburg
AUT Burgenland Wien
LVA
PRT Alentejo Lisboa
OECD25
HRV Jadranska Hrvatska Kontinentalna Hrvatska
ITA Basilicata Lazio
USA Mississippi District of Columbia
CZE Northwest Prague
HUN Kozep-Dunantul Budapest
ESP Islas Baleares Comunidad de Madrid
ROU Vest Bucuresti-Ilfov
SVK Western Slovakia Bratislava
TUR Van Istanbul
10% 20% 30% 40% 50% 60% 70%
Note: The number of jobs in each country or region that can be carried out remotely as the percentage of total jobs. Countries are ranked in
descending order by the share of jobs in total employment that can be done remotely at the national level. Regions correspond to NUTS-1 or
NUTS-2 regions depending on data availability. Outside European countries, regions correspond to Territorial Level 2 regions (TL2), according
to the OECD Territorial Grid.
Source: (OECD, 2020[45])
A strong and asymmetric fiscal impact on subnational governments
The impact of the COVID-19 crisis and related policy responses (e.g. public health measures, lockdowns,
emergency economic and social measures) on subnational government finance is significant. A June-July
THE TERRITORIAL IMPACT OF COVID-19: MANAGING THE CRISIS ACROSS LEVELS OF GOVERNMENT © OECD 202016
2020, a survey jointly conducted by the OECD and the European Committee of the Regions (CoR) with
300 representatives of regional and local governments in 24 countries of the European Union (CoR-OECD,
2020[46])indicates that in the short and medium terms most subnational governments expect the socio-
economic crisis linked to COVID-19 to have a negative impact on their finances, with a dangerous "scissors
effect" of rising expenditure and falling revenues. Beyond the European Union, other surveys report the
same negative effects of COVID19 on subnational finance. For example, the US National League reports
a severe and long-lasting impact on US cities with a loss of own-source revenue reaching 21.6% in 2020
(US National League of Cities,, 2020[47]).
The impact of COVID-19 on subnational finance is differentiated among countries, among levels of
government, among regions and among municipalities. The varying effects on subnational finance depend
on five main factors, all of which need to be taken into account to analyse and compare the fiscal impact
of COVID-19 on regions and municipalities:
1. the degree of decentralisation particularly the assignment of spending responsibilities as the role
of regions and cities in managing the crisis can vary depending on the scope of their
responsibilities;
2. the characteristics of subnational government revenues, in particular their degree of sensitivity to
economic fluctuations;
3. “fiscal flexibility” i.e. the ability of subnational governments to absorb exceptional stress, their
capacity to adjust their expenditure and revenues to urgent needs;
4. the fiscal health or financial conditions i.e. the current budget balance and debt situation of a given
local government, the level of cash treasury and set-aside reserves;
5. the scope and efficiency of support policies from higher levels of government.
It is extremely difficult quantify the impact of the COVID-19 crisis on subnational finance as there are many
uncertainties surrounding its severity, duration, variability across territories, and the effectiveness of the
support mechanisms introduced by international, national and subnational public authorities. Moreover,
the new waves of infections and new lockdowns may continue to strongly affect subnational government
finances.
With new waves of infection, the evolution of the crisis reveals itself to be non-linear. Countries must
manage combined shocks and their cascading effects in parallel, as well as implement recovery plans.
Many countries have introduced expansionary fiscal measures. Withdrawing them too quickly and
introducing tight fiscal consolidation measures is risky as it could result in public investment becoming an
adjustment variable. This happened after 2010, leading to a strong and persistent drop in public investment
and hampering growth in many in many OECD countries. The effects of this “systemic” crisis on
subnational finance occur at two levels: on subnational government “stocks” (assets and liabilities) and on
“flows” i.e. on subnational government expenditure, revenues and access to new borrowing (Figure 10).
THE TERRITORIAL IMPACT OF COVID-19: MANAGING THE CRISIS ACROSS LEVELS OF GOVERNMENT © OECD 2020 17
Figure 10. The cascading effects of the COVID-19 crisis on subnational government finance
Impacts on subnational government Impacts on subnational government budget
assets and liabilities
Revenue Expenditure
Grants and subsidies (operating and Current expenditure:
capital) Social expenditure (benefits
Tax revenues: and social services)
Shared taxes: PIT, CIT, VAT, Staff costs
Financial assets excises Purchase of goods and
Deposits and investments Own-source taxes: local PIT, services (intermediate
Sshare in local public local business tax, property- consumption)
companies, related taxes, sales tax, Subsidies to households,
Loans, etc. consumption taxes, tourist tax, businesses and NGOs
energy tax, vehicle tax, etc.) Financial charges
Non financial assets User charges and fees paid for local Capital expenditure:
Value of land and public services
Capital transfers / subsidies
properties, subsoil Revenues from financial and physical
Direct investment in social
assets: interests, dividends, royalties,
Debt stock etc.
and economic infrastructures
Access to new borrowing
Source: Authors’ elaboration
The impact on subnational government assets and liabilities
The effects on stocks are on the assets owned by subnational governments and on their liabilities. Physical
or financial assets and liabilities will likely be affected but this will depend on a variety of factors, such as
the evolution of real estate prices, insurance reserves, pension funds, local company values, etc. For
example, in the US, the crisis and the stock market collapse have exposed the fragility of public pension
systems, exacerbating the solvency crisis of many pension systems and jeopardising the future retirement
benefits of state and local public-sector workers. Public pension plans closed in fiscal year 2020 with
virtually no change in their average funded ratio despite the high volatility in asset prices in the first half of
the year. However, decreasing state and local governments revenues will hamper their ability to make their
required pension contributions in the near term (SLGE, 2020[48]).
Local public companies are also exposed to the COVID-19 crisis. Some categories suffered from the
cessation or slowdown of activity, particularly in the tourism, culture, leisure and transport sectors.
Business failures and threats to capitalisation and equity affect subnational governments as shareholders
(FEPL, 2020[49]).
Subnational government budgets will continue to be strongly affected
Subnational governments face strong pressure on expenditure and reduced revenue, thus increasing
deficits and debt. While the crisis has already put short-term pressure on health and social expenditures
and on different categories of revenue, the strongest impact is expected in the medium term. National
governments, associations of local governments, and individual entities have started estimating the short
and medium term fiscal impact, in order to prepare and adjust budgets, and to design appropriate support
measures (Box 1). As already underlined, these estimates are still tenuous and need to be regularly
updated, given the context of uncertainty. COVID-19’s second wave adds to the uncertainty as new
confinement measures will again negatively affect subnational government finance. This second shock
may be stronger for those subnational governments that drained all their fiscal reserves to resist the first
shock; while they may still be under the effects of the previous shock.
THE TERRITORIAL IMPACT OF COVID-19: MANAGING THE CRISIS ACROSS LEVELS OF GOVERNMENT © OECD 202018
Box 1. First insights into COVID-19’s fiscal impact on subnational government
In Austria, the COVID-19 crisis is strongly affecting state and municipal budgets. A 7%-12%
drop in state tax revenues is forecasted. Behind this is a postponement of tax payments, which
will result in tax collection being delayed. At the same time, it is expected that all state
governments will be equally affected by the decrease as a result of Austria’s fiscal equalisation
system, which has a levelling effect across regions (S&P Global Ratings, 2020[50]). At the
municipal level, it is estimated that the crisis will cost up to EUR 2 billion in 2020 because of
additional spending needs. This corresponds to a 5%-11% loss in revenue compared to 2019
(Wiener Zeitung, 2020[51]). Contributing to this is an expected 10% decrease in the municipal
share of federal taxes (sales tax, wage tax, corporate tax), and a 10% and 12% drop in
municipal tax revenue (local and tourist tax, fees from services such as childcare, etc.).
In Canada, municipalities may have lost between CAD 10 billion and CAD 15 billion in revenue
over the first three quarters of 2020 and unanticipated costs including public safety measures
and support for vulnerable populations (Federation of Canadian Municipalities, 2020[52]).
Estimates show that provincial governments may have a revenue shortfall of CAD 35 billion in
2020/21 compared to 2019/20 (representing CAD 1 000 per person) (Tombe T., 2020[53]).
In Finland, in April 2020, the Ministry of Finance estimated the cost and lost revenue effects of
COVID-19 to municipalities to be between EUR 1.6 billion and EUR 2 billion for 2020 i.e. around
4% of total municipal revenues (Ministry of Finance of Finland, 2020[54]). The economic effect
of COVID on municipalities will spread over several years. The negative effect of COVID-19
will amount to EUR 1.7 billion in 2021 according to the Association of Finnish Municipalities.
The support from the central government will amount to EUR 2 billion in 2020 and at least EUR
0.9 billion during 2021 to compensate for lost tax revenue and extra spending. By the end of
2020, it appears that COVID-19 will not reduce municipal tax revenues as sharply as was
predicted in the spring. The relatively good development of municipal tax revenues is partly due
to the fact that the state increased the share of municipal corporate tax in 2020 and 2021 as
one of its first support measures, particularly benefiting the largest cities.
In France, according to the Cazeneuve report \, at the end of July 2020, net lost revenue among
subnational governments could reach EUR 5 billion in 2020 (i.e. 2.4% of subnational operating
revenues) while net additional spending would reach EUR 2.2 billion in 2020 (Rapport
Cazeneuve, 2020[55]). Among revenues, tax revenues will be the most affected (70% of revenue
lost), the other being user charges and fees. Among subnational governments, the loss in
revenues will be larger in municipalities (46% of subnational government net losses), followed
by départements (36%) and regions (18%). Net revenue loss accounts for around 2% of
municipal operating revenues but 2.7% of départements operating revenues and 3.1% of
regional operating revenues. Tax revenues most impacted are the tax on real estate
transactions (DMTO), the tax on business value-added (CVAE), the tax on transport, the value-
added tax (VAT, though this will be limited thanks to a guarantee mechanism) and the tax on
energy consumption (TICPE).
In Germany, many state governments will see a sharp deterioration in their budgetary
performance in 2020, given falling revenues and rising expenditure. Behind this are packages
adopted by the regions to support local economies and the wish to maintain, and even increase,
public investment. It is expected that most states will revert to debt financing to cover their
budget deficits, increasing their borrowing needs (S&P Global Ratings, 2020[50]). Data
published by the Federal Ministry of Finance in May 2020 indicated a loss of tax revenue of
about 11% for the Lander and 15% for the municipalities compared to estimates made in
THE TERRITORIAL IMPACT OF COVID-19: MANAGING THE CRISIS ACROSS LEVELS OF GOVERNMENT © OECD 2020 19
November 2019. The local level is especially affected by a 25% drop in local business tax
receipts, a tax that represents 44% of municipal tax revenues. According to the Association of
German municipalities, the municipal share of income tax will also fall by 7.4% but transfers
from the state governments have increased by 20%. Overall, the funding gap between income
and expenditure of municipalities is estimated at EUR 10 billion in 2021, depending on the
measures that are taken to mitigate the decrease of municipal revenue in 2021 and 2022
(Association des Régions de France, 2020[56]),
In Iceland, a report released in August 2020 estimates that municipal revenues will decrease
significantly in 2020 due to the COVID-19 crisis, with a total shortfall of over ISK 33 billion,
accounting for 8.5% of total municipal expenditure in 2019 (and 1.1% of GDP). Municipal tax
revenues, their largest single source of revenue, will shrink significantly. In general, the impact
of COVID-19 is the most significant in tourist areas, and in municipalities which assume the
most expenditure on social services and financial assistance sectors (Ministry of Transport and
Local Government, 2020[57])
In Italy, the Association of Italian Municipalities (ANCI) developed three scenarios for the loss
of municipal revenues due to COVID-19. A low risk scenario with a loss of revenue among
municipalities of about EUR 3.7 billion (down 9% compared to 2019). This is based on a
relatively rapid exit from the emergency beginning in May 2020, where the largest losses would
be concentrated on the sectors directly exposed to the crisis, with other sectors recovering
relatively quickly in 2020 or by 2021. A medium risk scenario, with an estimated municipal
revenue loss of about EUR 5.6 billion (a decrease of 14% from 2019). Finally, a high risk
scenario estimating a loss of EUR 8 billion (a drop of almost 21% over 2019). In this scenario,
COVID-19 triggers a major and long running national and international economic crisis that
causes recovery difficulties for all economic sectors (ANCI, 2020[58]). Regional governments
also face financial difficulties. Most of their expenditure is concentrated on health (85% on
average), which will increase. To this is added a drop in receipts from the regional tax on
productive output (IRAP), the regional surtax on the personal income tax and the regional tax
on vehicles.
In Japan, prefectural spending to contain the novel coronavirus, amounting USD 9.5 billion in
July 2020, has drained the reserve funds of most of Japan's prefectural governments by more
than half, limiting their financial resources to combat a second wave. According to an Asahi
Shimbun survey, all 47 regions had already used 58% of their reserves (Asahi Shimbun,
2020[59])
In Switzerland, individual cantons and cities may see noticeable differences in COVID-19’s
impact on their revenue and expenditures, depending on their economic structure and the
resilience of their tax base. Cantons and municipalities tax revenue could drop by an average
6%-8% year on year in 2020 if the country's GDP contracts by 6.5%, as currently forecast. The
drop will continue in 2021 as Switzerland's tax collection is spread out over several years.
Cantons’ health expenditure have significantly increased as they pay 55% of the invoiced cost
of in-patient health care treatment for their residents, and are in charge of hospitals and
implementing public health measures. Cantons have also started to support local economies.
The crisis will generate additional borrowing needs by around 20%. However, most Swiss
subnational government had balanced budgets before the crisis (S&P Global Ratings, 2020[60]).
In the UK, local government finance is facing a difficult future. Recent analysis estimate that
local councils face a 7.9% increase in expenditure of compared to pre-crisis expenditure in
2020, and a 5.1% decrease in their revenue. On the expenditure side, local councils face a
12% expenditure increase for housing and homelessness, 10% for adult social care, 10% on
finance and corporate services, and 9% in culture and leisure (Institute for Fiscal Studies,
THE TERRITORIAL IMPACT OF COVID-19: MANAGING THE CRISIS ACROSS LEVELS OF GOVERNMENT © OECD 202020
2020[61]). Income loss – council tax and business rates – account for 60% of projected income
losses and the losses from fees, charges and commercial income account for another 40%.
In the US, according to a recent study released in July 2020 by the Council of State
Governments, states face a combined estimated revenue shortfall of between USD 169 billion
and USD 253 billion in general fund receipts in fiscal years 2020 and 2021 as a result of the
COVID-19 pandemic and its economic impact. According to another estimates, personal
income taxes declined by 63%, sales taxes dropped 15.8% and corporate income taxes fell
63% (Urban Institute, 2020[62]). This revenue loss is only part of the “fiscal shock” that awaits
legislators as in 2021, Medicaid spending will increase by an estimated USD 29 billion ( (Council
of State Governments, 2020[63]).
At the local level, recent research estimates a drop in municipal revenue of 5.5% (USD
34.2 billion) under the less severe scenario and 9% (USD 55.3 billion) under the more severe
scenario (Chernick, Copeland and Reschovsky, 2020[64]). This drop occurs through the decline
in own-source revenue but could also occur with the (expected) decline in transfers from states
to local governments, and changes in the federal government’s direct and indirect assistance
to city governments. These losses could lead to significant cuts in critical public safety services,
parks and recreation, and pay and jobs cuts. This could also affect infrastructure investment
(US National League of Cities,, 2020[47]).
All subnational government transactions are likely to be highly affected by the crisis in the short and
medium terms. A detailed analysis of the expected impact on expenditure, revenue, debt management
and access to new borrowing permits identifying their contribution to changes in subnational government
finance (Figure 11).
Overall, surveyed regions and municipalities in the European Union expect the crisis to have a slightly
larger impact on revenue than on expenditure. Large municipalities expect a larger impact: about two third
of respondents from cities of populations above 250 000 inhabitants forecast the impact to be highly
negative, against 41% where the population is below 10 000 inhabitants ( (OECD-CoR, 2020[65]).
Figure 11. Impact on subnational finances, by transaction
70%
Expenditure
Revenue
60% Debt management
Access to borrowing
50%
40%
30%
20%
10%
0%
High negative Moderate negative Low negative No negative impact Don't know or no
impact impact impact answer
Source: (OECD-CoR, 2020[65])
THE TERRITORIAL IMPACT OF COVID-19: MANAGING THE CRISIS ACROSS LEVELS OF GOVERNMENT © OECD 2020You can also read