The Parish of Wootton Bridge Isle of Wight Housing Needs Assessment
←
→
Page content transcription
If your browser does not render page correctly, please read the page content below
The Parish of Wootton Bridge

                                             Isle of Wight

                            Housing Needs Assessment

                                                 For

                         Wootton Bridge Parish Council

                                             Final Report

                                             December 2018

Main Contact:         Chris Broughton
Email:                chris.broughton@arc4.co.uk
Telephone:            0800 612 9133
Website:              www.arc4.co.uk

© 2018 arc4 Limited (Company No. 06205180)
Wootton Bridge Parish HNA Page | 2
Table of Contents
1. Introduction ........................................................................................................... 6
The study area ............................................................................................................... 6
2. Methodology ......................................................................................................... 7
3. The parish profile ................................................................................................... 8
Key findings from the parish profile ............................................................................ 14
4. House prices, affordability and market appraisal...................................................15
House prices ................................................................................................................ 15
The affordability of market housing ............................................................................ 15
Evidence from Estate and Letting Agents ...................................................................18
Key findings arising from the analysis ......................................................................... 19
5. The household survey and market housing requirements .....................................20
Introduction ................................................................................................................ 20
Respondent general views on housing needed .......................................................... 20
Older person’s preferences ......................................................................................... 22
Households coming to live in the parish ..................................................................... 23
Existing households: future housing requirements .................................................... 24
Newly forming households ......................................................................................... 27
Supply and demand for market housing ..................................................................... 28
Low cost and affordable home ownership options ..................................................... 31
Key Findings arising from the analysis ........................................................................ 33
6. The need for affordable housing ...........................................................................35
Introduction ................................................................................................................ 35
Stage 1: Current need .................................................................................................37
Stage 2: Future need ..................................................................................................38
Stage 3: Affordable housing supply ............................................................................. 38
Stage 4: Estimate of annual housing need .................................................................40
Key Findings arising from the analysis ........................................................................ 41
7. Summary of findings and conclusion .....................................................................42
Appendix A: profile data .............................................................................................44
List of Figures
Figure 1 Number of bedrooms.................................................................................. 9
Figure 2 House type ................................................................................................. 9
Figure 3 Tenure (all households)............................................................................... 9
Figure 4 Island population projections...................................................................... 9
December 2018Wootton Bridge Parish HNA Page | 3
Figure 5 House tenure by number of bedrooms (parish only) ..................................10
Figure 6 House type by tenure (parish only) ............................................................11
Figure 7 Tenure (HRP 65 years or older) ..................................................................11
Figure 8 Population age structure ............................................................................12
Figure 9 Household composition .............................................................................13
Figure 10 Occupancy rating by tenure (parish only) ...................................................14
Figure 11 New and existing household annual income profiles compared .................17
List of Tables
Table 1 Parish house price percentiles....................................................................15
Table 2 Household income (existing households) ...................................................15
Table 3 Household income (newly forming)...........................................................16
Table 4 Household income required .......................................................................17
Table 5 Price per calendar month 2017 (£) .............................................................18
Table 6 Income required 2017 (£) ...........................................................................18
Table 7 Q15: respondent priorities for household groups - tenure..........................20
Table 8 Q15: respondent priorities for household groups - by reason for moving
home 21
Table 9 Q16: Which broad house types would you consider a priority for future
house building in the parish? ............................................................................................21
Table 10 Q16: Which house types would you consider a priority for future house
building in the parish? ......................................................................................................22
Table 11 Q17: Please indicate if you agree or disagree with the following statements
22
Table 12 Q11b: Older person’s future housing preferences ......................................23
Table 13 Q25: The main reason you moved home in the last 5 years? ......................24
Table 14 Q27 main reason why household felt unable to move home in the last 5
years 25
Table 15 Q29: The main reason you are seeking to move home in the next 5 years? 26
Table 16 Q36: Where would you like your next home to be? ...................................27
Table 17 Q44b: What is the main reason they are unable to move? .........................27
Table 18 Q53: Newly forming household’s location preference ................................28
Table 19 Preferred buying option (multiple choice) ..................................................28
Table 20 Summary of housing requirements for those seeking home ownership
housing over the next 5 years ...........................................................................................30
December 2018Wootton Bridge Parish HNA Page | 4
Table 21 Cost of low cost home ownership options ..................................................32
Table 22 Needs Assessment Summary .....................................................................36
Table 23 Summary of current housing need in study area ........................................37
Table 24 Net affordable housing requirements ........................................................41
Table A1 Number of bedrooms.................................................................................44
Table A2 House type ................................................................................................44
Table A3 Tenure .......................................................................................................44
Table A5 Accommodation type by number of bedrooms (Wootton Bridge parish only)
45
Table A6 Accommodation type by tenure (Wootton Bridge parish only) ...................46
Table A7 Tenure: HRP aged 65 or over ......................................................................46
Table A8 Population age structure ............................................................................46
Table A9 Household composition .............................................................................47
Table A10 Occupancy rating by tenure (Wootton Bridge parish only) .........................47
List of Maps
Map 1 Parish of Wootton Bridge ....................................................................................... 6
December 2018Wootton Bridge Parish HNA Page | 5 Please note that in this report some of the tables include rounded figures. This can result in some column or row totals not adding up to 100 or to the anticipated row or column ‘total’ due to the use of rounded decimal figures. We include this description here as it covers all tables and associated textual commentary included. If tables or figures are to be used in-house then we recommend the addition of a similarly worded statement being included as a note to each table used. This report takes into account the particular instructions and requirements of our client. It is not intended for and should not be relied upon by any third party and no responsibility is undertaken to any third party. arc4 Limited accepts no responsibility or liability for, and makes no representation or warranty with respect to, the accuracy or completeness of any third party information (including data) that is contained in this document. December 2018
Wootton Bridge Parish HNA Page | 6
1. Introduction
1.1 arc4 was commissioned by Wootton Bridge Parish Council to undertake a housing
needs assessment to renew the assessment undertaken 5 years ago.
The study area
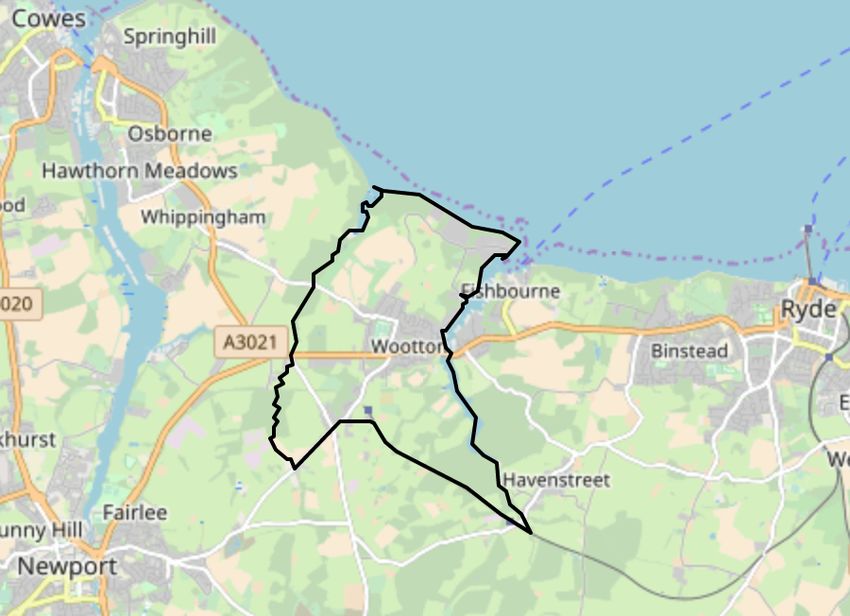
1.2 The following map shows the boundary of the civil parish of Wootton Bridge in
the context of nearby towns and road connections.
Map 1 Parish of Wootton Bridge
Source: ONS
December 2018Wootton Bridge Parish HNA Page | 7
2. Methodology
2.1 Several methods are used to estimate the quantity, size and type of housing
needed by local existing and newly forming households that are resident in the
parish or having a strong connection to it. Affordable housing estimates are based
upon information collected by means of a dedicated household survey. This
information is used in a standard model to assessing affordable housing need.
Market housing requirements are based on household survey information and
secondary data to inform an arc4 model that defines the mismatch between the
supply created by moving households and demand from those households who
plan to seek more suitable accommodation in the parish. The mismatch is
quantified and defined in terms of number of bedrooms, house type and tenure
needed.
2.2 Overall, information is brought together from 5 sources to form a long-term
comprehensive description of housing needs and requirements that is unlikely to
be met from existing supply. This information is viewed in a local context:
• official data from the census and other sources to profile housing and households
in the study area;
• population projections;
• evidence from a local estate and letting agent;
• evidence from the Land Registry, Zoopla and Rightmove; and
• a household survey.
2.3 All of this information is compared and analysed; trends and drivers of demand
are understood. The information provides essential context for modelling of
housing requirements based upon these data.
2.4 Survey data provides an incomplete picture of parish household intentions due to
households choosing not to complete survey questionnaires. Data weighting is
used to adjust for this.
2.5 Weighting is widely used in social research to adjust the results of a study to bring
them more in line with what is known about a population. For example, if survey
results contain 40% males and the population is known to contain 49% males,
weighting can be used to correct for this discrepancy. Weighting carries a risk
that the weighted data may not be representative of the sample. Error margins
are calculated and are stated in chapter 5.
December 2018Wootton Bridge Parish HNA Page | 8
3. The parish profile
3.1 The following information will help us to put the survey findings into context. Our
aim is to both understand the housing need of households and the extent to
which the housing stock is suited to the needs of local households.
3.2 The following figures profile the parish’s housing, population and households.
They are the proportions (percentages) of people or households compared to
Three Rivers District (the district) and England as a whole. All information is taken
from the Census 2011. The data from the Census is presented in the appendix.
3.3 Overall at Census Day 2011 3,477 people lived in the parish in 1,578 households.
That is an average of 2.2 people per household. That compares to an average of
2.3 for the Isle of Wight and 2.4 for England as a whole.
3.4 Figures 1-4 summarise the key parts of the profile:
• Figure 1 shows that the parish has smaller proportions of 1 and 2- bedroom
homes than the Isle of Wight as a whole, and similar proportions of 3-bedroom
properties. It has a larger proportion of 4-bedroom homes than the other
geographies.
• Figure 2 shows that around 56% of the housing stock consists of detached houses
and bungalows which is a much larger proportion than the other geographies.
20% of dwellings are semi-detached which is a much lower proportion that the
other geographies as are the proportion of terraced homes and flats.
• Regarding tenure, figure 3 shows that almost 77% of homes are owner-occupied.
This is a slightly larger proportion than the district and much larger than the
average for England. The proportion of social rented and private rented homes is
smaller than for other geographies.
3.5 The population projection for the island, figure 4, estimate change in the
population by age group over a 25-year period from 2016 to 2041. This is the
context within which the parish level findings must be set. Overall the population
of the island is estimated to grow by nearly 12,000 people over the 25 years, an
increase of 8.5%. However, this hides notable changes in the age profile of the
population. The number of people aged 65 years and over is set to increase by
19,000 over the period - a 50.5% increase. There is an estimated reduction in the
number of people in all other age groups. The 25-64 age group is projected to
reduce by 7% (approaching 5,000 people). Therefore, there will be a major loss of
people of working age resident on the island. The growth in older people exceeds
the reductions in other age groups.
December 2018Wootton Bridge Parish HNA Page | 9
The parish profile in 4 key figures
Figure 1 Number of bedrooms Figure 2 House type
45.0 60
40.0
50
35.0
30.0 40
Percent
Percent
25.0
30
20.0
15.0 20
10.0
5.0 10
0.0 0
s
s
s
s
m
s
m
m
m
m
m
d
.
g
c.
oo
d
ed
tc
oo
lin
oo
oo
oo
oo
he
et
ce
te
dr
ch
el
dr
dr
dr
ac
dr
dr
rra
n
be
Fla
dw
ta
va
be
be
be
be
be
et
Te
De
ra
i-d
1
2
3
4
5+
ed
No
Ca
m
ar
&
Se
Sh
5
Wootton Bridge Isle of Wight England Wootton Bridge Isle of Wight England
Figure 3 Tenure (all households) Figure 4 Island population projections
60 60,000
50 50,000
40
40,000
Percent
30
30,000
20
20,000
10
10,000
0
0
g r ted
Sh a m ight
d
e
wn ge
ip
ial cil
re
iva nte
fro rsh
Re ed o tga
n
n
tf
tr
r s cou
re
re
en
w d ou
e
or
16
19
22
25
28
31
34
37
40
te
m
20
20
20
20
20
20
20
20
20
oc
ne
in
ith
Pr
Liv
Ow Ow
ed
ar
he
Aged 0 to 15 Aged 16 to 24
nt
Ot
d
ne
Aged 25 to 49 Aged 50 to 64
Wootton Bridge Isle of Wight England Aged 65+
Source: Census 2011
December 2018Wootton Bridge Parish HNA Page | 10
3.6 Figure 5 is a cross tabulation of house tenure and number of bedrooms for the
parish only. It shows that 3-bedroom homes form the largest component of the
parish housing stock (40.3%) and 2-bedroom homes (30.7%). The 3-bedroom
home forms the largest type within the owner-occupied tenures. There is a small
proportion of 1-bedroom homes across the parish (8.7%) most of which in the
owner-occupied tenure. A greater proportion of social tenants live in 2-bedroom
homes and the greater proportion of private tenants live in 2 and 3-bedroom
homes.
Figure 5 House tenure by number of bedrooms (parish only)
45
40.3
40
35
30.7
30
Percentage
25
21.0 20.3
20
14.5 13.9
15
9.8 8.7 8.7
10
6.1 5.1 4.9 4.6
4.5
5 1.6 2.3 1.7
0.3 0.8 0.1
0
Owned outright Owned (mortgage) Social rented Private rented etc. Totals
1 bedroom 2 bedrooms 3 bedrooms 4 & 4+ bedrooms
Source: Census 2011. Proportions are of the parish housing stock total.
3.7 Figure 6 is a is a cross tabulation of house type and tenure for the parish only. It
shows that detached houses and bungalows is the main house type across the
parish (56.4%) and they are nearly all occupied by owner-occupiers.
December 2018Wootton Bridge Parish HNA Page | 11
Figure 6 House type by tenure (parish only)
60 56.4
50
40 35.6
Percentage
30
20.5
20 16.2
11.9
11.3
10 7.2 7.4
5.6
4.7 4.1 3.6
2.3 2.3 2.7 3.0 2.8
1.1 0.4 0.8
0
Owned outright Owned (mortgage) Social rented Private rented etc. Totals
Detached Semi-detached Terraced Flat etc.
Source: Census 2011. Proportions are of the parish total housing stock
3.8 Figure 7 is the tenure distribution of households with a household representative
person (HRP, Head of Household) aged 65 or over. 86.2% parish households of
such households are home owners. This is a similar proportion to the district but
higher than for England as a whole.
Figure 7 Tenure (HRP 65 years or older)
100
90 86.2
83.3
80 74.1
70
60
Percent
50
40
30
20
10.2
7.5 7.9 8.7
10 4.2 6.2 4.4
0.7 0.4 0.5 0.4 0.7 1.0 1.5 2.1
0
Owned Shared Rented from Other social Private rented Living rent free
ownership council rented
Parish District England
Source: Census 2011
3.9 The population age structure (figure 8) is a snapshot of the age of the population
as at census day 2011. It shows that the parish has a much larger proportion of
December 2018Wootton Bridge Parish HNA Page | 12
people aged 65 and over than the other geographies. The parish houses a smaller
proportion of people aged over 20-44 years than the other geographies. The age
groups with the highest proportion of residents of the parish is 45-59 (20%), 65-74
(15%) and 30-44 (14%). These groups form 50% of the parish population.
Figure 8 Population age structure
25
20
15
Percent
10
5
0
0-4 5 to 7 8 to 9 10 to 15 16 to 18 to 20 to 25 to 30 to 45 to 60 to 65 to 75 to 85 to 90 &
14 17 19 24 29 44 59 64 74 84 89 90+
Parish District England
Source: Census 2011
December 2018Wootton Bridge Parish HNA Page | 13
3.10 Figure 9 shows that the largest household groups resident in the parish are ‘one
person aged 65 and over’ and ‘family all aged 65 and over’. The first group forms a
much larger group in the parish than for other geographies, and the two groups
together make up 37% of all households. 68% of households were either over 65
or specified there were no children.
Figure 9 Household composition
25
20
15
percent
10
5
0
n
Ch d
Ch d
no 65+
t C ild
ts
r
de en
se or M ne en n ren
.
n
ep
de en
er
n
ar ll ag son +
p
s
p. hild
le
Ty e De end dep
he
pe
re
il
re ldre
il
5
re
Co Coh ing ersh -de
en
Ov
up
Al nde t Ch
ch
Ch
r
r
pe & 6
ne ent ent on-d
ild
ot
ild
ild
d
ld
Ty
c
rie rrie upl and
ud
-
n
l
co
on
i
i
p
hi
p.
ou nd
p.
ch
u p o ch
ch
o
en
ld
de
65
St
n
n
ip
a
ho
M d co 6 5
p.
p.
n
Pa ren
e
r
ed
1
65
n
n
1
de
1
m
de
se
de
ed
ng ple
e
ag
r
e
le
ild
ild
Ti
p
ed
d
l
e
2+
u p & 2+
r W Oth rent 2+
up
n
De
ith chil
he ull-
On
r
h
x C l l ch
u
pe
n
g
t
rH
pa
r
lc
co
o
2&
ll A
co d co
&
co
F
rs
2
a
l
al
he
ne
a
2
al
l
pe
rA
O
e
ily
Co ivil
rie
le
e
le
Ot
tin upl
Lo
pl
r
iti
t
m
s;
e
up
o
bi
r
Sa cou
On
pe
ab
pa
Fa
a
co
W
ha
Ot
co
M
pa
se
ne
g
er
d
g
e-
d
Co itin
rie
ld
o
Lo
m
r H Tw
Lo
ho
b
bi
ar
ar
ha
ha
M
M
he ith
ou
he
Ot
Ot
Wootton Bridge Isle of Wight England
Source: Census 2011
3.11 The occupancy rating shown in figure 10 provides a measure of whether a
household's accommodation is overcrowded or under-occupied. The rating is
shown for each broad tenure group at parish level.
3.12 The occupancy rating is based upon the number of rooms in a household's
accommodation. The ages of the household members and their relationships to
each other are used to derive the number of rooms/bedrooms they require,
based on a standard formula. The number of rooms required is subtracted from
the number of rooms in the household's accommodation to obtain the occupancy
rating. An occupancy rating of -1 implies that a household has one fewer room
than required, whereas +1 implies that they have one more room than the
standard requirement.
3.13 The figure shows that 48% of home owners in the parish have 2 or more spare
rooms indicating that they under-occupy their housing. Housing that is privately
owned or rented is open market housing and it is clear that some households
December 2018Wootton Bridge Parish HNA Page | 14
either buy or rent more space than they need, or their households have reduced
in size over time. Small amounts of overcrowding are present in both social
rented and private rented housing in the parish, although the proportion of 1
spare room in socially rented housing is high.
Figure 10 Occupancy rating by tenure (parish only)
70
60
50
40
30
20
10
0
Occupancy rating Occupancy rating Occupancy rating Occupancy rating
(bedrooms) of +2 or more (bedrooms) of +1 (bedrooms) of 0 (bedrooms) of -1 or less
Owned or shared ownership Social rented Private rented or living rent free
Source: Census 2011
Key findings from the parish profile
3.14 The findings from the above figures combine to show that housing in the parish
has disproportionate levels of detached homes and most homes are owner-
occupied. the majority of homes are 2 or 3-bedroom. although the parish has
greater proportions of 4-bedroom homes and smaller proportions of 1-bedroom
homes compared to the other geographies. A very high proportion of older
people are home owners, and there is a high proportion of under-occupancy. The
household composition analysis also shows that a large number of households are
over 65 or have no children. Official population projections show a large rise in
the proportion of older people over the 25 years from 2016, with a decrease in
other age groups.
3.15 We return to these findings in the conclusion.
December 2018Wootton Bridge Parish HNA Page | 15
4. House prices, affordability and market appraisal
House prices
4.1 The aim of this section is to explore the affordability of local market housing
whether for sale or rent. From the household survey we can estimate local
income levels. These two factors enable us to understand the affordability of
local house prices to local people. We also provide information obtained from
local estate agents to learn more about the supply of market housing locally and
understand if any gaps in the market exists.
4.2 The Land Registry provides basic information about every sale. Selling prices from
2017 have been analysed into percentiles and this information is presented in
table 1 below.
Table 1 Parish house price percentiles
Percentile £'s
75th 252,500
50th 207,500
25th 155,000
Source: Land Registry
The affordability of market housing
4.3 Household Survey data provides an income distribution for both existing
households and newly forming households. This is shown in Table 2.
Table 2 Household income (existing households)
Count % in group
Up to £5,200 annually 0 0.0
£5,200 to under £7,800 annually 0 0.0
£7,800 to under £10,400 annually 7 2.4
£10,400 to under £13,000 annually 26 9.0
£13,000 to under £15,600 annually 28 9.7
£15,600 to under £18,200 annually 23 8.0
£18,200 to under £20,800 annually 4 1.4
£20,800 to under £23,400 annually 25 8.7
£23,400 to under £26,000 annually 25 8.7
£26,000 to under £39,000 annually 71 24.6
£39,000 to under £49,400 annually 28 9.7
£49,400 or more annually 52 18.0
Total number of households in group 289
Source: household survey 2018
December 2018Wootton Bridge Parish HNA Page | 16
4.4 Lower quartile (25th percentile point) income for existing households is around
£16,872 (within the range of £15,600 to under £18,200 annually) with the median
at around £26,275 (within the range £26,000 to under £39,000).
4.5 The income of newly forming households is likely to be lower than existing
households. Table 3 summarises the income levels obtained from the household
survey.
Table 3 Household income (newly forming)
Count % in group
Up to £5,200 annually 15 3.2
£5,200 to under £7,800 annually 18 3.8
£7,800 to under £10,400 annually 38 8.0
£10,400 to under £13,000 annually 51 10.8
£13,000 to under £15,600 annually 26 5.5
£15,600 to under £18,200 annually 34 7.2
£18,200 to under £20,800 annually 94 19.8
£20,800 to under £23,400 annually 12 2.5
£23,400 to under £26,000 annually 36 7.6
£26,000 to under £39,000 annually 41 8.6
£39,000 to under £49,400 annually 49 10.3
£49,400 or more annually 60 12.7
Total number of households in group 474
Source: household survey 2018
4.6 The lower quartile for income in this instance is around £12,822 (within the
£10,400 to under £13,000 band) with the median at around £19,721 (within the
£18,200 to under £20,800 band).
4.7 The following chart compares the income distribution for existing and newly
forming households using household survey data. This shows that there are
greater proportions of newly forming households in the lower income brackets,
and the large percentage at £18,200 to under £20,800. It also shows the larger
proportions of existing households at the higher income groups.
December 2018Wootton Bridge Parish HNA Page | 17
Figure 11 New and existing household annual income profiles compared
30.0%
25.0%
20.0%
15.0%
10.0%
5.0%
0.0%
e
0
0
0
00
0
0
00
0
0
00
0
or
,00
,60
,20
,40
,00
,40
,80
,20
0,8
9,0
0,4
m
13
15
18
23
26
49
£7
£5
£2
£3
£1
or
r£
r£
r£
r£
r£
r£
to
er
00
r
r
er
de
de
de
de
de
de
de
de
nd
Up
nd
9,4
un
un
un
un
un
un
un
un
ou
ou
£4
to
to
to
to
to
to
to
to
0t
0t
00
00
00
00
00
00
00
00
,20
,80
0,4
3,0
5,6
8,2
0,8
3,4
6,0
9,0
£5
£7
£1
£1
£1
£1
£2
£2
£2
£3
Existing Newly forming
Linear (Existing) Linear (Newly forming)
4.8 Using the information in table 1, the following table estimates the deposit and
annual income required to purchase a dwelling at lower quartile (25th percentile)
and median (50th percentile) prices. We are advised that lenders may lend up to
3.5 times gross income for low risk households with a good credit rating, so we
have calculated spending power on this basis, assuming a 10% deposit.
Table 4 Household income required
Price Level
Lower quartile £ Median £
Purchase price 155,000 207,000
Minimum deposit (10%) 15,500 20,750
Mortgage required 139,500 186,750
Annual gross household Income required (factor 3.5) 39,900 53,400
Source: arc4
4.9 The information in table 4 illustrates the income and deposit required by first time
buyers and some first-time movers. Alongside table 3 it shows that just under a
quarter (23%) of newly forming households could afford lower quartile house
prices (those in the highest two income brackets). The figure is slightly higher for
December 2018Wootton Bridge Parish HNA Page | 18
existing home owners (nearly 28%), but they may also be able to offer a larger
deposit funded by equity in their present home reducing the size of the mortgage
required. Some first-time movers may have not accrued any equity due to market
conditions.
4.10 A similar exercise can be undertaken to assess the affordability of market rents.
The data in table 5 is obtained from Zoopla which recorded market rental
transactions in 2017.
Table 5 Price per calendar month 2017 (£)
Percentile 25 Median Percentile 75
693 750 849
Source: Zoopla
4.11 The government considers that rents at 25% of gross income can reasonably be
afforded by households. Table 6 shows the income required to service local rents
on this basis.
Table 6 Income required 2017 (£)
Percentile 25 Median Percentile 75
33,264 36,000 40,752
Source: arc4
4.12 Comparing tables 3 and 6 shows that less than a third of newly forming
households could afford a vacancy at lower quartile market rents.
Evidence from an Estate and Letting Agent and Rightmove
4.13 Rightmove publishes up to date information on local housing markets. According
to Rightmove as at December 2018:
• last year most property sales in Wootton Bridge involved detached properties
which sold for on average £342,624. Terraced properties sold for an average
price of £153,116, while semi-detached properties fetched £196,064;
• Wootton Bridge, with an overall average price of £244,990 was cheaper than
nearby Fishbourne (£263,370), Wootton (£261,458) and Binstead (£263,289);
and
• During the last year, sold prices in Wootton Bridge were 4% down on the
previous year and 7% down on 2015 when the average house price was
£263,090.
4.14 We interviewed an estate and letting agent based in Wootton Bridge. The agent
told us that the most significant gap in the market was housing affordable to first
time buyers. Income levels available to younger people meant that their spending
power was in the region of £120,000 which was demonstrably lower than entry
level prices in Wootton Bridge. First time movers were better place to afford local
December 2018Wootton Bridge Parish HNA Page | 19
prices as they would have more spending power. This is a combination of higher
income and in many cases, they could have put down a higher deposit having
accrued equity in their first home. The agent thought that the absence of first-
time buyers was restricting the market as conveyancing chains could not close.
4.15 The agent also told us that there was a shortage of bungalows in the parish due to
it being a popular retirement destination for islanders.
4.16 Regarding lettings, it was clear that local people unable to afford to buy locally,
had little opportunity to rent either due to a low proportion of homes in the
private rented sector.
Key findings arising from the analysis
4.17 The affordability of local housing is the most significant barrier to local newly
forming and established households on below average income.
4.18 Just under a quarter of newly forming households, those in the highest income
brackets, could afford lower quartile house prices.
4.19 Less clear is the affordability for existing home owners of housing for sale. Equity
may have been accrued in the existing home and hence a larger deposit may be
available, reducing the mortgage required. The proportion of this group able to
afford lower quartile house prices with a 10% mortgage is slightly higher than the
newly forming household group.
4.20 Agents told us that the critical gap in the local housing market was housing
affordable to first time buyers.
December 2018Wootton Bridge Parish HNA Page | 20
5. The household survey and market housing
requirements
Introduction
5.1 A household survey was conducted in October 2018. A questionnaire was sent to
every household in the parish and 300 responses were received. 1,740 were
dispatched resulting in a 17.2% response rate and a ± 5.1% sampling error. There
was an option to complete the survey online if it was preferred.
5.2 This chapter reports the main outputs of the survey to inform the need for
additional market housing and further information about local households -
especially those that are proposing to move home or newly forming households
seeking their first home.
5.3 As explained in chapter 2, the survey findings are presented as weighted data.
Survey responses have been up-scaled to represent the parish household
population as a whole.
Respondent general views on housing needed
5.4 Tables 7 and 8 record respondent views about groups of people that should be
prioritised should additional housebuilding occur in the parish. All households were
invited to respond. Respondents could indicate more than one preference.
Percentages sum to 100 to show proportions of the options for each priority group.
5.5 In table 7 it is clear that the group with most support as a high priority was ‘first
time buyers’, closely followed by ‘affordable housing for low income households’.
The group that mostly attracted no priority was those ‘seeking private landlord
rentals’.
Table 7 Q15: respondent priorities for household groups - tenure
No Some High No Some High
priority priority priority priority priority priority
Number Percent
First time buyers 184 524 701 11.9 24.8 41.0
People seeking private landlord rentals 650 517 120 42.1 24.4 7.0
Affordable housing for low income
287 425 661 18.6 20.1 38.7
households
People seeking shared ownership 422 651 227 27.3 30.8 13.3
Total 1,543 2,117 1,709 100.0 100.0 100.0
Source: household survey 2018
5.6 Regarding table 8, the group that had most support was ‘sheltered housing for
older/disabled people’ followed by ‘older people that want to downsize’ and
December 2018Wootton Bridge Parish HNA Page | 21
‘people providing care or support for village residents’. The largest no priority group
was ‘people seeking to commission or build their own home’ (‘self-builders’).
Table 8 Q15: respondent priorities for household groups - by reason for moving home
No Some High No Some High
priority priority priority priority priority priority
Number Percent
Elderly downsizers 394 559 436 18.4 19.3 25.5
Family up-sizers 414 670 255 19.3 23.1 14.9
Sheltered housing for older/
230 610 519 10.7 21.1 30.3
disabled people
Self-builders 861 343 116 40.2 11.8 6.8
People providing care and support 241 715 385 11.3 24.7 22.5
Total 2,140 2,897 1,711 100.0 100.0 100.0
Source: household survey 2018
5.7 Table 9 shows that the highest priority for future homes was considered to be in
the broad house type group of ‘small family homes’ followed by ‘small homes for
singles and couples’. Many respondents felt that larger family homes should not
be a priority.
Table 9 Q16: Which broad house types would you consider a priority for future house
building in the parish?
No Some High No Some High
priority priority priority priority priority priority
Number Percent
Small homes for singles and couples 223 607 501 20.9 37.5 38.6
Small family homes 167 577 683 15.7 35.7 52.6
Larger family homes 675 434 114 63.4 26.8 8.8
Total 1,065 1,618 12,98 100.0 100.0 100.0
Source: household survey 2018
December 2018Wootton Bridge Parish HNA Page | 22
5.8 Breaking this down to actual house type, Table 10 shows that the highest priority
was for ‘bungalows’ with the lowest priorities being for ‘housing for seasonal
tourist use’ and ‘town houses’.
Table 10 Q16: Which house types would you consider a priority for future house building
in the parish?
No Some High No Some High
priority priority priority priority priority priority
Number Percent
Detached homes 575 580 107 13.6 16.9 8.5
Semi-detached homes 272 838 179 6.4 24.4 14.2
Bungalows 384 546 397 9.1 15.9 31.4
Terraced homes 509 562 207 12.0 16.3 16.4
Flats or apartments 582 420 275 13.7 12.2 21.7
Town Houses 823 337 86 19.4 9.8 6.8
For seasonal tourist use 1,090 156 14 25.7 4.5 1.1
Total 4,235 3,439 1,265 100.0 100.0 100.0
Source: household survey 2018
5.9 Respondents were asked to agree or disagree with 3 statements. A clear majority
of respondents agreed that any new housing should be for local residents, although
there was also a (smaller) majority agreeing that additional homes are not needed
in the parish. This is shown in table 11.
Table 11 Q17: Please indicate if you agree or disagree with the following statements
No. No. % %
agree disagree agree disagree
New housing should only be built for local residents 931 558 62.5 37.5
New housing should be built for anyone that wants it 557 817 40.5 59.5
Additional homes are not needed in the parish 753 634 54.3 45.7
Source: household survey 2018
Older person’s preferences
5.10 Respondents aged 55 or over were asked to consider a range of options available
to them. They were asked to indicate a preference irrespective of whether they
had plans to move home in the next 5 years. The range of options was explored
with a multiple choice. The responses are given in table 12 below.
December 2018Wootton Bridge Parish HNA Page | 23
Table 12 Q11b: Older person’s future housing preferences
Preference No %
Continue to live in current home with support when needed (e.g. home visits,
‘call for help’ alarm) 427 61.4
Buying a more suitable property on the open market 138 19.9
Rent a more suitable property from a private landlord 3 0.4
Rent a more suitable property from a housing association 0 0.0
Sheltered Accommodation - Renting 11 1.6
Sheltered Accommodation - Buying 28 4.0
Sheltered Accommodation – Part Rent/Buy 0 0.0
Extra Care – Renting 10 1.4
Extra Care – Buying 19 2.7
Extra Care - Part Rent/Buy 0 0.0
Residential care home 8 1.2
Co-housing. Own home in small community sharing facilities (e.g. laundry) and
activities 39 5.6
Go to live with children or other relatives/friends 8 1.2
Other 4 0.6
Total 695 100
Source: household survey.
Households coming to live in the parish
5.11 Respondents were asked about their housing history. The reasons why they
moved to the parish are of particular interest and are shown in table 13. The first
12 rows can be said to be housing need reasons. The remainder are aspirational
reasons. The most frequently cited housing need reason was being unable to
afford the existing house, followed by the existing house/garden being too big.
December 2018Wootton Bridge Parish HNA Page | 24
Table 13 Q25: The main reason you moved home in the last 5 years?
Count %
Forced to move 6 1.3
Was living in temporary accommodation 0 0.0
Family was overcrowded 0 0.0
Was sharing with family or friends and was seeking a place of my/our own 14 3.0
Could not manage existing house - could not afford 18 3.8
Could not manage existing house - could not manage the stairs 4 0.8
Could not manage existing house - house/garden too big 15 3.2
Health problems and/or needed housing suitable for older/disabled person 8 1.7
House was in severe disrepair 0 0.0
Accommodation lacked bathroom/kitchen/toilet 0 0.0
Accommodation had shared bathroom/kitchen/toilet with another household 0 0.0
Was suffering harassment, threat of harassment or domestic abuse 0 0.0
Wanted a nicer house 75 15.9
Wanted to live in a nicer area 41 8.7
Wanted a garden or bigger garden 7 1.5
Wanted off street parking or a garage 4 0.8
Wanted to live in a different school catchment area 7 1.5
Wanted to live closer to family or friends 98 20.7
To reduce journey time or distance to work 4 0.8
Needed to re-locate for employment 32 6.8
Wanted to move away from bad neighbours 7 1.5
Wanted to live closer to shops or doctors or other services 24 5.1
Other reason 109 23.0
Weighted Base 473 100
Actual Base 76 -
Source: household survey 2018
5.12 Of the aspirational reasons wanting to live closer to family or friends, followed by
wanting a nicer house had the highest response.
Existing households: future housing requirements
5.13 It is estimated that 140 households needed to move home but were unable to do
so. The reasons given are stated in table 14. Respondents were able to give more
than one reason if relevant. The most frequent response was ‘cannot afford a
more suitable home’. (The actual number of respondents to this question was low
at 13.)
December 2018Wootton Bridge Parish HNA Page | 25
Table 14 Q27 main reason why household felt unable to move home in the last 5 years
All responses
Total Total %
Cannot afford a more suitable home 76 54.3
I/we are in negative equity 11 7.9
Cannot find suitable property 21 15.0
Reluctant to leave school catchment area 21 15.0
Cannot leave because of place of work 21 15.0
Other reason 33 23.6
Weighted Base 140
Actual Base 13
Source: household survey 2018
5.14 Table 15 shows the main reason that households planning to move home gave for
doing so. The first 12 rows can be said to be housing need reasons whilst the
remainder are aspirational.
5.15 The most frequently given housing need reason was that the existing
house/garden was too big. The most frequent aspiration reasons were equally
wanting to relocate for employment and wanting a nicer house.
December 2018Wootton Bridge Parish HNA Page | 26
Table 15 Q29: The main reason you are seeking to move home in the next 5 years?
All responses
Total Total %
Forced to move 21 9.5
Living in temporary accommodation 3 1.4
Family is overcrowded 0 0.0
Sharing and seeking a place of my/our own 0 0.0
Cannot manage existing house - could not afford 21 9.5
Cannot manage existing house - cannot manage the stairs 0 0.0
Cannot manage existing house - house/garden too big 35 15.8
Health problems and/or needing housing suitable for older/disabled person 10 4.5
House is in severe disrepair 0 0.0
Accommodation lacks bathroom/kitchen/toilet 0 0.0
Accommodation had shared bathroom/kitchen/toilet with another
household 0 0.0
Suffering harassment, threat of harassment or domestic abuse 0 0.0
Want a nicer house 21 9.5
Want to live in a nicer area 4 1.8
Want a garden or bigger garden 0 0.0
Want off street parking or a garage 14 6.3
Want to live in a different school catchment area 0 0.0
Want to live closer to family or friends 12 5.4
To reduce journey time or distance to work 0 0.0
Need to re-locate for employment 21 9.5
Want to move away from bad neighbours 0 0.0
Want to live closer to shops or doctors or other services 0 0.0
Other reason 60 27.0
Weighted Base 222 100.0
Actual Base 30
Source: household survey 2018
5.16 Table 16 shows where respondents likely to move over the next 5 years would like
to more to. 77% of all respondents would like to move within the parish or would
prefer to do so if suitable accommodation they could afford were available.
December 2018Wootton Bridge Parish HNA Page | 27
Table 16 Q36: Where would you like your next home to be?
All reponses
Total Total %
In your present parish 122 37.8
I would prefer to live in my present parish if a suitable property that I could
afford was available 127 39.3
In a nearby parish 0 0.0
Elsewhere in your current district 11 3.4
Outside your current district 63 19.5
Total 323 100.0
Actual Base 44
Source: household survey 2018
Newly forming households
5.17 Respondents were asked whether anyone within the household was likely to
move out and form a new household over the next 5 years. The responses
showed that 354 new households were likely to form (weighted figure).
5.18 Table 17 shows reasons given by households who wished to move out but felt
that they were unable to do so. It was possible to give more than one reason.
Over 50% say that they cannot afford a suitable house.
Table 17 Q44b: What is the main reason they are unable to move?
Total Total %
Lack of suitable housing they can afford in the parish 60 26.1
Lack of suitable housing they can afford in other areas 58 25.2
Cannot afford moving costs 23 10.0
Cannot face the upheaval of moving home 8 3.5
Do not want to leave school catchment area 0 0.0
Unable to leave because of providing care and support for someone 7 3.0
Any other reason 74 32.2
Weighted Base 230 100.0
Actual Base 17
Source: household survey 2018
5.19 Table 18 shows that over 62% of newly forming households would prefer to
remain resident in the parish in their new home, while nearly 21% plan to leave
the parish.
December 2018Wootton Bridge Parish HNA Page | 28
Table 18 Q53: Newly forming household’s location preference
Total
Total
%
In your present parish 205 52.0
In your present parish, if suitable accommodation they could afford was available 40 10.2
In a nearby parish 41 10.4
Elsewhere in your current district 26 6.6
Outside your current district 82 20.8
Weighted Base 394 100.0
Actual Base 60
Source: household survey 2018
5.20 Newly forming households were asked to indicate if any of the following low-cost
purchase options were of interest. This was a multiple-choice question, so the
total is the number of responses not respondents and is shown in Table 19. These
are household aspirations and at this stage no assessment has been carried out as
to whether or not the aspiration could be afforded.
Table 19 Preferred buying option (multiple choice)
Total Total %
Shared ownership (part rent/part buy) 77 28.2
Discounted sale (purchase and re-sell below market value) 54 19.8
Help to buy ISA (to help save for a deposit) 10 3.7
Starter home (20%-30% discount for younger first-time buyers) 71 26.0
New-build ‘help to buy’ (reduced deposit via a 5-year equity loan) 61 22.3
Weighted Base 273 100.0
Actual Base 39
Source: household survey 2018
Supply and demand for market housing
5.21 This section uses survey findings to suggest the scale and mix of housing that
might be appropriate to meet market housing needs over the next 5 years. The
data presented here however should be considered in a wider context which is
considered in our concluding chapter 7.
December 2018Wootton Bridge Parish HNA Page | 29
5.22 The supply of resale market housing comes from entire households that told us
that they plan to move home over the next 5 years. We have analysed this supply
in terms of house type and number of bedrooms.
5.23 Demand for re-sale market housing comes from the above moving households
plus households that are likely to form over the next 5 years. We are unable to
estimate demand from households moving in from outside the survey area, so
this is likely to be an underestimate.
5.24 If we compare the profile of the supply by house type and number of bedrooms to
the demand profile, we can estimate the mismatch between supply and demand
profiles. This is the basis for our estimate of the additional housing that is
required in the parish if the housing stock is to be more in-step with the needs of
its households.
5.25 Table 20 shows an estimated demand for 275 and a supply of 194 homes over the
next 5 years. There is a further discrepancy in the size and type of property
required by the existing households and newly forming households wishing to find
their new home in the parish against those becoming available due to moving
households.
5.26 It is estimated that a net 81 additional homes are needed to meet local
requirements. The estimated shortages are as follows:
• 1 and 2-bedroom houses: 49;
• 3-bedroom houses: 5;
• 1 and 2-bedroom bungalows: 32; and
• 1 or 2-bedroom flats: 46.
5.27 There are estimated surpluses of 4-bedroom houses (10), 3-bedroom bungalows
(19) and 1 and 2-bedroom of unspecified type (22).
5.28 It was noted earlier that we are unable to estimate demand from households
moving in from outside the survey area. We have therefore looked in isolation at
households who moved into the area within the last year to give an indication of
what could be expected from this group.
5.29 Of the 104 households falling into this category, the largest proportion moved
into 1 and 2-bedroom bungalows, followed by 3-bedroom houses and 3-bedroom
bungalows. Only the latter is estimated as having an estimated surplus from the
previous calculations.
5.30 The implications of these requirements are considered in chapter 6.
December 2018Wootton Bridge Parish HNA Page | 30
Table 20 Summary of housing requirements for those seeking home ownership housing over the next 5 years
SUPPLY
1/2 bed. 3 bed. 4+ bed 1/2 bed. 3+ bed. 1/2 bed. 3+ bed. 1/2 bed. 3+ bed.
house house house bungalow bungalow flat flat other other total
Existing households moving within
18 54 16 4 8 0 0 21 0 121
the parish
Out-migrating households 7 4 29 0 26 0 0 7 0 73
Total supply 25 58 45 4 34 0 0 28 0 194
DEMAND
1/2 bed. 3 bed. 4+ bed. 1/2 bed. 3+ bed. 1/2 bed. 3+ bed. 1/2 bed. 3+ bed.
house house house bungalow bungalow flat flat other other total
Existing households moving within
3 28 7 24 11 32 0 0 0 105
the parish
Newly forming households seeking
71 35 28 12 4 14 0 6 0 170
housing within the parish
Total demand 74 63 35 36 15 46 0 6 0 275
Net shortfall (-)/surplus
1/2 bed. 3 bed. 4+ bed. 1/2 bed. 3+ bed. 1/2 bed. 3+ bed. 1/2 bed. 3+ bed.
house house house bungalow bungalow flat flat other other total
Net requirement -49 -5 10 -32 19 -46 0 22 0 -81
Source: household survey 2018
December 2018Wootton Bridge Parish HNA Page | 31
Low cost and affordable home ownership options
5.31 Younger newly forming households tend to be at a disadvantage when seeking
home ownership options due to relatively low incomes as they begin their
working lives and limited ability to save for a deposit. New households forming as
a result of relationship breakdown may also be at a disadvantage if there is now a
single income and shared savings with a former partner. Low cost home
ownership products could therefore be particular important to these groups.
5.32 Table 21 illustrates the relative cost of products aimed at assisting households to
get onto the property ladder. This uses the income data and house prices stated
in Chapter 4 and shows the affordability of each product.
5.33 The most affordable of the low-cost options is a Starter Home with a 30%
discount. A house with the price equivalent to the 25th percentile of local market
prices would require a household income of £21,700. The next most affordable is
25% Shared Ownership requiring a household income of £24, 745. According to
table 3, these are both over the median income for parish and would be
affordable to around 29% and 26.5% of newly forming households respectively.
December 2018Wootton Bridge Parish HNA Page | 32 Table 21 Cost of low cost home ownership options Starter Home (20% discount) Costings/income required Full price (based on 25th percentile) £155,000 Starter home price (20% off full price) £124,000 10% deposit on equity share £12,400 Mortgaged amount £111,600 Income required for mortgage £24,800 Starter Home (30% discount) Costings/income required Full price (based on 25th percentile) £155,000 Starter home price (30% off full price) £108,500 10% deposit on equity share £10,850 Mortgaged amount £97,650 Income required for mortgage £21,700 Shared ownership 50% Costings/income required Full price (based on 25th percentile) £155,000 Equity 50% £77,500 10% deposit on equity share £7,750 Mortgaged amount £69,750 Service Charge (monthly) £30 Rent (per month based on 2.75% on remaining equity pa) £178 Income required for mortgage £19,929 Income required for rent/service charge £9,965 TOTAL £29,894 Shared ownership 25% Costings/income required Full price (based on 25th percentile) £155,000 Equity 25% £38,750 5% deposit on equity share £1,938 Mortgaged amount £36,813 Service Charge (monthly) £30 Rent (per month based on 2.75% on remaining equity pa) £266 Income required for mortgage £10,518 Income required for rent/service charge £14,228 TOTAL £24,745 Help to buy Costings/income required Full price (based on 25th percentile) £155,000 Equity 75% £116,250 Loan 20% £31,000 Deposit 5% £7,750 Mortgaged amount £116,250 Income required for mortgage £25,833 Loan fee (1.75% in year 6) £543 December 2018
Wootton Bridge Parish HNA                                                                  Page | 33

          Key Findings arising from the analysis
   5.34       The main findings of the public consultation on priorities for new build housing in
              the area were:
          •   first time buyers;
          •   affordable housing for low income households; and
          •   sheltered housing for older/disabled people.
   5.35       The main broad house type that was considered a priority was small family
              homes. Alongside this, the highest priority for actual house type was bungalows.
   5.36       Nearly two thirds of respondents agreed that new housing should only be built for
              local residents, although just over half agreed with the statement that additional
              homes were not needed in the parish.
   5.37       When asked to consider a range of options available irrespective of whether they
              were considering moving, the response with the largest response was for
              continuing to live the current home with support when needed. This was
              followed, although not closely, by buying a more suitable property on the open
              market.
   5.38       When asked about the main reason for feeling unable to move home, new and
              existing households seeking more suitable housing gave not being able to afford a
              more suitable home.
   5.39       The most frequently given reason for seeking to move home in the next five years
              that respondents were unable to manage the existing house as it or the garden
              was too big. The main aspiration reason was the need to re-locate for
              employment.
   5.40       77% of households seeking to move were wishing to move within the parish, with
              62% of newly forming households preferring this option.
   5.41       It is estimated that a net 81 additional homes are needed to meet local
              requirements over a 5-year period.
   5.42       There is an estimated shortage of 132 dwellings as follows:
          •   1 and 2-bedroom houses: 49;
          •   3-bedroom houses: 5;
          •   1 and 2-bedroom bungalows: 32; and
          •   1 or 2-bedroom flats: 46.
   5.43       There is an estimated surplus of 51 other house types of dwellings: 4-bedroom
              houses (10), 3-bedroom bungalows (19) and 1 and 2-bedroom of unspecified type
              (22).

December 2018
Wootton Bridge Parish HNA Page | 34
5.44 The most affordable of the low-cost options is a Starter Home with a 30%
discount. This would require a household income of £21,700 at a price equivalent
to the 25th percentile of local market prices. This would be affordable to around
29% of newly forming households. When presented with the low-cost purchase
options, shared ownership was the type that newly forming households most
interested in.
December 2018Wootton Bridge Parish HNA Page | 35
6. The need for affordable housing
Introduction
6.1 Housing need is defined as the quantity of housing required for households who
are unable to access suitable housing without financial assistance. The 2018
household survey and secondary data provide a robust range of information to
quantify housing need in the parish.
6.2 In summary, the needs assessment model reviews in a step-wise process:
Stage 1: Current housing need;
Stage 2: Future housing need;
Stage 3: Affordable housing supply; and
Stage 4: Estimate of households in need and additional housing required.
6.3 Table 22 summarises the different steps taken in assessing housing need and
evidencing the extent to which there is a surplus or shortfall in affordable housing
in the parish. Modelling has been carried out using household survey data and
takes into account household type and property size requirements. Note that as
explained in chapter 1, data have been weighted to reflect the total number of
households in the study area.
6.4 This chapter continues with an overview of the data and analysis for each stage of
the needs assessment process.
December 2018You can also read