THE MULTICENTER EUROPEAN BIOLOGICAL VARIATION STUDY (EUBIVAS): A NEW GLANCE PROVIDED BY THE PRINCIPAL COMPONENT ANALYSIS (PCA), A MACHINE LEARNING ...
←
→
Page content transcription
If your browser does not render page correctly, please read the page content below
Clin Chem Lab Med 2021; aop

Anna Carobene*, Andrea Campagner, Christian Uccheddu, Giuseppe Banfi, Matteo Vidali
and Federico Cabitza

The multicenter European Biological Variation
Study (EuBIVAS): a new glance provided by the
Principal Component Analysis (PCA), a machine
learning unsupervised algorithms, based on the
basic metabolic panel linked measurands
https://doi.org/10.1515/cclm-2021-0599                                    Results: A clear clustering between males and females
Received May 19, 2021; accepted July 20, 2021;                            mean values has been identified, where the menopausal
published online August 2, 2021                                           females are closer to the males. Data interpretations for the
                                                                          three databases are similar. No significant differences for
Abstract
                                                                          both mean and CVPs values, for countries, alcohol, smok-
                                                                          ing habits, BMI and physical activity, have been found.
Objectives: The European Biological Variation Study
                                                                          Conclusions: The absence of meaningful differences
(EuBIVAS), which includes 91 healthy volunteers from five
                                                                          among countries confirms the EuBIVAS sample homoge-
European countries, estimated high-quality biological
                                                                          neity and that the obtained data are widely applicable to
variation (BV) data for several measurands. Previous
                                                                          deliver APS. Our data suggest that the use of PCA and the
EuBIVAS papers reported no significant differences among
                                                                          multivariate approach may be used to detect outliers,
laboratories/population; however, they were focused on
                                                                          although further studies are required.
specific set of measurands, without a comprehensive
general look. The aim of this paper is to evaluate the ho-                Keywords: biological variation; EuBIVAS; machine learning;
mogeneity of EuBIVAS data considering multivariate in-                    preanalytical phase.
formation applying the Principal Component Analysis
(PCA), a machine learning unsupervised algorithm.
Methods: The EuBIVAS data for 13 basic metabolic panel
                                                                          Introduction
linked measurands (glucose, albumin, total protein, elec-
                                                                          Estimating Biological Variation (BV) has many applica-
trolytes, urea, total bilirubin, creatinine, phosphatase
                                                                          tions: it is used for the setting of the analytical perfor-
alkaline, aminotransferases), age, sex, menopause, body
                                                                          mance specification (APS) for both internal and external
mass index (BMI), country, alcohol, smoking habits, and
                                                                          quality control [1–3]; for the assessment of significance of
physical activity, have been used to generate three data-
                                                                          change in serial measurements in a subject (reference
bases developed using the traditional univariate and the
                                                                          change value; RCV); and for determining the number of
multivariate Elliptic Envelope approaches to detect out-
                                                                          samples needed to estimate the homeostatic setting point
liers, and different missing-value imputations. Two matrix
                                                                          [4, 5]. Moreover, BV estimates are used to assess the utility
of data for each database, reporting both mean values, and
                                                                          of conventional population-based reference intervals
“within-person BV” (CVP) values for any measurand/sub-
                                                                          through the use of the individuality index, and to derive
ject, were analyzed using PCA.
                                                                          personalized reference intervals, which can improve
                                                                          diagnostic accuracy and treatment appropriateness on a
*Corresponding author: Anna Carobene, Laboratory Medicine, IRCCS          more patient-centered level [6].
San Raffaele Scientific Institute, Via Olgettina 60, 20132 Milan, Italy,        The importance of BV estimates, the within-subject BV
Phone: +390226432850, E-mail: carobene.anna@hsr.it                        (CVI) and the between-subject BV (CVG), in the last years
Andrea Campagner, Christian Uccheddu and Federico Cabitza,                has been put forward through several activities carried out
University of Milano-Bicocca, Milan, Italy
                                                                          by the European Federation of Clinical Chemistry and
Giuseppe Banfi, IRCCS Istituto Ortopedico Galeazzi, Milan, Italy; and
Università Vita e Salute San Raffaele, Milan, Italy
                                                                          Laboratory Medicine (EFLM) [7].
Matteo Vidali, Fondazione IRCCS Ca’ Granda Ospedale Maggiore                   As an outcome of the first Strategic Conference of the
Policlinico, Milan, Italy                                                 EFLM held in Milan in November 2014, the EFLM Task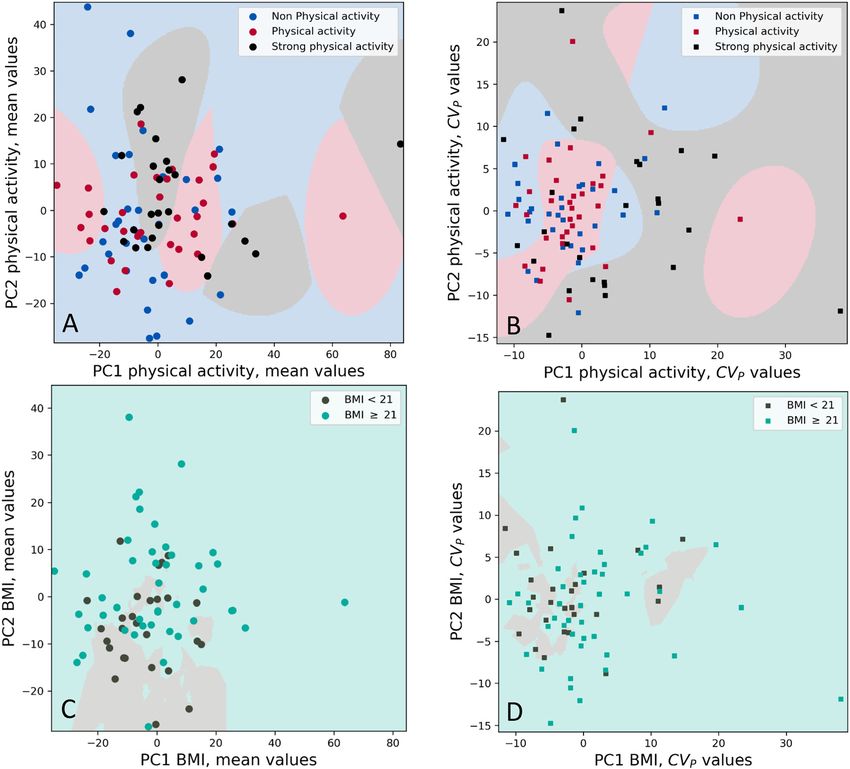
2        Carobene et al.: EuBIVAS: a machine learning approach on metabolic panel measurands

Force and Finish Group on BV database (TFG-BVD), was              include supervised and unsupervised approaches. In the
established with the objective to appraise the quality of         former case, labelled data (data containing both the input
BV data that are publicly available [8]. Furthermore,             and the output variables) are given to the learning algorithm
responding to the need for reliable BV estimates delivered        to automate classification (predicting a categorical variable)
from big high-quality studies [9, 10], the EFLM WG-BV has         or regression (predicting a continuous variable) tasks. By
designed and implemented the European Biological Vari-            contrast, in the unsupervised case, only input data are given,
ation Study (EuBIVAS) [11, 12].                                   and the goal is to try to modelling the underlying structure or
     The design of a multicenter study, aimed at obtaining        distribution of the data, and to find unknown patterns.
reliable BV data, requires the involvement of many in-            Among unsupervised algorithms, Principal Component
dividuals and a large number of blood collections to pro-         Analysis (PCA) is one of the most widely used methods. In
vide adequate statistical power, as demonstrated by Røraas        short, PCA is a techniques for dimensionality reduction that is
et al. [13]. The EuBIVAS is a high-power study, which             an approach by which multidimensional data can be reduced
included 91 apparently healthy volunteers from 5 Euro-            into fewer, new dimensions that embed some information
pean countries, from which high-quality BV data, based on         from the original ones. In particular, PCA describes the
the newest generation of analytical methods, have been            standardized multidimensional data in terms of components
derived for a set of measurands [12, 14].                         that are linear combinations of the original variables preser-
     However, the multicenter project thus conceived posed        ving the variance of the original data. For these reasons, PCA
the risk of introducing factors impacting on the reliability      can also be applied to easily and meaningfully visualize high
and hence on the applicability of the obtained BV data.           dimensional data in case the first 2 o 3 principal components
Namely, the two most important aspects were: considering          are chosen, that is those that explain a maximal amount of
the enrolled population as homogeneous, even if coming            variance.
from different countries; and introducing a significant pre-           In any case, whether supervised or unsupervised, ac-
analytical variability, having performed the collections in       curate predictions by ML algorithms rely on data
several centres.                                                  completeness and quality [21], according to the principle
     To minimize these latter aspects, a very detailed pro-       commonly described as “garbage in, garbage out”.
tocol was prepared, agreed upon, and rigorously followed               In particular, the presence of outliers, or extreme
by each involved laboratory in all steps [14], by taking into     values, in a dataset may result in poor predictive modelling
account all the requirements of the EFLM checklist for BV         performance. However, identifying and removing outliers
studies [15, 16].                                                 can be a very challenging and time consuming task, even
     Previously published EuBIVAS papers [17–20] re-              with a good understanding of the structure of the data.
ported no significant differences in pre-analytical variables      Several strategies to detect outliers are available, including
or treatment between the different laboratories. However,         univariate and multivariate methods. With univariate
these previous works were focused on the analysis of              methods, each variable is considered independently, and a
specific set of measurands, without a comprehensive                value is labelled as an outlier when it is too far (according
general look that could take into consideration multi-            to some criteria) from a central tendency indicator. How-
variate information coming from a panel of several meas-          ever, these methods usually fail in detecting observations
urands, possibly together with some characteristics of the        that deviate from global behavior or from the pattern of the
population (i.e. lifestyle).                                      majority of data (with pattern here we indicate the rela-
     Machine learning (ML) is a methodological approach           tionship between multiple variables of the dataset) [22].
developed within the field of artificial intelligence (AI)             In this work, by applying PCA, we evaluated the
aimed at developing algorithms and models by which to             homogeneity of EuBIVAS data through a novel approach,
make classifications and predictions on the basis of large        with the goal of detecting previously unknown patterns or
amounts of data taken as examples to “learn” relevant             relationships between variables. Moreover, traditional
patterns and schemas. The essence and main novelty of ML          univariate approach to detect outliers was compared to the
methods is to infer new sets of rules or new algorithms from      multivariate approach. With this aim, the EuBIVAS meas-
data to perform complex cognitive tasks (like diagnosis or        urands included in the basic metabolic panel (BMP),
prognosis), without step-by-step instructions explicitly          glucose (Glu), calcium (Ca) [17], albumin (Alb), total pro-
given in advance by the programmer [21]. ML is an umbrella        tein (TP) [18], sodium (Na), potassium (K), chloride (Cl),
term to denote a large variety of statistical methods, which      urea, total bilirubin (TBil) [17], creatinine (Crea) [19],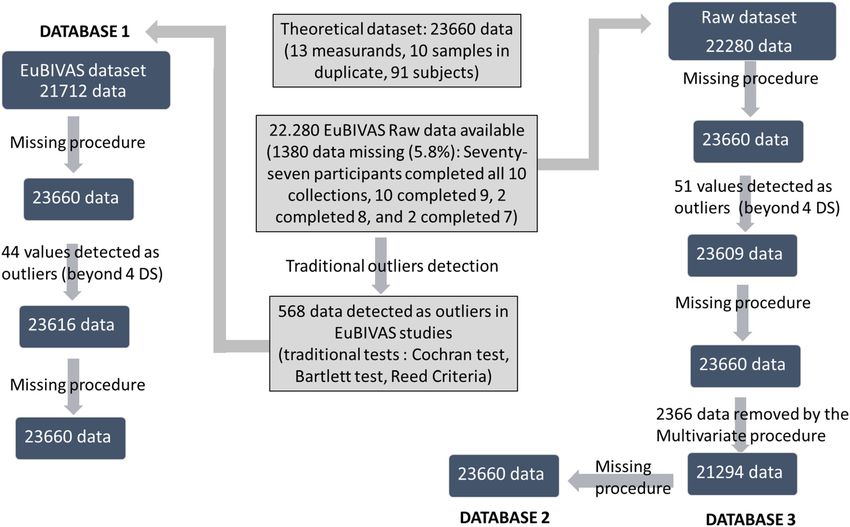
Carobene et al.: EuBIVAS: a machine learning approach on metabolic panel measurands                     3

phosphatase alkaline (ALP), aspartate aminotransferase                     The Netherlands; WG-BV project #001, 3452/AO/15 for PD Italy;
(AST), alanine aminotransferase (ALT) [20], and some                       2015-3/17 for Turkey; 2014/1988 for Norway).

characteristics of the population (alcohol intake, smoking
habits, physical activity, body mass index (BMI) [11, 23–25]               Sample collection and analytical methods
have been considered.
                                                                           Fasting serum samples were collected weekly, for 10 consecutive
                                                                           weeks (April–June 2015) on a set day (Tuesday to Friday), and at the
                                                                           same time (e.g., between 08:00 a.m. and 10:00 p.m. at each weekly
Materials and methods                                                      visit). Sample collection was performed by the same phlebotomist at
                                                                           most visits, further minimizing variation. All laboratories followed the
                                                                           same protocol for the pre-examination phase. Serum samples were
EuBIVAS population                                                         aliquoted and sent, frozen in dry ice, to the coordinating center (San
                                                                           Raffaele Hospital in Milan) and stored in a freezer at −80 °C until
The health status, the inclusion/exclusion criteria of the individuals     analysis (December 2017-January 2018) [11, 12].
enrolled in the EuBIVAS, and the used protocol have previously been              With the exception of Alb, for the other 12 measurands here
described in detail [11].                                                  considered (Glu, Ca, TP, Na, K, Cl, urea, Crea (enzymatic method),
      To briefly summarize, EuBIVAS involved 91 presumably healthy         ALP, AST, ALT, TBil), all measurements were performed with ADVIA
volunteers (53 females and 38 males; age range, 21–69 years) from 6        2400 Clinical Chemistry System (Siemens Healthineers), using
European laboratories (Italy-Milan, Italy-Padua, Norway, Spain, the        Siemens reagents, calibrators, and control materials, as previously
Netherlands, and Turkey). The participants completed an enrollment         described [17, 19, 20].
questionnaire to provide information about their lifestyle and pre-              Alb analyses were performed on the Roche Cobas c702 (Roche
sumed health status, which was further verified by a set of routine        Diagnostics) using Roche reagents, and calibrated using protein-
laboratory tests performed during each collection [11, 12].                specific Roche calibrators according to the manufacturer’s in-
      Particularly, subjects were excluded from participation if any of    structions [18]. All samples from the same participant were analyzed in
the following criteria were met:                                           duplicate within a single run. All analysis was performed at San Raf-
  (1) Known diabetes and prescribed oral or insulin therapy, or fasting    faele Hospital in Milan, Italy.
      serum glucose >7.0 mmol/L;
  (2) History of chronic liver or kidney disease;                          Databases
 (3) Dyslipidaemia;
 (4) Family history of thalassemia syndrome and other haemo-
                                                                           To investigate a ML approach to detect the outliers from the original
      globinopathies;
                                                                           EuBIVAS raw dataset, three different databases have been considered,
 (5) Results of examinations that clearly point to a severe chronic
                                                                           as described below and summarized in Figure 1.
      disease (cancer, cardiovascular or neurological) or acute
                                                                                The EuBIVAS dataset included 22,280 raw data values, instead of
      disease;
                                                                           the theoretical 23,660 (13 measurands, 10 samples in duplicate, 91
 (6) Known carrier state for hepatitis B virus (HBV), hepatitis C virus
                                                                           subjects): 5.8% of data were missing, since only 77 participants
      (HCV), and human immunodeficiency virus (HIV);
                                                                           completed all 10 collections; while 10 participants completed nine
 (7) History of being a hospital in-patient or otherwise seriously ill
                                                                           collections, two participants completed eight collections, and further
 (8) Blood donation in the previous 3 months;
                                                                           two participants completed seven collections [11, 12].
 (9) Female subjects who were pregnant, breastfeeding, or within1
      year after childbirth;
(10) Any other significant disease or disorder that, in the opinion of      Database 1: The original database, used to publish the BV estimates
      the investigator, could either put the subjects at risk because of   EuBIVAS based, was used as the reference database or database 1
      participation in the study or could influence the results of the      (DB1). DB1 consisted of 21, 712 results, obtained after the application of
      study [11].                                                          statistical tests for outlier detection (568 data values), as previously
                                                                           described in EuBIVAS publication [17–20].
     For each of the 91 subjects, the following characteristics have             As a first step, the missing data were imputed by means of the
been considered: age (years), sex (M/F), menopause (Yes/NO), body          missing procedure (see below “Missing data”), to obtain the total
mass index (BMI), country of origin, smoking habits (number of             theoretical amount of 23,660 data (91 subjects, 13 measurands, 10
cigarettes/day), physical activity (hours/week), alcohol intake            collections, two replicates). As a second step, the values beyond 4
(Units/day) (Table 1).                                                     standard deviations, for each measurand distribution (at least one
     The EuBIVAS was approved by the Institutional Ethical Review          replicate compared to the general distribution of all subjects), were
Board of San Raffaele Hospital (Milan, Italy; protocol number: WG-BV       discarded. Finally, the DB1 was imputed a second time using the
project #001, 50/INT 2014) in agreement with the World Medical As-         missing procedure.
sociation Declaration of Helsinki and by the Ethical Board/Regional
Ethics Committee for each center (protocol number: WG-BV project           Database 2: The original database of 22,280 EuBIVAS raw data values
#001, PI-1993. April 2015 for Spain; WG-BV project #001, 2014-26 for       was used as a starting point to obtain the database 2 (DB2). As a first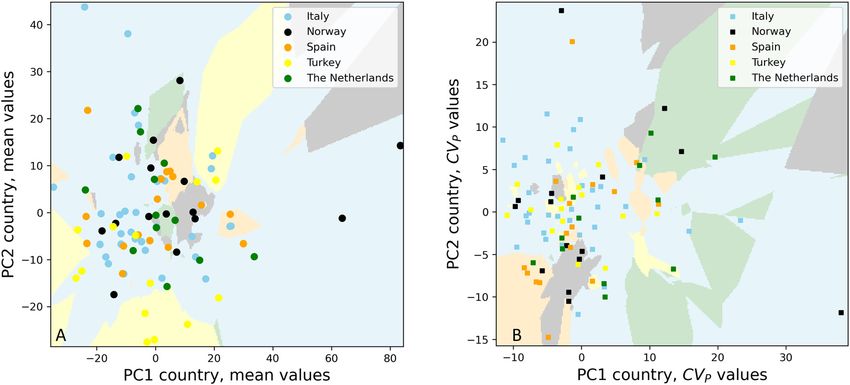
4
Table : Gender, number, age, body max index (BMI), smoking habits, alcohol intake, and physical activity done by men and women years enrolled by each center.
Men median age, Men median BMI, Physical activity Smoking habits Alcohol intakea
years (age range) kg/m (BMI range)
No physical cigarettes/ ≤ >
activity week week day day day U/ U/ U/day
day day
Italy – Milan Men (n=) (–) . (.–.)
( people) Women (–) . (.–.)
(n=)
Norway Men (n=) (–) . (.–.)
( people) Women . (.–.)
(n=)
Spain Men (n=) (–) . (.–.)
( people) Women . (.–.)
(n=)
Italy – Padua Men (n=) (–) . (.–.)
( people) Women .
(n=)
Turkey Men (n=) (–) . (.–.)
( people) Women / / / / / / / / / / /
Carobene et al.: EuBIVAS: a machine learning approach on metabolic panel measurands
(n=)
The Netherlands Men (n=) (–) . (.–.)
( people) Women (–) . (.–.)
(n=)
Total Men (n=) (–) . (.–.)
( people) Women (–) . (.–.)
(n=)
a
One alcohol unit (U) corresponds to mL, equivalent to g, of pure alcohol (https://www.drinkaware.co.uk/alcohol-facts/alcoholic-drinks-units/what-is-an-alcohol-unit/).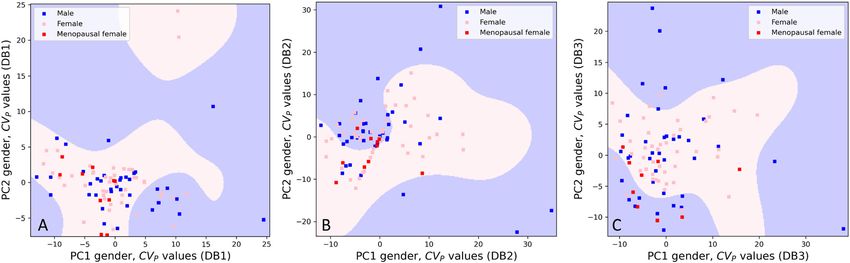
Carobene et al.: EuBIVAS: a machine learning approach on metabolic panel measurands                     5

Figure 1: a flow chart describes the three databases (DB1, DB2 and DB3).
The flow chart describes the process to obtain three databases: the initial number of results, the number of outliers detected, the number of
missing values replaced and the final number of data considered for database 1 (DB1), database 2 (DB2) and database 3 (DB3) respectively.

step, the missing data were imputed, to obtain the total theoretical        lower than that included in DB1 and DB2, and it corresponds to the
amount of 23,660 data. As a second step, the values beyond 4SD, for         data obtained after having applied the Elliptic Envelope ML technique
each measurand distribution, were discarded. As a third step, the           (Figure 1).
missing data was imputed a second time using the missing procedure
(Figure 1).
      Subsequently, a multivariate outlier detection technique, called      Missing data
Elliptic Envelope [26], was applied. Elliptic Envelope is based on the
robust covariance estimation of the data. This method assumes that          The missing value imputation has been applied as follows:
data is sampled from a multivariate Gaussian distribution (which can        (1) If a subject, for a given collection of a particular measurand, has
be visualized in the multi-dimensional space as an ellipse), so that            only one of the two replicates, then the missing replicate is
outlier observations are defined as those observations lying “too far”           imputed with the mean value of the replicate ± SD of the same
outside of the ellipse fitted around the data. The outlier-ness of the           subject (+SD if the value of the present replicate is lower than the
observations is determined through the Mahalanobis distance. Briefly,            mean, and –SD if higher);
the Mahalanobis distance is the distance between a multidimensional         (2) If both replicates for a given collection of an analyte were missing,
point and a distribution, computed as d(x) = [(x−µ)T · C−1 · (x−µ)]0.5,         then the missing values are imputed with two values having the
where x is the vector of the observations, µ the vector of mean values, T       same mean value and SD obtained from the other samples of the
denotes matrix transposition, and C−1 the inverse covariance matrix             same subject;
[22, 26]. Compared with traditional univariate outlier detection ap-        (3) If a subject does not have any result for a given analyte, then its 20
proaches, this method, being based on a multivariate criterion, takes           results are imputed with 20 values sampled at random from a
into account, at the same time, all results obtained from the same              distribution with the same mean values and SD than the other
sample (two replicates for 13 measurands). Therefore, for each outlier          subjects from the same population subgroup (males, fertile
detected 26 results were discarded (one sample). As a final step, the            females or menopausal females).
DB2 was imputed a second time, using the missing procedure, to
obtain the total theoretical amount of 23,660 data (Figure 1).
                                                                            Data matrices
Database 3: The last database, database 3 (DB3), is the most conser-
vative database. It differs from the DB2 in that the last missing pro-      From the resulting databases (DB1, DB2 and DB3), for each subject for
cedure is not performed. By contrast, missing results are discarded         each analyte, the mean values were calculated, aggregating the ten (or
from further analysis. Thus, the final amount of data included in DB3 is    all the available ones, in the case of the DB3) remaining couples of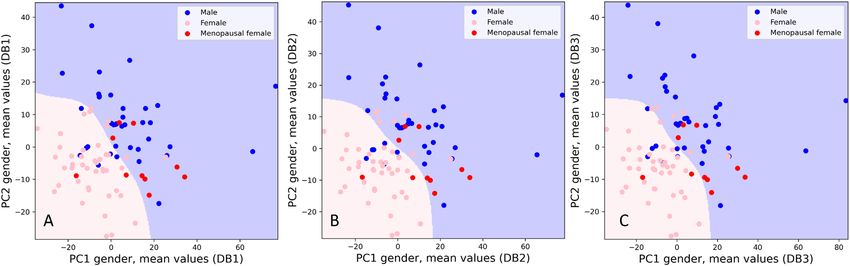
6          Carobene et al.: EuBIVAS: a machine learning approach on metabolic panel measurands

replicates. Therefore, only one value for each analyte is assigned to           The data elaboration has been performed using python 3.7, with
each subject.                                                              the following libraries: pandas version 1.2.0; matplotlib version 3.3.2;
     For each database, the first data matrix (DM-mean) considered         numpy version 1.19.2; seaborn version 0.11.1; sklearn version 0.23.2;
encompassed 91 rows (subjects) and 15 columns (features) reporting         scipy version 1.5.2. Minibatch K-means and Spectral Clustering algo-
sex, age and quantitative variables: 13 mean values, one for each          rithms have been used to estimate the accuracy of the clusterization
measurand.                                                                 procedure. In particular, accuracy was estimated, for each of the above
     A second data matrix (DM-CVP) has been considered, using, for         mentioned possible demographic characteristics, by matching each
each single subject, the “within-person BV” (CVP), for each measur-        cluster with the population group for which the degree of overlap was
and, instead of the mean values. The DM-CVP is therefore composed by       maximal.
91 rows (subjects) and 13 CVP values, one for each measurand.
     To note that the term CVP is used instead of the “within-subject BV
(CVI)” to distinguish between the coefficients of variation for a single
individual (CVP) and for the pooled value from studies on a number of      Results
individuals (CVI), respectively, as recently by Simundic et al. [27].
     CVP, for each subject and for each measurand, has been obtained       DB1. The number of outliers detected and removed by the
from the 20 results (2 replicates for 10 collections) by computing the     traditional statistical analysis for the DB1 was previously
CVA within person (CVAP) between replicates using the following
                                                                           published [17–20], while the number of the imputed
formula:
                                                                           missing values, together with the number of the second
                           DSP=(σ2P − σ2A ) /
                                           ∧1 2
                                                                           outlier detection procedure, are reported in Figure 1.
                                          ∗
                          CVP=(DSP )/XP 100                                     DB2 and DB3. The flowchart (Figure 1) reports the
Where:                                                                     number of the imputed missing values, the number of ob-
–  σ2P is the total biological variance for a single person                servations detected as outliers beyond the 4SD, and the
–  σ2A is the analytical variance for a single person                      number of observations (samples) detected as outliers by
–  DSP is intra person biological standard deviation                       the Elliptic Envelope technique (multivariate procedure),
–  XP is the mean value for a single person
                                                                           for both DB1 and DB2. Fifty-one observations were detected
                                                                           as outliers as beyond the 4SD from the general distribution,
                                                                           while the assessment of the Elliptic Envelope ML technique
The 2 principal component analysis (2PCA)                                  led to the exclusion of further 91 samples (10% of the total
                                                                           set of data). These 91 samples have been removed from 49
PCA is a machine learning technique that has the goal of performing        subjects, resulting in a mean of 1.9 observations/subject.
dimensionality reduction, while preserving most of the information
                                                                                A subject without any data for a given measurands
about the variance within data. As a consequence, this method is
particularly useful to visualize multidimensional data.                    never occurred, so that the imputation of 20 values
     Briefly, PCA transform the data from a 13-dimensional space,          randomly generated with the same mean values and DS of
mapping them into a k-dimensional space (kPCA). In this work, we           the other subjects was not necessary.
selected a value of k = 2, ass this technique was used to visualize             For each database, the total number of imputed
whether there may be strongly recognizable clusterings.
                                                                           missing values, for each measurand, is reported in Table 2.
     The 2PCA representations of DM-mean and DM-CVP were plotted,
so as to visually inspect any possible clustering among subjects. Each
                                                                                The PCA visualizations obtained for the three databases
point in the picture represents a single subject in a two-dimensional      (panel a, b and c), for the mean and CVP values, are reported
space, obtained from the original 13 features through the application      in Figures 2 and 3 respectively. The subjects are represented
of 2PCA.                                                                   through different colors, according to the gender/age groups.
     The demographic characteristics reported in Table 1 have been         A clear clustering has been identified between males and
evaluated, as possible clusters, for each database, in both DM-mean
                                                                           females mean values (Figure 2) with an accuracy of 86, 86 and
and DM-CVP, as follows:
–    Three gender/age related subgroups: males, fertile females and        85% for DB1, DB2, and DB3 respectively, while for CVP values
     menopausal females;                                                   no clustering has been found (accuracy around 60% in all
–    Five subgroups related to the country of origin: Italy, Norway,       databases) (Figure 3). Interestingly, the points that identify
     Spain, The Netherland and Turkey;                                     the mean values of the females in menopausal age, are
–    Three     physical     activity   subgroups:     none,   light(7 h/week);
–    Two BMI subgroups: 5 cigarettes/day;          feature importance scores, computed by means of the PCA
–    Three alcohol intake subgroups: none; moderate (≤2U/day), high        analysis, for the three different databases for the mean values
     (>2Unit day);                                                         clustering are shown in supplemental figure 1. ALP, followed
Carobene et al.: EuBIVAS: a machine learning approach on metabolic panel measurands 7
Table : Number of data included for each database for the measurands considered.
Measurand Database Database Database
Initial number Final number, % of Initial number Final number, % of Initial number Final number, % of
of data missing replaced of data missing replaced of data missing replaced
GLU , ,, .% , ,, .% , ,, .%
Ca , ,, .% , ,, .% , ,, .%
Alb , ,, .% , ,, .% , ,, .%
TP , ,, .% , ,, .% , ,, .%
Na , ,, .% , ,, .% , ,, .%
K , ,, .% , ,, .% , ,, .%
Cl , ,, .% , ,, .% , ,, .%
Urea , ,, .% , ,, .% , ,, .%
Crea , ,, .% , ,, .% , ,, .%
ALP , ,, .% , ,, .% , ,, .%
AST , ,, .% , ,, .% , ,, .%
ALT , ,, .% , ,, .% , ,, .%
TBil , ,, .% , ,, .% , ,, .%
Total , ,, .% , ,, .% , ,, .%
GLU, glucose; Alb, albumin; TP, total proteins; Na, sodium; K, potassium; Cl, chloride; Crea, creatinine; ALP, phosphatase alkaline; AST,
aspartate aminotransferase; ALT, alanine aminotransferase; TBil, total bilirubin.
by Crea, ALT and AST, resulted as the most significant fea- clusterings for smoking habits, and alcohol intake are shown
tures for all databases. in Figure 6, for both mean and CVP values.
As for the gender/age subgroups, no significant dif-
ferences have been found, in the three databases, also for
country of origin, smoking habits, alcohol intake, BMI and
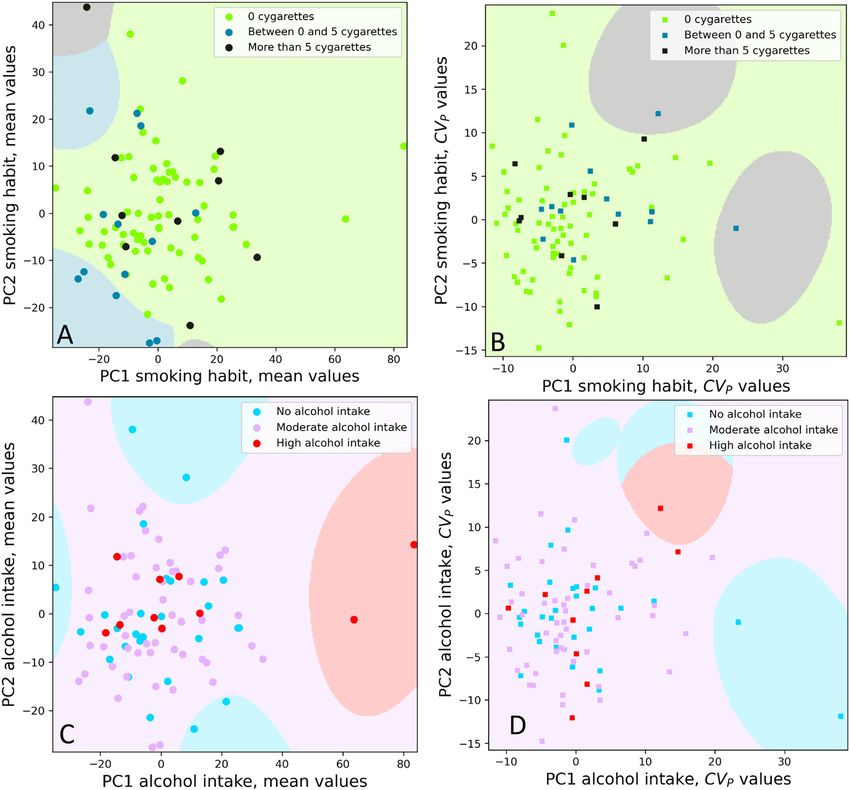
physical activity (data not shown). For these latter, PCA Discussion
visualization are shown only for the DB3.
No clustering related to the country of origin was Although ML is routinely used in biochemical development
detectable (Figure 4), for both mean values (Figure 4A), and and for evaluating and interpreting data in several medical
CVPS values (Figure 4B). Figure 5 reports the PCAs for the specialties, the application of ML in clinical laboratory
physical activity (panels a, b) and for the BMI (panels c, d). A medicine still appears to be an unexpectedly slow process
negligible clustering (accuracy 63%) appears for the mean [28]. However, “A short guide for medical professionals
values according to the BMI (panel c). Similarly, irrelevant in the era of artificial intelligence” has recently been
Figure 2: Mean values gender related 2 principal component analysis (2PCA).
Each point in the picture represents a single subject position in a space in a two dimensional representation (2PCA) obtained using 13 mean
values as features. The blue, pink and red circles indicate the men, females in fertile and in menopausal age respectively. The data from
database 1 (DB1), database 2 (DB2), and database 3 (DB3), are represented in the three different panels (A, B and C, respectively).8 Carobene et al.: EuBIVAS: a machine learning approach on metabolic panel measurands
Figure 3: CVP values gender related 2 principal component analysis (2PCA).
Each point in the picture represents a single subject position in a space in a two dimensional representation (2PCA) obtained using 13 CVP
values as features. The blue, pink and red circles indicate the men, females in fertile and in menopausal age respectively. The data from
database 1 (DB1), database 2 (DB2), and database 3 (DB3), are represented in the three different panels (A, B and C, respectively).
Figure 4: Mean and CVP values countries related 2 principal component analysis (2PCA).
Each point in the picture represents a single subject position in a space in a two dimensional representation (2PCA). The different colors
represent the country of origin: light blue for Italy, black for Norway, orange for Spain, yellow for Turkey, and green for The Netherland. The
mean values and CVP data are represented in panels (A) and (B), respectively.
published, with the aim to serve as a short repository of multivariate approach to detect outliers using ML tech-
information and details every physician might need to niques. For this purpose, the EuBIVAS database, used in
know in the age of AI [29]. Laboratory data are influenced previously publication [17–20], cleaned of the outliers
by several factors including the pre-analytical (collection, detected by the traditional univariate statistical tests, was
time, stability, storage temperature, etc.) [30], and the used, and compared to other two databases obtained as
analytical phase (standardization, harmonization etc.) [31, described in the previous sections. Furthermore, since
32], therefore they should be used with caution and most ML algorithms cannot be applied on datasets with
competence, in collaboration with clinicians [21]. missing data, a missing data imputation procedure was
Hereby, we applied ML techniques on a metabolic applied. In this respect, it is worth noting that the missing
panel of measurands from the EUBIVAS study, with a dual procedure here conceived, has been established to do not
purpose: first, to verify the homogeneity of the involved alter the mean and variance values either in the single
population, coming from different European countries; subject, or in the subgroup, or in the whole population.
second, to evaluate the existence of possible clusterings, The number of data removed by the multivariate
due to different lifestyles, and to validate a new procedure to obtain the databases 2 and 3 (Figure 1) is ofCarobene et al.: EuBIVAS: a machine learning approach on metabolic panel measurands 9
Figure 5: Mean and CVP values according to physical activity and BMI 2 principal component analysis (2PCA).
Each point in the picture represents a single subject position in a space in a two dimensional representation (2PCA). Panels (A) and (B):
different colors represent different amounts of physical activity: none in blue, medium in red (7 h/week)
for mean values and CVP data (panel a and b respectively). Panels (C) and (D): body mass index (BMI) < 21 and BMI > 21 for mean and CVP values
are represented in black and in light blue in (C) and (D), respectively.
2,366 results (10% of the total number of data), much the face validity of the ML multivariate method used to
higher than the number of data (568 data, 2.4%) removed remove the outliers, and of the missing replacement
by the traditional statistical tests used individually for procedure.
each measurand. This difference in the number of out- Figure 2 shows an evident clustering in all databases,
liers identified and removed should not surprise, if we based on the mean values for males and females sub-
considered that multivariate methods can identify ob- groups. This clustering, here identified, means that with an
servations which deviate from the global behavior of the accuracy of 85% it is possible to predict, from laboratory
data (that is, observations that have relationships be- data, whether the subject is male or female. Such a relevant
tween variables which are different from most of the clusterization, using mean values of the measurands here
other observations), even in the absence of extreme considered, should not be considered surprising as it
values in each single variable (univariate approach). is obviously due to the different values concentration be-
Despite the different methods applied to detect the tween males and females for some measurands, which is
outliers, and the differences among the number of data also reflected in different reference intervals (ALP, creati-
removed, the visualizations obtained applying PCA nine, ALT and AST). Interestingly, these measurands were
analysis to the three databases were similar: this confirms identified as the most important features for the PCA10 Carobene et al.: EuBIVAS: a machine learning approach on metabolic panel measurands Figure 6: Mean and CVP values according to alcohol consumption and smoking habits 2 principal component analysis (2PCA). Each point in the picture represents a single subject position in a space in a two dimensional representation (2PCA). Panels (A) and (B): different colors represent different smoking habits: none in green, low in blue (5 cigarettes/day) for mean values and CVP data (panel a and b respectively). Panels (C) and (D): different colors represent different alcohol intake: none in light blue, moderate in pink (2 Units/day) for mean values and CVP data (panels (A) and (B), respectively). clustering (supplemental figure 1). However, as shown in female area into male area, indicating the need to set Figure 2, it is interesting to note that the same clustering appropriate reference intervals for females in meno- has been found in all databases with almost the same pausal age, for which more studies are desirable. The six accuracy (between 85 and 86%), confirming the fact that males that are moved in females area (mean age the databases are able to provide the same information, 34.8 ± 3.3 years), three from Italy and three from Turkey, despite different approaches in missing values identifi- are characterized to be sedentary (5 out 6 declared to do cation and replacement. This further suggests that not do any physical activity, and just one only light ac- observations identified as outliers by the multivariate tivity), to be drinkers (6 out of 5 more than 2U/day of method were also labelled as outliers by the univariate alcohol consumption) and no smokers (just one out of 6 method. Moreover, this expected clustering with gender declared to smoke), and to have a high BMI (mean indirectly confirms that the PCA approach works. 26.3 ± 2.6). Another noteworthy finding, regards the subgroup of Contrary to that observed for the mean values, the menopausal females that are overall displaced from the CVP values obtained in males’ and females’ subgroups,
Carobene et al.: EuBIVAS: a machine learning approach on metabolic panel measurands            11

do not show any visible clustering in any database                sampling time and storage information are crucial for
(Figure 3). All this seems to suggest that, despite the           qualifying a sample as suitable for being tested [33, 36].
differences in mean values, the component of BV is not
overall affected by the concentration gender-related,
confirming the validity in using a unique RCV and APS
values based on BV estimates.                                     Conclusions
     Considering that the three databases have always
given overlapping results (data not shown), for conve-            The EuBIVAS protocol followed a strict experimental
nience, PCAs related to the data of the only DB3 are shown        design [11, 12], powered to deliver estimates of BV with a
in the next figures.                                              high degree of reliability for a well-characterized multi-
     The countries of origin of the subjects enrolled in          national cohort of subjects.
EuBIVAS are highlighted by different colors in Figure 4 for            The absence of meaningful differences between
mean (a) and CVP values (b) respectively. In Figure 4, no         groups from Turkey, Norway, The Netherlands, Spain, and
clustering for the country is recognizable, which implies         Italy confirms that the obtained data are widely applicable
that it is not possible to distinguish any sub-population         across healthcare systems and that they can be used to
from their origin and, as a consequence, the whole EUBI-          deliver APS for systems to be used internationally.
VAS population can be considerable homogenous. Actu-                   Similarly to what has been observed for the country
ally, EuBIVAS studied previously published about the              variable, the absence of clusterings for alcohol, smoking
measurands here included, found a significant difference           habits, BMI and physical activity further confirms that the
in population only in the case of creatinine mean values for      EuBIVAS sample is homogenous.
the Turkish people [19], while for other measurands no                 In conclusion, our data support the use of ML PCA
differences among countries were found.                           technique and of the multivariate approach to detect out-
     The observation that the mean creatinine concentration       liers, in alternative to univariate methods, to gain new
was lower in Turkish participants is not surprising. This has     insight of the data. Moreover, this novel approach confirms
been reported previously, being explained as resulting from       the homogeneity of the EuBIVAS dataset.
differences in diet (low meat consumption) and different
physical activity [19]. This was also confirmed by the lifestyle
                                                                  Acknowledgments: The authors would like to thank the
information provided by the enrolled subjects in EuBIVAS
                                                                  EFLM Working Group on BV for the use of data from the
(Table 1). In this study, the small difference in creatinine
                                                                  EuBIVAS.
concentration, is “hidden” in a multi-measurand panel, so
                                                                  Research funding: None declared.
that the EuBIVAS population all together can be considerate
                                                                  Author contributions: All authors have accepted respon-
suitable, being homogenous, for having estimated BV gen-
                                                                  sibility for the entire content of this manuscript and
erizable data. This last consideration further stresses the
                                                                  approved its submission.
importance that both the multivariate as well as the univar-
                                                                  Competing interests: Authors state no conflict of interest.
iate approach may give valuable information.
                                                                  Informed consent: Informed consent was obtained from all
     From the PCAs visualization (Figure 4), there is no
                                                                  individuals included in this study.
data suggesting any differences in pre-analytical vari-
                                                                  Ethical approval: The EuBIVAS protocol was approved by
ables or samples treatment among the different labora-
                                                                  the Institutional Ethical Review board of San Raffaele
tories. This finding is particularly relevant, considering
                                                                  Hospital in agreement with the World Medical Association
the criticality in the pre-analytical phase of some meas-
                                                                  Declaration of Helsinki and by the Ethical board/regional
urands included in the metabolic panel. For example,
                                                                  Ethics Committee for each involved center. Informed
several pre-analytical quality indicators in laboratory
                                                                  consent was signed by all enrolled subjects.
medicine are strongly dependent on the time the sample
is collected, and careful attention to the pre-analytical
phase is essential to ensure accurate glucose and elec-
                                                                  References
trolytes measurements for the delay in specimen pro-
cessing [33–35]. Moreover, many factors can affect                1. Fraser CG, Kallner A, Kenny D, Petersen PH. Introduction:
analyte stability for most laboratory tests. Just think              strategies to set global quality specifications in laboratory
about the enzyme activities measurements, where                      medicine. Scand J Clin Lab Invest 1999;59:477–8.
12 Carobene et al.: EuBIVAS: a machine learning approach on metabolic panel measurands
2. Haeckel R, Wosniok W, Kratochvila J, Carobene A. A pragmatic 16. Bartlett WA, Braga F, Carobene A, Coşkun A, Prusa R, Fernandez-
proposal for permissible limits in external quality assessment Calle P, et al. Biological variation working group, European
schemes with a compromise between biological variation and the federation of clinical Chemistry and laboratory medicine (EFLM).
state of the art. Clin Chem Lab Med 2012;50:833–9. A checklist for critical appraisal of studies of biological variation.
3. Carobene A, Franzini C, Ceriotti F. Comparison of the results from Clin Chem Lab Med 2015;53:879–85.
two different External Quality Assessment Schemes supports the 17. Aarsand AK, Díaz-Garzón J, Fernandez-Calle P, Guerra E, Locatelli
utility of robust quality specifications. Clin Chem Lab Med 2011; M, Bartlett WA, et al. The EuBIVAS: within- and between-subject
49:1143–9. biological variation data for electrolytes, lipids, urea, uric acid,
4. Fraser CG. Reference change values: the way forward in total protein, total bilirubin, direct bilirubin, and glucose. Clin
monitoring. Ann Clin Biochem 2009;46:264–5. Chem 2018;64:1380–93.
5. Fraser CG. The nature of biological variation. In: biological 18. Carobene A, Aarsand AK, Guerra E, Bartlett WA, Coskun A,
variation: from principles to practice. Washington, DC: AACC Díaz-Garzón Marco J, et al. European biological variation study
Press; 2001. pp. 1–27. (EuBIVAS): within- and between-subject biological variation data
6. Coskun A, Sandberg S, Unsal I, Cavusoglu C, Serteser M, Kilercik for 15 frequently measured proteins. Clin Chem 2019;65:1031–41.
M, et al. Personalized reference intervals in laboratory medicine: 19. Carobene A, Marino I, Coŝkun A, Serteser M, Unsal I, Guerra E,
a new model based on within-subjects biological variation. Clin et al. The EuBIVAS project: within and between-subject biological
Chem 2021;67:374–84. variation data for serum creatinine using enzymatic and alkaline
7. Panteghini M, Sandberg S. Defining analytical performance picrate methods and implications for monitoring. Clin Chem
specifications 15 years after the Stockholm conference. Clin 2017;63:1527–36.
Chem Lab Med 2015;53:829–32. 20. Carobene A, Røraas T, Sølvik UØ, Sylte MS, Sandberg S, Guerra E,
8. Sandberg S, Fraser GC, Horvath AR, Jansen R, Jones G, Oosterhuis et al. Biological variation estimates obtained from 91 healthy
W, et al. Defining analytical performance specifications: study participants for 9 enzymes in serum. Clin Chem 2017;63:
consensus statement from the 1st strategic conference of the 1141–50.
European Federation of Clinical Chemistry and Laboratory 21. Badrick T, Banfi G, Bietenbeck A, Cervinski MA, Loh TP, Sikaris K.
Medicine. Clin Chem Lab Med 2015;53:833–5. Machine learning for clinical chemists. Clin Chem 2019;65:1350–6.
9. Carobene A. Reliability of biological variation data available in an 22. Ghorbani H. Mahalanobis distance and its application for
online database: need for improvement. Clin Chem Lab Med 2015; detecting multivariate outliers. Facta Univ – Ser Math Inf 2019;34:
53:871–7. 583–95.
10. Aarsand AK, Røraas T, Bartlett WA, Coşkun A, Carobene A, 23. Bottani A, Banfi G, Locatelli M, Aarsand AK, Coşkun A,
Fernandez-Calle P, et al. Harmonization initiatives in the Díaz-GarzónJ, et al. European biological variation study
generation, reporting and application of biological variation (EuBIVAS): within- and between-subject biological variation
data. Clin Chem Lab Med 2018;56:1629–36. estimates for serum thyroid biomarkers based on weekly
11. Carobene A, Strollo M, Jonker N, Barla G, Bartlett WA, Sandberg S, samplings from 91 healthy participants. Clin Chem Lab Med
et al. Sample collections from healthy volunteers for biological 2021. https://doi.org/10.1515/cclm-2020-1885 [Epub ahead-
variation estimates’ update: a new project undertaken by the of-print].
Working Group on Biological Variation established by the 24. Bottani M, Banfi G, Guerra E, Locatelli M, Aarsand AK, Coşkun A,
European Federation of Clinical Chemistry and Laboratory et al. European Biological Variation Study (EuBIVAS): within- and
Medicine. Clin Chem Lab Med 2016;54:1599–608. between-subject biological variation estimates for serum
12. Carobene A, Aarsand AK, Bartlett WA, Coskun A, Diaz-Garzon J, biointact parathyroid hormone based on weekly samplings from
Fernandez-Calle P, et al. The European biological variation study 91 healthy participants. Ann Transl Med 2020;8:855.
(EuBIVAS): a summary report. Clin Chem Lab Med 2021. https:// 25. Cavalier E, Fraser CG, Bhattoa HP, Heijboer AC, Makris K, Ulmer
doi.org/10.1515/cclm-2021-0370 [Epub ahead of print]. CZ, et al. Analytical performance specifications for
13. Røraas T, Petersen PH, Sandberg S. Confidence intervals and power 25-hydroxyvitamin D examinations. Nutrients 2021, 13, 431.
calculations for within-person biological variation: effect of doi.org/https://doi.org/10.3390/nu13020431.
analytical imprecision, number of replicates, number of samples, 26. McKinnon C, Carroll J, McDonald A, Koukoura S, Infield D,
and number of individuals. Clin Chem 2012;58:1306–13. Soraghan C. Comparison of new anomaly detection technique for
14. Carobene A. The European biological variation study (EuBIVAS): wind turbine condition monitoring using gearbox SCADA data.
delivery of updated biological variation estimates, a project by Energies 2020;13:5152.
the working group on biological variation in the European 27. Simundic AM, Kackov S, Miler M, Fraser CG, Petersen PH. Terms
federation of clinical Chemistry and laboratory medicine. J Lab and symbols used in studies on biological variation: the need for
Precis Med 2017;2:70. harmonization. Clin Chem 2015;61:438–9.
15. Aarsand A, Roraas T, Fernandez-Calle P, Ricós C, Diaz-Garzon J, 28. Cabitza F, Banfi G. Machine learning in laboratory medicine:
Jonker N, et al. On behalf of the EFLM Working Group on Biological waiting for the flood? Clin Chem Lab Med 2018;56:516–24.
Variation and Task and Finish Group for the Biological Variation 29. Meskó B, Görög M. A short guide for medical professionals in the
Database. The biological variation data critical appraisal era of artificial intelligence. NPJ Digit Med 2020;3:126.
checklist (BIVAC): a new standard for evaluating studies on 30. Vermeersch P, Frans G, von Meyer A, Costelloe S, Lippi G,
biological variation. Clin Chem 2018;64:501–14. Simundic AM. How to meet ISO15189:2012 pre-analyticalCarobene et al.: EuBIVAS: a machine learning approach on metabolic panel measurands 13
requirements in clinical laboratories? A consensus document by 34. Janssen K, Delanghe J. Importance of the pre-analytical phase in
the EFLM WG-PRE. Clin Chem Lab Med 2021;59:1047–61. blood glucose analysis. Acta Clin Belg 2010;65:311–8.
31. Miller WG, Greenberg N. Harmonization and standardization: 35. Baruah A, Goyal P, Sinha S, Ramesh KL, Datta R. Delay in
where are we now? J Appl Lab Med 2021;6:510–21. specimen processing-major source of preanalytical variation in
32. Carobene A, Ceriotti F, Infusino I, Frusciante E, Panteghini M. serum electrolytes. J Clin Diagn Res 2014;8:CC01–3.
Evaluation of the impact of standardization process on the quality 36. Cuccherini B, Nussbaum SJ, Seeff LB, Lukacs L,
of serum creatinine determination in Italian laboratories. Clin Zimmerman HJ. Stability of aspartate aminotransferase and
Chim Acta 2014;427:100–6. alanine aminotransferase activities. J Lab Clin Med 1983;
33. Lippi G, Betsou F, Cadamuro J, Cornes M, Fleischhacker M, 102:370–6.
Fruekilde P, et al. Simundic AM; working group for preanalytical
phase (WG-PRE), European federation of clinical Chemistry and
laboratory medicine (EFLM). Preanalytical challenges - time for Supplementary Material: The online version of this article offers
solutions. Clin Chem Lab Med 2019;57:974–81. supplementary material (https://doi.org/10.1515/cclm-2021-0599).You can also read