THE MILAN URBAN FOOD POLICY PACT MONITORING FRAMEWORK - A practical handbook for implementation - FAO
←
→
Page content transcription
If your browser does not render page correctly, please read the page content below

THE MILAN URBAN FOOD POLICY PACT
          MONITORING FRAMEWORK
         A practical handbook for implementation
Carey, J., & Cook, B. 2021. The Milan Urban Food Policy Pact monitoring framework: A practical handbook for
implementation. FAO. Rome.
The designations employed and the presentation of material in this information product do not imply the expression
of any opinion whatsoever on the part of the Food and Agriculture Organization of the United Nations (FAO)
concerning the legal or development status of any country, territory, city or area or of its authorities, or concerning
the delimitation of its frontiers or boundaries. The mention of specific companies or products of manufacturers,
whether or not these have been patented, does not imply that these have been endorsed or recommended by
FAO in preference to others of a similar nature that are not mentioned.
The views expressed in this information product are those of the author(s) and do not necessarily reflect the views
or policies of FAO.
© FAO, 2021

Some rights reserved. This work is made available under the Creative Commons Attribution-NonCommercial-
ShareAlike 3.0 IGO licence (CC BY-NC-SA 3.0 IGO; https://creativecommons.org/licenses/by-nc-sa/3.0/igo/
legalcode).
Under the terms of this licence, this work may be copied, redistributed and adapted for non-commercial purposes,
provided that the work is appropriately cited. In any use of this work, there should be no suggestion that FAO
endorses any specific organization, products or services. The use of the FAO logo is not permitted. If the work
is adapted, then it must be licensed under the same or equivalent Creative Commons licence. If a translation of
this work is created, it must include the following disclaimer along with the required citation: “This translation was
not created by the Food and Agriculture Organization of the United Nations (FAO). FAO is not responsible for the
content or accuracy of this translation. The original [Language] edition shall be the authoritative edition.”
Disputes arising under the licence that cannot be settled amicably will be resolved by mediation and arbitration as
described in Article 8 of the licence except as otherwise provided herein. The applicable mediation rules will be
the mediation rules of the World Intellectual Property Organization http://www.wipo.int/amc/en/mediation/rules
and any arbitration will be conducted in accordance with the Arbitration Rules of the United Nations Commission
on International Trade Law (UNCITRAL).
Third-party materials. Users wishing to reuse material from this work that is attributed to a third party, such as
tables, figures or images, are responsible for determining whether permission is needed for that reuse and for
obtaining permission from the copyright holder. The risk of claims resulting from infringement of any third-party-
owned component in the work rests solely with the user.
Sales, rights and licensing. FAO information products are available on the FAO website (www.fao.org/
publications) and can be purchased through publications-sales@fao.org. Requests for commercial use should
be submitted via: www.fao.org/contact-us/licence-request. Queries regarding rights and licensing should be
submitted to: copyright@fao.org.

i

Authors

Joy Carey and Brian Cook, RUAF Consultants

Acknowledgements

Thanks to all the people who have contributed to this first MUFPP monitoring framework
pilot project in 2019:

  f   The City of Antananarivo, Madagascar (led by Tokiana Rakotonirainy with support
      from Carmen Zuleta, RUAF Associate)

  f   The City of Nairobi, Kenya (led by Winfred Katumo with support from Diana
      Lee-Smith and Sam Ikua, Mazingira Institute)

  f   The City of Quito (led by Alexandra Rodriguez, CONQUITO, with support from
      Alain Santandreu, RUAF)

  f   RUAF consultants, Joy Carey and Brian Cook

  f   FAO (led by Guido Santini, Michela Carucci and Gilles Martin)

  f   Professor Alison Blay-Palmer, Laurier Centre for Sustainable Food Systems,
      Wilfrid Laurier University, Canada

  f   Yota Nicolarea, Milan Urban Food Policy Pact Secretariat

  f   International Water Management Institute, and the CGIAR Research Program on
      Water, Land and Ecosystems

Also acknowledging FAO and RUAF’s wider work of developing indicators to monitor
sustainable food systems, and applied to MUFPP, with cities, for cities (Joy Carey, Marielle
Dubbeling, 2016–2018).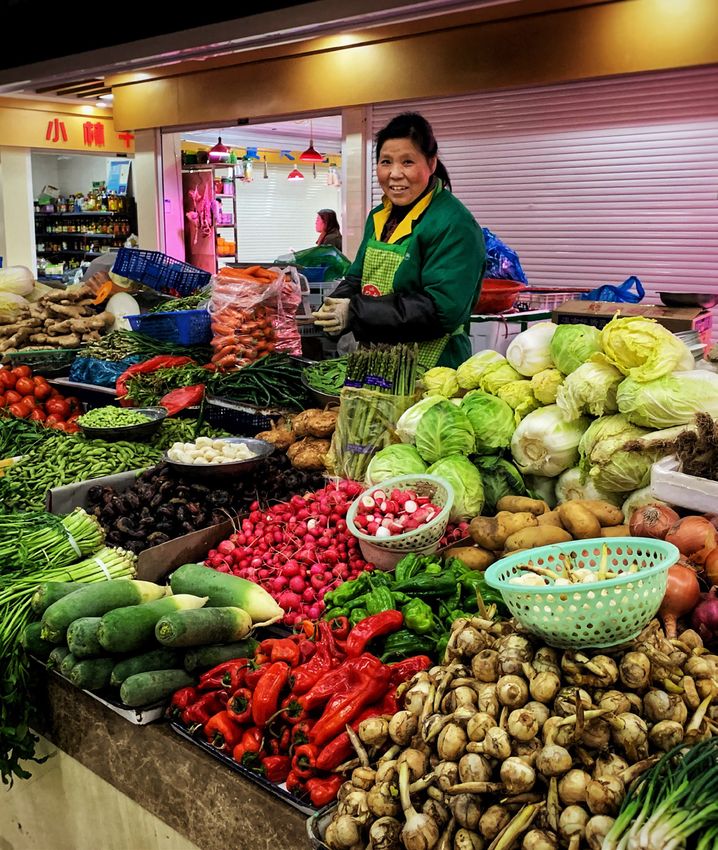
ii

     How to use this handbook and additional
     resources
     Handbook: Based on the experience of three pilot cities, this handbook sets out
     a pathway for other cities to follow in five practical steps. Section 7 (pages 25–27)
     provides a list, with online links, to all reference documents and resources. These
     should be used in parallel with this handbook.

     References: The key reference documents include the MUFPP monitoring framework
     explanatory booklet in English, Spanish, French and Portuguese languages and links
     to each of the detailed 44 indicator guidelines (English). These are also available as
     compiled sets of guidelines linked to each of the MUFPP workstream categories.

     Resource pack: There are 14 separate downloadable, printable resources designed
     for use in workshops or planning discussions that support the step by step
     implementation process. Live links throughout this handbook indicate when they
     may be useful to use. All are available in PDF form and some are also available as
     Word documents to enable easier use. The resource pack has been developed from
     the practical experiences of the pilot cities and its purpose is to provide a clearly
     illustrated process for other cities.

     Pilot city insights: Reports (Antananarivo – English and French; Nairobi – English;
     Quito – English and Spanish) and presentations (English only) from the three pilot
     cities provide more detail on how each city worked with the MUFPP monitoring
     framework.

     Web link: This handbook and all related resources are available here:
     http://www.fao.org/documents/card/en/c/cb4181en/

     The MUFPP declaration and its recommended actions are available here:
     https://www.milanurbanfoodpolicypact.org/the-milan-pact/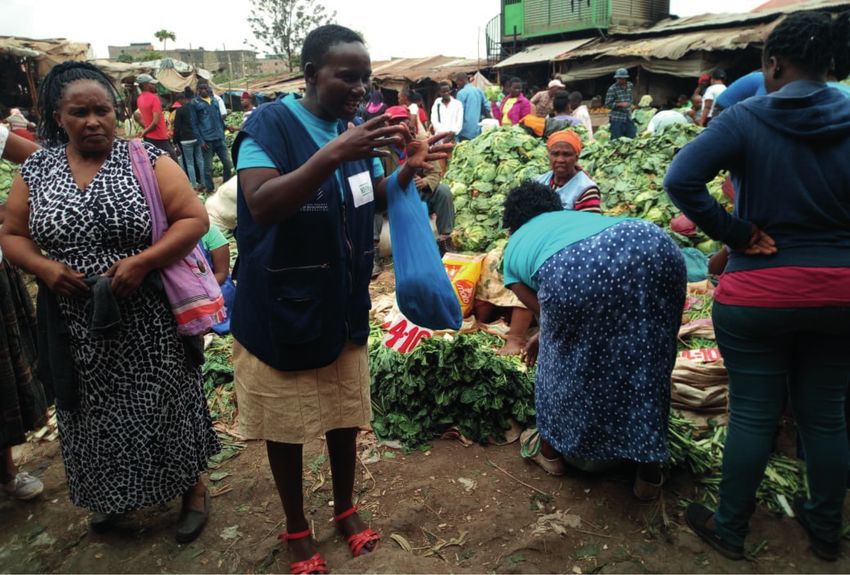
iii

Contents
Summary of key steps and resources for using the MUFPP                     v
monitoring framework

1. Purpose of this handbook                                               1

2. Background                                                             2

3. Objectives and summary of the pilot project                            4

4. Tools and methodology                                                  7

  f    Step 1. Preparatory thinking and key questions                     8

  f    Step 2. Developing indicator selection criteria                    9

  f    Step 3. Final selection of indicators                             10

  f    Step 4. Working with the indicators                               12

  f    Step 5. Challenges of using the MUFPP framework                   16

5. Challenges of using the framework                                     19

6. Reflections from RUAF                                                 23

7. Additional guidance, tools and url links                              25

  f    References: key MUFPP monitoring framework documents              25

  f    Resource pack: 14 practical resources to use with this handbook   26

  f    Pilot city insights: reports and presentations                    27

Annex A: Overview of the 2019 pilot project process                      28

iv

Resource pack

     f   Resource 1. Preparation questions and initial presentation for stakeholders
         http://www.fao.org/3/cb4181en/Resource1.pdf

     f   Resource 2. Worksheet on indicator selection criteria
         http://www.fao.org/3/cb4181en/Resource2.docx

     f   Resource 2a. Worked example from Nairobi
         http://www.fao.org/3/cb4181en/Resource2a.pdf

     f   Resource 3. Final selected indicators for pilot cities
         http://www.fao.org/3/cb4181en/Resource3.pdf

     f   Resource 4. Notes on selecting, customizing and working with indicators
         http://www.fao.org/3/cb4181en/Resource4.pdf

     f   Resource 5. Summary of MUFPP monitoring framework for workshops
         http://www.fao.org/3/cb4181en/Resource5.pdf

     f   Resource 6. Worksheet for simple process to review strategy and possible
         measures of success
         http://www.fao.org/3/cb4181en/Resource6.docx

     f   Resource 6a. Worked example from Quito
         http://www.fao.org/3/cb4181en/Resource6a.pdf

     f   Resource 7. Worksheet for identifying the most relevant indicators
         http://www.fao.org/3/cb4181en/Resource7.docx

     f   Resource 8. Worksheet for planning work with indicators
         http://www.fao.org/3/cb4181en/Resource8.docx

     f   Resource 9. Data collection process, issues addressed and approach in
         pilot cities
         http://www.fao.org/3/cb4181en/Resource9.pdf

     f   Resource 10. Template for indicator research reporting
         http://www.fao.org/3/cb4181en/Resource10.pdf

     f   Resource 11. Gender and the MUFPP monitoring framework
         http://www.fao.org/3/cb4181en/Resource11.pdf

     f   Resource 12: Gender and climate change sensitive indicators in Nairobi
         http://www.fao.org/3/cb4181en/Resource12.pdf

     f   Resource 13. Examples of data visualization
         http://www.fao.org/3/cb4181en/Resource13.pdf

     f   Resource 14: Summary of key steps, resources and top tips for using the
         MUFPP monitoring framework
         http://www.fao.org/3/cb4181en/Resource14.pdf
v

Summary of key steps and resources for
using the MUFPP monitoring framework
Objective: Implementation of a monitoring framework enables cities to plan and analyze
changes in their urban food system, in a way that both reflects MUFPP recommendations
and is tailored to the city’s own particular context. This summary explains the required
steps, each linked to the relevant sections of the resource pack.

Main references: Published MUFPP monitoring framework booklet and detailed
methodological guidance for using each of the 44 indicators.

   Step 1             Step 2               Step 3            Step 4           Step 5
   Preparatory        Developing           Final selection   Working with     Achievements
   thinking and       indicator            of indicators     the indicators   and making use
   key questions      selection criteria                                      of findings

Step 1. Preparatory thinking and key questions

Ensure that colleagues and stakeholders are clear about the existence, purpose and
relevance of the Milan Urban Food Policy Pact. Then do some early-stage preparatory
thinking.

  f    What are your city’s priority areas for action?

  f    What does your city want to achieve by using the monitoring framework?

  f    When it comes to achieving outcomes and measuring progress, who is accountable
       for what?

Resources
  f    Your own city’s existing food policy/strategy or equivalent document

  f    Published MUFPP monitoring framework booklet

  f    Summary of MUFFP monitoring framework for workshops (Resource 5) if you need
       several printed copies

  f    Worksheet for simple process to review strategy and possible measures of success
       (Resource 6) and worked example from Quito (Resource 6a)

  f    Worksheet for identifying most relevant indicators (Resource 7)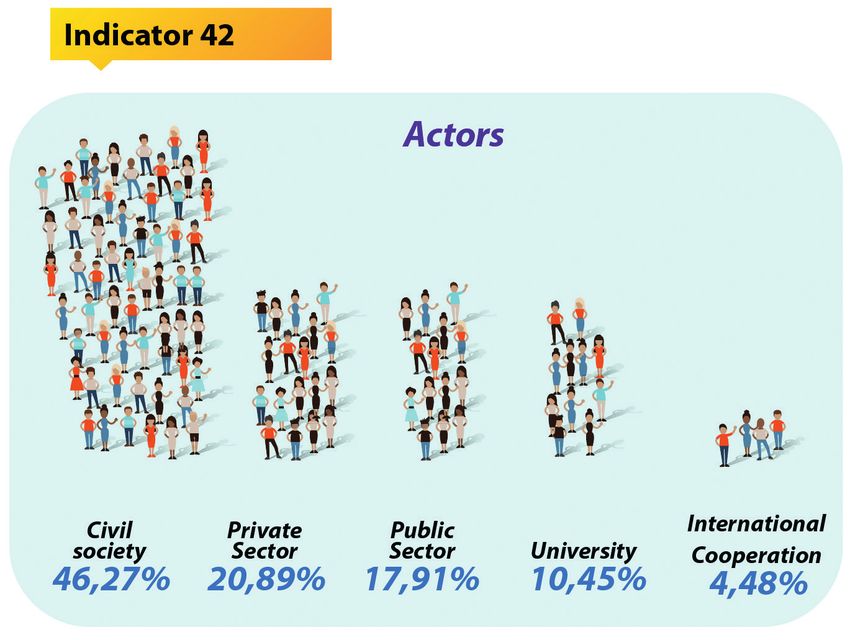
vi                                           THE MILAN URBAN FOOD POLICY PACT MONITORING FRAMEWORK

NB: It may be too early in the process and therefore not be possible to fully use Resources
6 and 7 in Step 1. However, they provide some guidance for structuring discussions with
stakeholders. Resource 6 provides a simple process for reviewing and connecting current
activities with future plans and identifying what measures of success would look like. This
exercise could be done first, especially if a food plan or strategy does not already exist.
Resource 7 is a worksheet template for gathering in one place the most relevant indicators
in relation to city priorities and actions and in relation to the six MUFPP work categories.

Output
      f   Preparation and initial presentation to share with stakeholders (Resource 1)

Step 2. Developing indicator selection criteria

Draw up a list of criteria to help you decide where to focus and what makes most sense
to your city and the current situation. Make sure to include the following: i) reflect local
priorities; ii) data likely to be available or easy to collect; and iii) data likely to be supported
by key local stakeholders. Consider other important criteria appropriate to your city
context and agree on the list with other stakeholders. It will be important to be able to
clearly explain how indicators have been selected.

Resources
      f   Notes on selecting, customizing and working with indicators (Resource 4)

Output
      f   Worksheet on indicator selection criteria (Resource 2) and worked example from
          Nairobi (Resource 2a)

Step 3. Final selection of indicators

This process will vary from city to city. Having applied the agreed selection criteria, it
may then be necessary to customize and adapt the MUFPP indicators to suit the specific
situation and needs of local priorities. Pragmatism may be required at this stage: ‘Small
enough to achieve but big enough to matter’. It’s wise to start with a few most feasible
indicators. Primary data collection may be needed if the indicator is important but there
are data gaps. Include your own qualifiers if using binary (yes/no) indicators. It may be
useful to continue working with Resources 6 and 7 at this point.

Resources
      f   Notes on selecting, customizing and working with indicators (Resource 4)

      f   Worksheet for simple process to review strategy and possible measures of success
          (Resource 6) and worked example from Quito (Resource 6a)

      f   Worksheet for identifying most relevant indicators (Resource 7)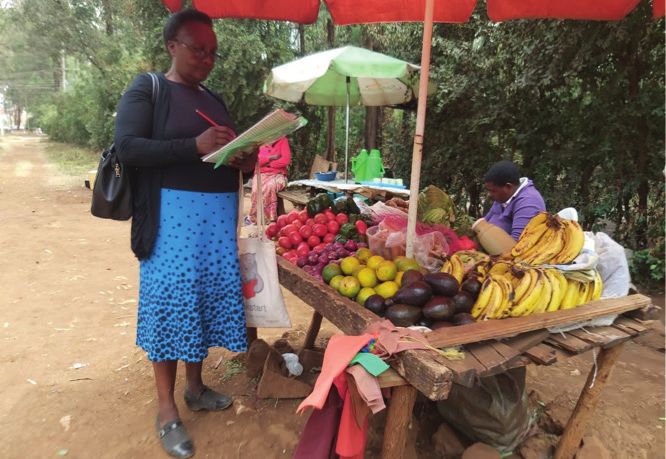
A PRACTICAL HANDBOOK FOR IMPLEMENTATION                                                  vii

Output
  f   Table with the final set of indicators, customized where necessary (Resource 3)

Step 4. Working with the indicators

As with previous steps, make sure to engage with others in this work. Development of
data collection and analysis plans need to be agreed. The need for further customization
might arise. It may well be that initial limited/poor/incomplete data sets will pave the way
for improvements in time; therefore, start from where you are now using what you have.
You may need to consider disaggregation of data, specific gender-related research, specific
climate-sensitive related research, etc.

Resources
  f   Notes on selecting, customizing and working with indicators (Resource 4)

  f   Simple process to review strategy and possible measures of success (Resource 6)
      and worked example from Quito (Resource 6a)

  f   Worksheet for planning work with indicators (Resource 8)

  f   Data collection process, issues addressed and approach in pilot cities (Resource 9)

  f   Template for indicator research reporting (Resource 10)

  f   Gender and the MUFPP monitoring framework (Resource 11)

  f   Gender and climate change sensitive indicators in Nairobi (Resource 12)

Output
  f   Worksheet for planning work with indicators completed (Resource 8)

  f   Clearly formulated research questions and approaches to guide data collection

  f   Indicator research reports completed

Step 5. Achievements and making use of findings

Once the results are available, the next challenge is to reflect on what has been learnt.
All the indicator results need to be explained. The process of working with the indicators
will have also generated learning. Reflection on both of these is important, from which
messages can be distilled. For example: overall view on gaps and the need for further food
policy implementation; the clear comprehension of the on-going progress or change from
a baseline; the need to develop additional data; the need to follow-up initial results and
develop targeted action; the value of collaborative working; the need for, or evidence to
support a case for future food system governance structures; etc. Identify clear messages
about what has been learnt; decide how to make the best strategic use of the information
and how to communicate it clearly to relevant stakeholders.
viii                                                   THE MILAN URBANFOOD POLICY PACTMONITORING FRAMEWORK

         Quito’s presentation of progress against Indicator 42
         Source: CONQUITO, 2019. Preparation: CONQUITO, 2019.

Resources
   f   Antananarivo report [English report Section 4] [French report p.14],
       [presentation slide 5]

   f   Nairobi [Report section 4], [presentation slides 4–8]

   f   Quito [English report section 6], [Spanish report section 6],
       [presentation slides 4& 5]

   f   Examples of data visualization (Resource 13)

Output
   f   Key messages for presenting to stakeholders

   f   Options for visualizing the results

   f   A communication plan
1 1 Purpose of this handbook The purpose of this handbook is to provide practical guidance for any cities wishing to adopt and implement a monitoring framework, tailored to their own context and reflecting MUFPP recommendations. The guidance sets out practical steps, simple tools, top tips and a methodology that other cities can follow. For cities that are new to using the monitoring framework, it may initially feel a bit intimidating to launch straight into this handbook. Resource 14 provides a summary overview of steps, resources and top tips for using the monitoring framework. reminder The MUFPP declaration lists a set of 37 recommended actions for cities wishing to develop their urban food policy. As an internationally recognized tool, the purpose of the MUFPP monitoring framework1 is to enable cities to develop their own urban food monitoring system. Cities are not applying ‘a MUFPP monitoring system’ but rather using it as a framework from which to develop their own customized system. This handbook follows the Milan Urban Food Policy Pact (MUFPP) approach of methodology ‘designed by cities for cities’. It is based on the results and lessons learned from a seven- month project in 2019 during which three cities – Antananarivo (Madagascar), Nairobi (Kenya) and Quito (Ecuador) – piloted implementation of the MUFPP monitoring framework with technical support from RUAF and FAO. Throughout the handbook, there are references to the three separate detailed city pilot reports: Antananarivo [English report] [French report]; Nairobi [English report]; and Quito [English report] [Spanish report]; and to the three city summary presentations in English, Antananarivo, Nairobi and Quito. 2 1 Available in English, French, Spanish and Portuguese. 2 These presentations have been shown during the Fifth Annual Gathering of the signatory cities of the MUFPP held in Montpellier, October, 2019.
2

2
Background
The Milan Urban Food Policy Pact, launched in 2015, is a non-binding agreement on
sustainable urban food policies ‘designed by cities for cities’. The MUFPP Framework of
Action sets out practical ways that cities can contribute to the transformation of urban
food systems through increased sustainability, articulated in a set of 37 recommended
actions organized around six categories:

        1                            2                            3
        Governance (ensuring         Sustainable diets            Social and
        an enabling environment      and nutrition                economic equity
        for effective action)

        4                            5                            6
        Food production              Food supply and              Food waste
        (including urban-rural       distribution
        linkages)

In response to requests from many signatory cities for practical guidance on how to measure
the impact of their sustainable food policy processes and initiatives, the MUFPP monitoring
framework was developed by the Municipality of Milan, FAO and RUAF Foundation with
input from a number of cities.
A PRACTICAL HANDBOOK FOR IMPLEMENTATION 3
In 2017, an initial long list of 91 indicators was reviewed by 14 cities. By 2018, a total of 44
indicators to support a monitoring process had been developed and the RUAF and FAO
team subsequently prepared methodological guidelines for each of the indicators. As a
next step in 2019, FAO and RUAF implemented a project to support three pilot cities to
begin implementing the MUFPP indicator framework. This project was coordinated by
RUAF partner, Laurier Centre for Sustainable Food System, and executed by two RUAF
Associates who provided technical and strategic support to the cities. Data research and
this publication were also supported by the CGIAR Research Program on Water, Land and
Ecosystems, led by RUAF partners International Water Management Institute (IWMI) and
Mazingira Institute in Nairobi.
All related documents are available online to help cities wishing to implement such a
monitoring system for their food policy. These include the monitoring framework (a
template that requires customization to the local situation), all 44 indicator methodological
guidelines, the tools presented through this handbook and reports from the piloting cities
(see section 7 and URL links throughout this handbook).
THE MILAN URBAN FOOD POLICY PACT
MONITORING FRAMEWORK
CA6144EN/1/09.19
© FAO, 2019
The MUFPP monitoring framework booklet
http://www.fao.org/documents/card/fr/c/CA6144EN/4
3
Objectives and summary of the pilot project
This pilot project took place between April and October 2019. There were four main
objectives of the MUFPP monitoring framework pilot project:
f Develop a better understanding of how to work with the MUFPP indicators
f Plan and implement work on a small number of indicators as a first step towards
using the monitoring framework
f Pilot a supported peer-to-peer learning approach
f Share practical learning with other cities
The MUFPP monitoring framework pilot project team, October 2019A PRACTICAL HANDBOOK FOR IMPLEMENTATION 5
In discussion with FAO, MUFPP Secretariat and RUAF, it was decided that the pilot should
focus on Global South MUFPP cities that typically have fewer available resources to conduct
this type of research. Another reason for this decision was to explore the extent to which
the monitoring framework is relevant to cities in the Global South.
Following a call supported by ICLEI-Local Governments for Sustainability, C40 Cities, RUAF,
FAO and MUFPP secretariat to potentially interested cities, Nairobi (Kenya), Quito (Ecuador)
and Antananarivo (Madagascar) were chosen.
Three contrasting pilot cities were selected based on a number of criteria, including their
capacity to assign staff to the project over the six months, and a stable political environment:
I. Previous engagement in the indicator work and participation in the development of
the framework
II. Cities committed to co-invest and allocate human resources able to work in English
III. Availability to work with local stakeholders in a tight timeframe
IV. Global South
V. Different size of cities
VI. Existing parallel initiatives/projects to create synergies
VII. Existing working relationships that enabled rapid engagement and trust
Following a two-day training workshop in Rome at the start of the project, the pilot process
followed an emergent design approach where RUAF consultants worked with cities to
identify their needs, developing timelines and activities to help them get the most out
of the pilot phase. See Annex A for stages that emerged during the pilot. Throughout the
pilot period, RUAF consultants communicated regularly with individual cities and ran group
discussion sessions to facilitate co-learning.Data collection for the Nairobi pilot project
4
Tools and methodology
Before getting started: Despite being MUFPP signatories, one of the biggest challenges
faced by the pilot cities was the need to constantly explain the value of working with the
Milan Urban Food Policy Pact to colleagues, managers and wider stakeholders.

To secure buy-in from senior decision-makers for the research, the pilot cities found it
helpful to highlight the international credibility of the MUFPP and its monitoring framework
supported by FAO. Emphasizing the number of other cities that have endorsed the Pact can
be a useful selling point to gain authorization to proceed. It is important to ensure that the
indicator research process is entrenched in local government decision-making. This could
mean having the work based in existing units. For example, in Nairobi the research team
was embedded within the Food System and Sector Programme Directorate. In Quito, staff
worked directly with the Agri-Food Pact of Quito (PAQ) to endorse the final set of pilot
indicators. Pilot cities emphasized the inclusion of different sectors and disciplines at all
stages of the process. In this way, the indicator research was a useful vehicle to leverage
new partnerships and strengthen existing ones. In addition there was a need to work with
a stakeholder group; the nature of these varied across the pilot cities.

 TOP TIPS      Start by explaining MUFPP to colleagues

  f   Before going any further, first explain to colleagues, managers and stakeholders
      about the existence, purpose and relevance of the Milan Urban Food Policy Pact
      and its international credibility

  f   Can this be done within an existing stakeholder platforms or meeting?

  f   Do you need to establish a core group, or speak with individual stakeholders
      bilaterally, or organise a wider food platform?

  f   If there is no existing group, is there support to develop one from a Mayor
      or city leader who signed the Pact; an active Council officer, or civil society
      organization(s); can you connect the Milan Pact with existing city policy or
      legislation?
8 THE MILAN URBANFOOD POLICY PACTMONITORING FRAMEWORK
Step 1. Preparatory thinking and key questions
While it is tempting to jump immediately to choosing indicators, actually this is NOT the
place to start. There are a number of other questions that need to be considered in advance
of preliminary indicator selection. The RUAF consultants provided a structured discussion
during the initial 2-day training workshop in Rome to help each city clarify and define their
own more specific indicator selection criteria. In order to develop these criteria, there was
a process of thinking and discussion that followed a series of questions. See Resource 1
Preparation Questions. Clarifying motivation is an important starting point.
EXAMPLE What does the city want to achieve by using
the monitoring framework?
Initial points from workshop discussion (see also Resource 4)
Nairobi
f Helping to clarify budget decisions
f How best to improve food safety and reduce contamination
f Confidence to talk about the status of the food system in a formal and evidenced
way
f To inform a food system strategy and its implementation
f To increase adoption of technologies (e.g. sack gardens, safe small-scale
pasteurization)
f To build M&E institutional capacity
Quito
f To raise awareness and implement coordinated actions
f To build cross-organizational collaboration
f To encourage citizen participation
f Land allocation and good use of public spaces and increased urban agriculture
using organic and agro-ecological practices
f Quantification and classification of organic waste and surplus foods
Antananarivo
f To help outline a strategy with clear priorities and outcomes (in time and space) –
and create a written document
f Consolidate the stakeholder network and work together on priorities
f Turn priorities into drivers of new action to bring more support to existing
initiatives
f Putting food onto the development agenda of the city (urban planning, etc.)
f Raise awareness of national government and donorsA PRACTICAL HANDBOOK FOR IMPLEMENTATION 9
TOP TIPS Preparation comes first
These three ‘starter’ questions are a good place to start for any city in preparing to use
the MUFPP monitoring framework.
1. What are your city’s priority areas for action?
2. What does your city want to achieve by using the monitoring framework?
3. When it comes to achieving outcomes and measuring progress, who is
accountable for what?
It may be too early in the process to make full use of Resource 6 and Resource 7, and you’ll
need to complete them in step 3. However, both may provide useful practical guidance
for structuring discussions with stakeholders. Resource 6 provides a simple process
for reviewing and connecting current activities with future plans and identifying what
measures of success would look like. This exercise could be done first, especially if a food
plan or strategy does not already exist. It could be used again in step 3 at the point where a
final set of indicators has been identified. Resource 7 is a worksheet template for gathering
in one place the most relevant indicators in relation to city priorities and actions and in
relation to the six MUFPP work categories. The recommended actions and indicators may
sound too high-level to be really useful, so it’s really important to first work out your city
priorities and then relate them to the monitoring framework.
Step 2. Developing indicator selection criteria
A recurring theme of the initial workshop in May 2019 was the question on which of the
44 MUFPP indicators the pilot cities should focus. None had the time or resources to use all
44 indicators. Some indicators were more relevant to each city than others. In discussing
this dilemma it became clear that selection criteria were required.
A core set of criteria were agreed to help cities select initial indicators on which to focus.
The key questions asked were:
f Does the indicator reflect a priority area of action for our city?
f Are there links with existing local, regional or national goals?
f Are data available and easy to access?
f Are there sufficient local resources to do this research?
f Will researching this indicator bring benefits to our city?
In addition to these criteria, the cities also considered how the findings of this initial
research stage might build momentum for future policy action. Another way of framing
this was to ask in relation to each potential indicator: “What research activities and data
collection are small enough to achieve, but big enough to matter?”10 THE MILAN URBAN FOOD POLICY PACT MONITORING FRAMEWORK
TOP TIPS Develop and communicate indicator selection criteria
f Agree a set of criteria to help with indictor selection.
f For example, cities should start by selecting a small number of indicators: i) that
reflect local priorities; ii) where data are likely available or easy to collect; and iii)
that are likely to be supported by key local stakeholders.
f You may wish to include other criteria based on discussions with your
stakeholders.
Having established the above core set of criteria, the next challenge for each of the three
cities was to agree and finalize more specific selection criteria after follow-up discussion
with local stakeholders. Each of the city reports explains this process.
The example from Antananarivo below illustrates how the indicator selection criteria was
further developed and linked to strategic interests.
EXAMPLE Antananarivo: most important indicator selection criteria
1. Relevance to the existing actions and existing data
2. Power of the indicator to help improve such actions and strategies
3. Sustainability of accountability (longer-term monitoring capacity)
4. Leverage capacity to boost partnerships and fundraising
5. Help to increase data availability within the City Council
Resource 2 is a practical worksheet co-designed during the Rome workshop that sets
out preliminary selection criteria to support further discussion with stakeholders and
preliminary indicator selection including a first stage consideration of potential data
sources. Resource 2a provides a worked example from Nairobi.
Step 3. Final selection of indicators
Having agreed and applied the selection criteria, the next step is to review the preliminary
long list of selected indicators and agree on a finalized set of indicators in discussion with
key stakeholders. Resource 7 can be used in a workshop to present or do further work on
preliminary or finalized indicators.
Resource 6 questions can help structure a process to reach a decision about which
indicators to use.A PRACTICAL HANDBOOK FOR IMPLEMENTATION 11
f Where are you now – evaluation of the current situation?
f Where do you want to be – what changes do you want to see, by when?
f How will you get there – what actions are necessary to achieve the result you want?
f How will you know you have got there – How will you measure success? What are
the indicators of success you will need to see as clear evidence?
Having worked through this process, the three pilot cities selected 4–12 indicators each.
In each case, there were further refinements of selection criteria that included a degree
of pragmatism (timescales, willingness of other stakeholders to share data, local capacity,
etc.). At this stage, it is also very important to finalize the wording of selected indicators
and customize where necessary. The indicators should be seen as a guide for developing
a set of measures that best fit each city’s context. The pilot cities found that most of the
indicators could be used as written but became much more meaningful after customization
in discussion with local stakeholders.
Taken together, a set of indicators will help to build up a clearer picture of what is happening
on the ground. Some indicators are quantitative – elements that can be counted like
numbers or percentages. Some are qualitative, where some degree of self-assessment is
needed.
Most qualitative indicators will tend to be binary and require a simple yes or no answer
so additional qualifiers should complement qualitative indicators and help to illustrate
progress over time. The indicator methodological guidelines (see section 7) provide
examples of additional evidence of implementation that could be reviewed. For example
MUFPP indicator 2: ‘Presence of an active multi-stakeholder food policy and planning
structure’. Further qualifiers could include assessment of multi-stakeholder representation;
the group’s functioning and effectiveness or specific impacts. Using qualitative indicators
can in turn help to highlight or define areas for improvement.
A shared city discussion with RUAF consultants at this point in the process highlighted
some useful learning to share with other cities.
TOP TIPS City-to-city advice on selecting final indicators
f Match local priorities (including customizing MUFPP wording)
f Get endorsement from key local stakeholders
f ‘Small enough to achieve but big enough to matter’
f Check data availability
f Quantitative vs qualitative indicators – keep a balance between both types.
f Qualitative indicators tend to be binary so should include qualifiers (additional
questions relating to effectiveness or impacts)
f The key selection criterion is that selected indicators should, in turn, be ‘drivers
of action’.12 THE MILAN URBAN FOOD POLICY PACT MONITORING FRAMEWORK Resource 3 lists each of the pilot cities’ final set of indicators and where indicators were customized. FIGURE 1 Summary of the range of selected indicators by the pilot cities Categories Antananarivo (6) Nairobi (12) Quito (4) Food governance #1 #3 #2 Sustainable diets and nutrition #14 #11, #12 #14 Social and economic equity #20 #20, #23 Food production #27 #26, #30 Food supply and distribution #36 #36, #37, #39 Food waste #41 #33, #43 #42, #44 Details on the full indicator selection process in each pilot city are explained in the city reports and MUFPP Montpellier Gathering 2019 presentations. See Antananarivo [English report, section 2] [French report, pp.12&13] and [presentation slides 2–4]; Nairobi [report, section 2] and [presentation slides 4–6]; Quito [English report, section 4] [Spanish report, section 4] and [presentation slide 2]. Step 4. Working with the indicators Initial planning – who to involve, where to find data RUAF consultants supported the pilot cities in working through a further set of questions aimed at shedding light on how to develop plans for data collection and analysis. In this discussion, all three cities highlighted some significant challenges, the most immediate related to proceeding with limited funding and staff capacity and the continued need to be pragmatic. They felt that a major challenge, even as MUFPP signatory cities, might in fact be related to the wider process of the city implementing the MUFPP recommended actions and the process of engaging others in this work; most importantly, making the case to local decision-makers/leaders that food should be a priority issue. There was recognition of the need for results of the indicator monitoring to be communicated effectively to local stakeholders and some thinking ahead on how to link the data to stories that will motivate action. Resource 4 lists questions that any city could use and summarizes important considerations and reflections from this discussion between pilot cities at the initial training workshop.
A PRACTICAL HANDBOOK FOR IMPLEMENTATION                                                     13

  TOP TIPS      Top tips: Working with the indicators – some challenges

  f   The challenge of finding ways to connect well and work effectively with and
      within local government departments is as important as gathering and analyzing
      data, if not more important (in the longer term).

  f   It may well be that initial limited/poor/incomplete data sets will pave the way for
      improvements in time; therefore, start from where you are now, using what you
      have.

  f   You may need to further customize your indicators in relation to data gaps.

  f   Take time to formulate some clear research questions in relation to selected
      indicators and then think through where you might find useful data and in what
      ways that data will be useful.

  f   Ensure that staff have sufficient skills and capacity to undertake the analyses.

  f   Start a dialogue with key stakeholders (especially within the municipality with
      relevant departments or elected people) on how to ensure that the data and
      linkages developed out of this process can be built upon in future efforts and
      not just disappear after an initial phase on the establishment of a monitoring
      framework.

  f   Seek partnerships with academic, consultancy and government contacts to share
      learning, skills and build capacity whenever necessary.

As part of the process of identifying which potential indicators to work with, and what
that might entail, each city scoped out draft plans for data collection and analysis using
Resource 8 (Worksheet for planning work with indicators). This practical worksheet
(adapted from work done by the city of Toronto) is designed to help gather information
on existing activities, stakeholders, existing data and data sources in relation to the most
relevant indicators. All of this is important to do before launching into the next stage of
research and data collection.

Connecting the selected indicators to clear research questions
Clearly formulated research questions and research approaches are needed at this stage
to guide data collection. In order to clarify what data to collect, the indicators need to
be translated into clear research questions. Qualitative indicators and the need for self-
assessment qualifiers that need to be turned into research questions have already been
discussed in step 3. A quantitative indicator will translate into a research question that asks
about numbers or percentages. However, this number on its own may not be very helpful
and needs more contextualizing with some further research questions that might help
explain WHY the number or the situation is as it is, or WHO might be affected in what ways.
14 THE MILAN URBAN FOOD POLICY PACT MONITORING FRAMEWORK
For example, Quito selected indicator 42: Annual number of events and campaigns aimed
at decreasing food loss and waste. The number of annual events and campaigns needed
further qualitative information from local stakeholders:
a) What initiatives are there?
b) Who are they targeting?
c) How do they work?
d) Who are the main donors?
e) Where are the groups of beneficiaries, their scope and relevance?
Quito used Resource 6 to work with the final set of four indicators and help structure
a discussion on how to approach further research and data collection, as illustrated in
Resource 6a, a worked example from Quito. This included formulation of some research
questions.
EXAMPLE Planning the research
“For Quito, it was useful to use the Resource 6 template, even though we had a
somewhat advanced process. We believe that in order to use the tool well it is necessary
to complete some other thinking first:
f Learn about the actions of the Milan Pact.
f Know the situation of the food system in your city.
f Define what things you want to change or what things you will prioritize to
start working towards that change.
f It is necessary to analyze the MUFPP indicator framework and find coherence
between what you need to change and how to measure that change.
Filling out the template allowed us to have an orderly idea of the situation or starting
point in which we are and where we want to go, how we are going to do it and how we
are going to measure it.” (Alexandra Rodriguez, Conquito)
Data collection methodology
Details on how each city collected data (primary and secondary), how they undertook
analyses, how they dealt with data gaps and other challenges, and how they involved
stakeholders are explained in the three city reports and MUFPP Montpellier Gathering
2019 presentations. Simple methodology including mapping (identification) of actors in the
food system, semi-structured interviews, online surveys and participatory workshops were
used. See Antananarivo [English report, section 3], [Not developed in the French report]
and [presentation slides 5–6]; Nairobi [report, section 3] and [presentation slides 4–6];
Quito [English report, section 5], [Spanish report, section 5] and [presentation slide 3].A PRACTICAL HANDBOOK FOR IMPLEMENTATION 15 Survey to collect primary data: Nairobi carried out a census of fresh fruit and vegetable outlets in two sample areas of the city for which population figures are available: one low- income and one high-income (Indicator 36). It was all done in two days, with extension agents from those areas deployed to count. A special one-page survey form was designed. The City Food and Agriculture staff members, known in the communities, could discretely note the number of outlets in batches of five. Forms were labelled according to areas known to local community health workers and the City’s monitoring team supervised the count. The Nairobi team developed a reporting template for summarizing findings on each of their selected indicators, Resource 10. Focus groups or workshops on specific issues: Mazingira Institute undertook additional stakeholder participation work with the Nairobi urban farmers network in January 2020 to specifically look at the city’s selected indicators in terms of gender and climate change. They used as a reference the report on Gender and the MUFPP monitoring framework developed by Laine Young in February 2019, (Resource 11). Resource 12 sets out the Nairobi approach to reviewing gender and climate change sensitivity of selected indicators. Stakeholder interviews: New research on food waste and surplus reuse was undertaken in Quito by consultants. Quito found the indicator framework useful as a basis on how to start data collection but that further analysis with stakeholders was also very important. Quito’s analysis of indicators was done with a ‘trajectory of change’ approach, using data collection to enable increased engagement but also to enrich findings by gaining a better scope of the situation. As in the case of Nairobi above, Quito found that a second level of analysis with the stakeholders who were involved in generating the information, was both empowering and necessary. This allowed for more in-depth discussions of stakeholder perspectives, their needs for connection with other actors and their proposals for how to address the problems. They found this process helped determine transformation or change pathways. reminder Methodological guidelines describe how to use each of the 44 indicators. Resource 9 sets out for each of the pilot cities a useful summary of: i) key steps in the process they went through over the project period of seven months; ii) key issues that arose and had to be addressed and; iii) the approaches that were taken to collect indicator data. Resource 10, an indicator report template, was created by the team in Nairobi in advance of the start of the research work with the dual purposes of both guiding the research and structuring the final indicator analysis reports. This approach could be used easily adapted by other cities.
16                                          THE MILAN URBAN FOOD POLICY PACT MONITORING FRAMEWORK

  TOP TIPS       Research and data collection approaches

     f   Use your selected indicators to formulate further research questions that help
         explain why the number is as it is, or who might be affected in what ways.

     f   Consider how to reflect a diverse representation that could enrich the research
         with fuller, more equitable data (disaggregated data by gender and other
         relevant social categories).

     f   Consider including more in-depth discussions with key stakeholders (interviews
         or focus groups).

     f   Consider how to best collect research findings in a way that enables analysis
         (survey design, data collection/reporting templates).

Step 5. Achievements and making use of findings

Once the data are available, the next challenge is to reflect on what has been learnt. All the
indicator results need to be explained. The process of working with the indicators will have
also generated learning. Reflection on both of these is important.

Key messages on what has been learnt need to be articulated and communicated. For
example: overall view on gaps and the need for further food policy implementation; the
need to develop additional data; the need to follow-up initial results and develop targeted
action; the value of collaborative working; the need for, or evidence to support a case for
future food system governance structures, etc. Clear learning points could be compiled
into a booklet or leaflets for wider circulation; disseminated to relevant policy-makers and
perhaps to the media; used in discussion forums, local and international meetings.

Data findings
Findings and results of research and data collection are outlined in each of the city reports.
See Antananarivo [English report, section 4], [French report pp.13–24] and [presentation
slide 5]; Nairobi [English report, section 4] and [presentation slides 4–8]; Quito [English
report, section 6], [Spanish report, section 6] and [presentation slides 4&5].

All three cities used workshops for this purpose and found visual ways to present the
data. Quito and Antananarivo turned research findings into infographics, see Resource
13. It is important to validate the results and findings with stakeholders, to sense-check
them and to discuss next steps. The pilot cities agreed that the indicator research was an
important step in bringing about positive change but that information itself was unlikely to
motivate policy-makers. Therefore, key insights and narratives needed to be drawn out of
the research and tailored to key audiences.
A PRACTICAL HANDBOOK FOR IMPLEMENTATION 17
TOP TIPS Communicate results
f Develop a plan early on for communicating the results of the research
f Once the data collection results are available, reflect on what has been learnt
(both from the indicators themselves and also from the process of working with
them)
f Identify and articulate clear messages
f Decide how to make best strategic use of the information and how to
communicate it clearly to relevant stakeholders, visually if possible (dashboard,
infographics).
Data drives action
f Action plan: The workshop in Antananarivo used the data as ‘a driver for
the development of an action plan’. It attracted 40 food actors including
representatives of local, regional and national authorities, NGOs and the private
sector and established six working groups to further define outcomes and
concrete actions. This set the agenda for the next Antananarivo Food Policy Council
meetings. See [English report, section 5] [French report, pp.13–24]. The added
value here was in presenting a set of data that provided a bigger and more holistic
snapshot across the urban food system – a critical first step of a longer-term
process from which food policy could be developed.
f Monitoring: The Nairobi report discusses how to make use of each of the
indicator findings in turn and states the intention to continue i) to build on the pilot
experience, gradually working through all 44 indicators; and ii) to institutionalize
the inter-sectoral collaboration through the Cross-Sectorial Consultative Group
possibly as a steering committee on implementation and monitoring of the Nairobi
food policy.
f Gender and climate change: Following a workshop to review the indicators
through a gender and climate change lens, organized by Mazingira Institute
with the Nairobi and Environs Food Security, Agriculture and Livestock Forum
(NEFSALF) – an independent network of food producers and processors in and
around the city – a new work plan was outlined to move forward in collaboration
with the city. The goal is to further enhance food production and marketing that
addresses women’s and men’s roles and climate change mitigation in Nairobi’s
food system. Discussion with NEFSALF members also focused on the Nairobi city
finding that urban agriculture mitigates climate change through recycling organic
waste effectively. Various practical actions were discussed with the City Agricultural
Extension staff (see Resource 12).18 THE MILAN URBAN FOOD POLICY PACT MONITORING FRAMEWORK
f Baseline data: For Quito the studies generated evidence and baseline data as
well as data gaps, to inform and support decisions around where and how to focus
effort to achieve change. This in turn supported the actors in their daily struggles,
recognizing their knowledge, priorities and convictions. The findings will also
be used to argue the need for other subsequent studies and the use of various
regulatory instruments of the city.
Reflections on non-research benefits of working with the monitoring framework
In addition to specific indicator data results and findings, it is important to reflect on
wider achievements and the impact of the process. How has working with the monitoring
framework been beneficial? Has it led to new ways of working, or new collaborations, or
new insights?
Beyond the research outputs of each pilot city, the process yielded additional benefits
that hopefully will support both ongoing food system monitoring and also new actions (as
mentioned above). All three cities noted that the project helped raise awareness of food
system priorities among stakeholders. Having an internationally recognized framework
tool also added credibility to the process and helped in securing endorsement from senior
decision-makers to participate.
The process of data collection and analysis required significant coordination of government
and external stakeholders which led to a strengthening of partnerships and/or a greater
awareness of the need for mechanisms to engage food system stakeholders more
effectively. Engaging staff in the indicator analyses also helped build capacity within local
government for food system monitoring. For example, it was a new experience for some
members of the Nairobi secretariat that oversaw the data collection and they commented
on the benefits of cross-departmental work and the invaluable new opportunity to share
insights and combine expertise to uncover new solutions. See pages 14–16 of the published
MUFPP monitoring framework for further reflections from all three pilot cities.
EXAMPLE Reflections from Antananarivo on wider achievements
and learning
f The pilot process revealed a lack of coordination between food system sectors
f Many research and data collections exist but there is a lack of actions and
strategies
f Most stakeholders are keen to join the local Food Policy Council – so the process
of working with the indicators has led to highly valuable stakeholder engagement
f It will be important for the data collection and analysis work to continue in order
to be useful
f Most importantly, the indicators are a driver for action, revealing a huge
opportunity for further projects related to each indicator.5 Challenges of using the MUFPP monitoring framework The pilot cities encountered a few issues related to the framework itself but the primary difficulties stemmed from accessing adequate data. Quito’s challenges are summarised below. See also Antananarivo [English report p.12] [French report, pp.13–24 subsection ‘Défis’ for each indicator]. FIGURE 2 Summary of challenges for the city of Quito
20                                          THE MILAN URBANFOOD POLICY PACTMONITORING FRAMEWORK

Perception of the framework and the need for local customization

During the initial phase of the pilot, city staff perceived the framework as a rigid assessment
tool and had difficulty with some indicators that didn’t seem to reflect their local context.
We clarified that i) cities should select only the most relevant indicators and not try to
use them all; ii) the framework is an ever-evolving document and is a tool to help cities
achieve their own monitoring and evaluation goals. Therefore, we encouraged cities to
adapt indicators to suit their local needs. For example, Nairobi staff customized indicator
#11 (Number of adults with Type 2 diabetes) to include all forms of diabetes among adults
and children. As is the case with most cities, lack of staff time and funding was a common
barrier in working with the indicators (see Notes on selecting, customizing and working
with indicators, Resource 4).

Indicator data

Accessing sufficient data was the most common challenge throughout the pilot process.
Even though cities chose indicators based, in part, on easy access to existing information,
there were several challenges common to all cities.

Data Sharing

  f   Absence of up to date official data sources or existing datasets were of low quality
      or didn’t provide the specificity needed, e.g. stunting data didn’t disaggregate
      based on gender or region. Indicator 12 is ‘Prevalence of stunting for children
      under five years of age’. In Nairobi there is no nutrition and support assessment for
      children over 3 years.

  f   Government or other stakeholders were at times resistant to sharing required
      data, due to a lack of understanding about the purpose of data collection or
      concerns about use of the data.

  f   Lack of existing coordination of stakeholders, especially opportunities for different
      sectors and organizations to even meet.

  f   Mistrust among different levels of government blocking data access, again in
      relation to concerns over use of data, or loss of control.

  f   High staff turnover could make it difficult to access information given that the new
      staff were not familiar with the sources.
A PRACTICAL HANDBOOK FOR IMPLEMENTATION 21
Data collection for the Nairobi pilot project
Data Collection
f Lack of resources for primary data collection.
f Personal safety risk of sending staff to collect information; concerns about the
need for respondents to know and trust the information collectors (e.g. counting
food outlets in lower-income areas).
f Risk to staff in seeking out information that authorities may not want to expose
(e.g. possibility that corruption in the licensing of food markets could be exposed if
food environment indicators were studied in detail).
f Longer-term, the need to identify who is best placed to collect data and undertake
monitoring, e.g. Nairobi City County has a team of private-sector performance
auditors that could be empowered to incorporate monitoring of the MUFPP
indicators as part of their terms of reference. Alternatively, a centralized
monitoring and evaluation team at City Headquarters could do the work.
Data Analysis
f Lack of technical expertise in analyzing data and adapting the analysis to the
specific research question of greatest interest for the city.
f Need for a narrative to make sense of the data in relation to the wider urban food
system.The Milan Urban Food Policy Pact conference, Montpellier, 2019
23

6
Reflections from RUAF

Value of the MUFPP Framework in Advancing Food Systems Policy and Action

The MUFPP framework is a well-thought-out tool that covers a diverse range of food system
issues in relation to cities, providing a structure from which any city can develop its own
monitoring framework.

It has evolved alongside the City Region Food System programme indicator framework
and the indicators are used in a similar way [http://www.fao.org/in-action/food-for-cities-
programme/toolkit/crfs-assessment/indicator-framework/en/].

Prior to the pilot, the need for aspects of environment and gender to be more strongly
reflected was already acknowledged. This was again highlighted during the pilot by the city
of Nairobi, providing some practical examples of how to explore environment and gender
aspects using the MUFPP framework. In using this framework, cities need to ensure that
the indicators and targets do not ‘unintentionally homogenize the experience of urban
residents’ (Resource 11).

Although the framework is proving to be a practical research and evaluation tool, it is
important to acknowledge there are challenges to using the indicators, namely data
availability and the need for basic coordination and research resources. However the pilot
cities demonstrated that a first step is to gather existing information often held by different
organizations or departments, under one lens. This does not need to be a costly exercise.

We also know that lack of information is only one barrier to action for local governments
when it comes to addressing food system issues. Lack of awareness and opportunities to
engage or participate are also barriers to action. As an additional value to gathering useful
data, the pilot cities found the process of working with the framework enabled them to
increase stakeholder engagement and awareness.

An important complement to the framework would be more support for cities in increasing
effective knowledge transfer capacity. In other words, what are the most effective strategies
to disseminate the research findings to key stakeholders; how can cities translate data into
stories, narrative, or develop communication tools that inspire action? Experiences of the
pilot cities provide some practical ideas.
You can also read