The Landscape Fire Scars Database: mapping historical burned area and fire severity in Chile - ESSD
←
→
Page content transcription
If your browser does not render page correctly, please read the page content below

Earth Syst. Sci. Data, 14, 3599–3613, 2022
https://doi.org/10.5194/essd-14-3599-2022
© Author(s) 2022. This work is distributed under
the Creative Commons Attribution 4.0 License.

       The Landscape Fire Scars Database: mapping historical
               burned area and fire severity in Chile
         Alejandro Miranda1,2 , Rayén Mentler1 , Ítalo Moletto-Lobos3 , Gabriela Alfaro4 , Leonardo Aliaga1 ,
                Dana Balbontín1 , Maximiliano Barraza1 , Susanne Baumbach1 , Patricio Calderón1 ,
       Fernando Cárdenas1 , Iván Castillo1 , Gonzalo Contreras1 , Felipe de la Barra4 , Mauricio Galleguillos1,5 ,
         Mauro E. González1,6,7 , Carlos Hormazábal1 , Antonio Lara1,6,8 , Ian Mancilla1 , Francisca Muñoz1 ,
                   Cristian Oyarce1 , Francisca Pantoja1 , Rocío Ramírez1 , and Vicente Urrutia1
                            1 Center    for Climate and Resilience Research, (CR)2 , Santiago, Chile
                2 Laboratorio    de Ecología del Paisaje y Conservación, Departamento de Ciencias Forestales,
                                             Universidad de La Frontera, Temuco, Chile
                 3 Image Processing Laboratory, Global Change Unit, University of Valencia, Valencia, Spain
                            4 Industrial Engineering Department, University of Chile, Santiago, Chile
                        5 Facultad de Ingeniería y Ciencias, Universidad Adolfo Ibáñez, Santiago, Chile
       6 Instituto de Conservación, Biodiversidad y Territorio, Facultad de Ciencias Forestales y Recursos Naturales,

                                            Universidad Austral de Chile, Valdivia, Chile
          7 Center for Fire and Socioecosystem Resilience (FireSES), Universidad Austral de Chile, Valdivia, Chile
                             8 Fundación Centro de los Bosques Nativos FORECOS, Valdivia, Chile

                          Correspondence: Alejandro Miranda (alejandro.miranda@ufrontera.cl)

                                 Received: 17 February 2022 – Discussion started: 29 March 2022
                            Revised: 4 July 2022 – Accepted: 16 July 2022 – Published: 10 August 2022

      Abstract. Achieving a local understanding of fire regimes requires high-resolution, systematic and dynamic
      databases. High-quality information can help to transform evidence into decision-making in the context of
      rapidly changing landscapes, particularly considering that geographical and temporal patterns of fire regimes
      and their trends vary locally over time. Global fire scar products at low spatial resolutions are available, but high-
      resolution wildfire data, especially for developing countries, are still lacking. Taking advantage of the Google
      Earth Engine (GEE) big-data analysis platform, we developed a flexible workflow to reconstruct individual
      burned areas and derive fire severity estimates for all reported fires. We tested our approach for historical wild-
      fires in Chile. The result is the Landscape Fire Scars Database, a detailed and dynamic database that reconstructs
      8153 fires scars, representing 66.6 % of the country’s officially recorded fires between 1985 and 2018. For each
      fire event, the database contains the following information: (i) the Landsat mosaic of pre- and post-fire images;
      (ii) the fire scar in binary format; (iii) the remotely sensed estimated fire indexes (the normalized burned ra-
      tio, NBR, and the relative delta normalized burn ratio, RdNBR); and two vector files indicating (iv) the fire scar
      perimeter and (v) the fire scar severity reclassification, respectively. The Landscape Fire Scars Database for Chile
      and GEE script (JavaScript) are publicly available. The framework developed for the database can be applied
      anywhere in the world, with the only requirement being its adaptation to local factors such as data availability,
      fire regimes, land cover or land cover dynamics, vegetation recovery, and cloud cover. The Landscape Fire Scars
      Database for Chile is publicly available in https://doi.org/10.1594/PANGAEA.941127 (Miranda et al., 2022).

Published by Copernicus Publications.
3600                                                                  A. Miranda et al.: The Landscape Fire Scars Database

1   Introduction                                                   culties when using coarse-resolution products (Roteta et al.,
                                                                   2019; Ramo et al., 2021). This constitutes a significant bar-
Wildfires, as a natural phenomenon, have been a key compo-         rier to the proper understanding of local wildfire regimes and
nent of the terrestrial system for millions of years, shaping      highlights the need for a high-resolution wildfire database
biome structure and composition as well as influencing the         (Chuvieco et al., 2019). Recent efforts using Landsat images
Earth system’s cycles. Human activity has dramatically mod-        have led to the identification of annual burn probabilities per
ified natural wildfire regimes and is now the main driver of       pixel from which a database with a 30 m spatial resolution
their spatial and temporal patterns (Balch et al., 2017; Bow-      has been constructed that reaches back to the 1980s, but this
man et al., 2011). The changing fire regime has become an          has been done only for developed countries such as the USA
increasing threat to biodiversity (Kelly et al., 2020), agri-      and Australia (Goodwin and Collett, 2014; Hawbaker et al.,
cultural and timber production (Stougiannidou et al., 2020;        2017). However, recent computational advances and the free
de la Barrera et al., 2018), and rural/peri-urban communi-         availability of satellite imagery catalogs provide a promising
ties (Radeloff et al., 2018); it has also become a major con-      framework for mapping annual burned areas worldwide, at a
tributor to greenhouse gas emissions (Giglio et al., 2013).        spatial resolution of 30 m with Landsat and at a 20 m reso-
Recent estimates point to a global mean burned area of 337         lution with Sentinel-2, which would be a major step forward
to 423 Mha every year (Giglio et al., 2013, 2018). However,        in high-resolution wildfire database generation (Long et al.,
the geographical and temporal patterns of fire regimes and         2019; Ramo et al., 2021).
their trends over time vary locally depending on the source           In the case of Chile, the fire regime has been described
of ignition (Ganteaume and Syphard, 2018); climate charac-         mainly on the basis of the public wildfire database main-
teristics and their changes (Jolly et al., 2015; Duane et al.,     tained by the Chilean Forest Service (CONAF) as well as
2021); predominant land use and land cover (Butsic et al.,         with MODIS monthly burned area data, the latter of which
2015); railroad density (Amato et al., 2018); and firefight-       have been used only in the most recent studies (de la Bar-
ing, fire suppression and fire prevention capacity (Bowman         rera et al., 2018; McWethy et al., 2018). Evidence regard-
et al., 2011; Moritz et al., 2014). Additionally, each natural     ing burned areas and fire frequency is derived from data
or anthropogenic forcing factor differs in its impact on fire      with spatial resolutions between 500 m and 5 km (Gómez-
regime attributes (e.g., ignition, severity, burned area and in-   González et al., 2019; González et al., 2018). From these
tensity) across multiple spatial and temporal scales world-        large-scale datasets, it has been determined that fire fre-
wide (Ager et al., 2014; Balch et al., 2017; Fusco et al.,         quency is closely related to human footprint zones, such
2016). An understanding of fire regimes at a local level re-       as cities or other densely populated areas (Gómez-González
quires high-resolution, systematic and dynamic databases in        et al., 2019; McWethy et al., 2018), roads (Miranda et al.,
order to transform evidence into decision-making in these          2020), and agricultural or industrial forest plantation activ-
rapidly changing landscapes (Bowman et al., 2020).                 ities (Gómez-González et al., 2019; McWethy et al., 2018).
   Remote sensing provides the pre-, during and post-fire bio-     However, burned area also strongly interacts with climatic
physical information necessary for conducting fire-risk as-        conditions favorable to the spread of fires, especially warmer
sessment, fire detection and monitoring, assessment of fire        and dryer years associated with the El Niño–Southern Os-
impacts, and follow-up of changes in land cover trends af-         cillation, wet winters the year previous (Holz et al., 2017;
ter fire occurrence (Szpakowski and Jensen, 2019). Recent          Urrutia-Jalabert et al., 2018) and severe drought (González
public datasets and products have enabled a better under-          et al., 2018). Such conditions have been more prevalent
standing of global and regional wildfire patterns (Giglio et       and more frequent in recent years, with increasing temper-
al., 2016, 2018; Schroeder et al., 2014; Lizundia-Loiola et        atures and a general reduction in precipitation reported for
al., 2021). Although the principal active fire and burned area     the area since 1980 and a prolonged “megadrought” since
products contain information going back to the year 2000           2010 (Boisier et al., 2016; Garreaud et al., 2019). Fire igni-
(e.g., MODIS) with a spatial resolution in the best cases of       tion near human communities, favorable climatic conditions,
more than 250 m (Chuvieco et al., 2018), there is still a lack     and a lack of landscape or fuel management lead to increased
of high-resolution wildfire data, especially for developing        wildfire occurrence (Úbeda and Sarricolea, 2016). However,
countries (Chuvieco et al., 2019). Andela et al. (2019) cre-       this large-scale understanding may still be insufficient, espe-
ated a global dataset for the period from 2003 to 2016 that        cially for local applications such as fire spread modeling, fire
estimates the size, duration and propagation rate of individ-      severity estimation, landscape planning and design, ecologi-
ual wildfires with a spatial resolution of 500 m using MODIS       cal impacts and ecosystem resilience, or national greenhouse
products. Likewise, Artés et al. (2019), also using MODIS          gas emission estimation.
products, developed a global dataset to analyze fire regimes          An excellent opportunity for developing countries to
and fire behavior based on ignition dates and daily burned ar-     generate their own local and historical high-resolution
eas for individual wildfires. The large discrepancies between      databases of wildfire scars is provided by the Google Earth
local and global estimates of burned area occur mostly in          Engine (GEE) (Long et al., 2019). GEE is an open cloud-
the case of fires of less than 100 ha due to detection diffi-      computing platform for geospatial analysis that contains a

Earth Syst. Sci. Data, 14, 3599–3613, 2022                                         https://doi.org/10.5194/essd-14-3599-2022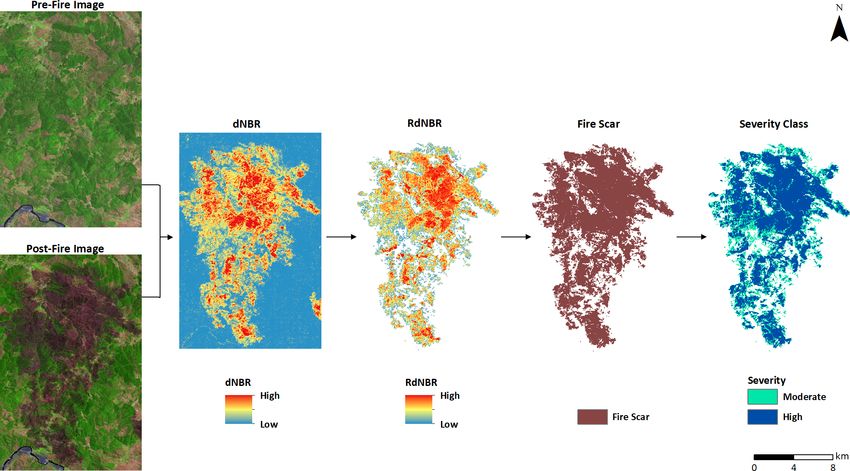
A. Miranda et al.: The Landscape Fire Scars Database 3601
public catalog of satellite images, topography, land cover 2.3 Fire scar generation
and other environmental datasets (Gorelick et al., 2017).
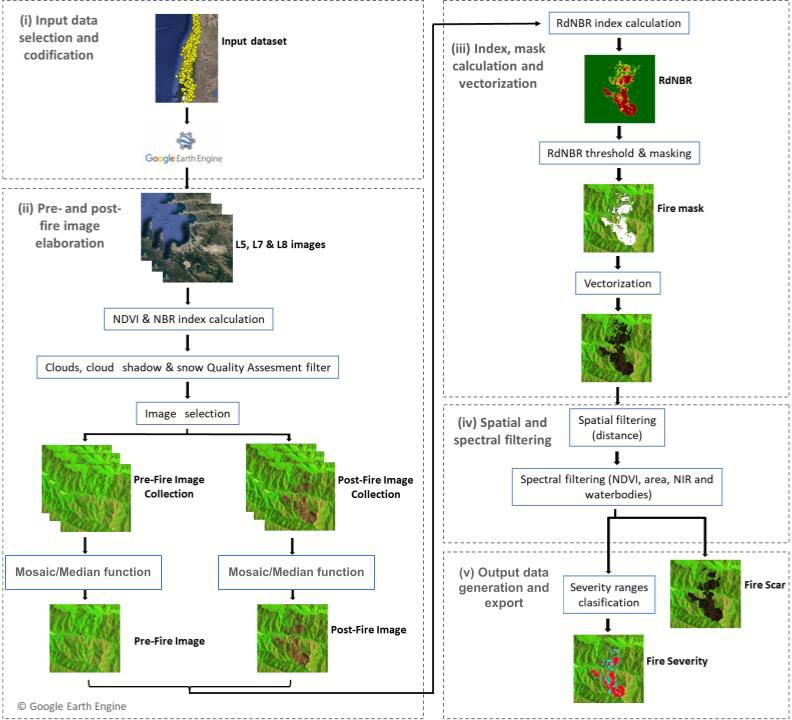
Taking advantage of this big-data analysis platform, we Our database was generated using JavaScript programming.
generate a detailed database of fire scars in Chile through The detailed workflow of the script developed to create
the development of a flexible workflow, enabling us to individual fire scars is shown in Fig. 1. It consists of
reconstruct individual burned areas and fire severity infor- the following consecutive steps: (i) input data selection
mation for all reported historical fires. The result is our and identification; (ii) pre- and post-fire image elaboration;
Landscape Fire Scars Database for Chile; this database and (iii) index, mask calculation and vectorization; (iv) spa-
the GEE script (JavaScript) used to generate it are publicly tial and spectral filtering; and (v) output data generation
available at https://doi.org/10.1594/PANGAEA.941127 and export. As noted earlier, we have made the GEE
and https://code.earthengine.google.com/ script available to all users as a tool that can be adapted
554027d16823525d890ab2f6c45167d9 (last access: to local conditions and used for permanent database up-
27 July 2022), respectively. This framework could be dating. The code is available at https://code.earthengine.
implemented for any geographical area globally, requiring google.com/554027d16823525d890ab2f6c45167d9 (last ac-
only that it be adapted to local conditions with respect to cess: 27 July 2022).
seed data availability, fire regimes, land cover or land cover The input data in Step (i) must be in point data form with
dynamics, vegetation recovery, and cloud cover. geographic coordinates representing the ignition point or a
point within the burned area. The points must indicate the fire
start date, the fire control date (fire spread end date) and the
2 Data and methods
estimated burned area. In the absence of the last two pieces
2.1 Study site
of information, we used the fire start date and a fixed burned
area of 100 ha as seed values for the initial assessment. The
The approach that we developed was applied to central and input seed data are converted into a list to process and ex-
southern central Chile (29–43◦ 50 S), a long stretch of terri- tract individual fire scars. Around each input point, a circular
tory encompassing 10 of the country’s administrative regions buffer area is created as a function of the estimated burned
(∼ 255 120 km2 ). Fire activity in Chile is concentrated in this area, with the precise dimensions given by Bufferradius =
area, where considerable changes in land use and land cover log(burnedarea)·2000. The buffer area is defined because we
have been observed in recent decades (Miranda et al., 2017), may only have the fire’s ignition point as a spatial reference.
associated with increased fire activity (González et al., 2018). Therefore, it is necessary to explore the area near this point
to find the limits of the fire scar. This could be an interactive
2.2 Data seeding
process depending on the burned area or the shape of the fire
scar.
To construct our historical database of fire scars, we used In Step (ii), two image collections (sets of images) are
a subset of the public wildfire database provided by the prepared for each wildfire, depending on the fire start date.
Chilean Forest Service (Corporación Nacional Forestal – We use the atmospherically corrected surface reflectance
CONAF). This agency records and stores information on the and orthorectified images from Landsat 5 – “LAND-
location, date, cause, affected area by land use, date and time SAT/LT05/C01/T1_SR” (1984–2013), Landsat 7 – “LAND-
of first control and suppression of fire, among other vari- SAT/LE07/C01/T1_SR” (1999–2021), and Landsat 8 –
ables, on all fires (> 0.01 ha). The georeferencing system “LANDSAT/LC08/C01/T1_SR” (2013–present), with one
used by CONAF until 2003 assigned each fire to the center image collection for a pre-fire condition and another for a
of a 1 km ×1 km alphanumeric grid, based on the subdivi- post-fire condition, all of which are available from the GEE.
sion of 1 : 50 000 scale Military Geographic Institute (IGM) To avoid conflicts in mathematical operations for pre- and
maps. After 2003, the location of each fire and estimation post-image collection generation, the date in day/month/year
of their burned area began to be carried out with the help of format is converted to Unix time format, which represents
Global Positioning System (GPS) information. Given the im- the number of milliseconds that have elapsed since Jan-
age availability, quality and spatial resolution of the Landsat uary 1970. Based on the fire start and control dates, the re-
programs, we extracted data only for fires with a burned area spective image searches for both pre-fire and post-fire events
of more than 10 ha between 1985 and 2018 (N = 13 603). are each conducted for a period of 100 d. If this proves insuf-
The 10 ha cutoff threshold was chosen because those fires ficient to get at least one image, the period can be extended up
represent more than 93 % of the burned area according to to 2 years for a pre-fire event and up to 6 months for a post-
the CONAF official information for the 1985–2018 period. fire event. However, a definition of the maximum period of
In addition, small fires are usually confounded with agricul- time must be chosen considering the local phenology, veg-
tural burning, a traditional cultural practice done by Chilean etation recovery or landscape dynamics, which are aspects
farmers. The original CONAF point dataset is included in our that could change the spectral response of the land surface
database. after fire. Pixels of snow, clouds and cloud shadows are ex-
https://doi.org/10.5194/essd-14-3599-2022 Earth Syst. Sci. Data, 14, 3599–3613, 2022
3602                                                                        A. Miranda et al.: The Landscape Fire Scars Database

Figure 1. Detailed workflow for individual fire scar generation in the Google Earth Engine. See Table 1 for details on the normalized burned
ratio (NBR) and the relative delta normalized burn ratio (RdNBR).

cluded from each image on the basis of the pixel quality band           al., 2019). Other burned area indexes have been proposed,
provided by Landsat and used as a binary mask of good and               and a combination of them may give the best results; how-
bad quality of the surface reflectance. For each image collec-          ever, to discriminate between burned and unburned areas, we
tion, we applied either the “mosaic” or the “median” reducer            opted for the relative delta normalized burn ratio (RdNBR).
function to get a unique image of the landscape conditions              This index has shown good results in Mediterranean areas
at moments as close as possible before and after a fire event.          (Miller and Thode, 2007).
This can be done by sorting the image by its date and obtain-              Step (iv) involved the selection of the RdNBR index value
ing the closer good-quality pixels. When the mosaic reducer             for each wildfire that best captures the burned area based on
did not provide good-quality pixels, we applied the median              visual interpretation. This is an interactive (fire-by-fire) pro-
reducer instead. The median method for reducing image col-              cess based on visual assessment of the best RdNBR value
lections avoids extreme values by selecting the median value            that delimitates each individual fire scar. The raster mask of
for each pixel.                                                         the burned area was converted to vector format for spatial and
   Using the final pre- and post-mosaic images obtained as              spectral filtering (Fig. 1). By vectorizing the initially identi-
outlined above, we then (in Step iii) calculated all of the             fied burned patches, spatial and spectral information could be
spectral indices (Table 1) used to identify the burned and un-          added to each one so that burned and unburned patches could
burned areas. The most widely used burned area index is the             be better distinguished using new criteria. This information
normalized burned ratio (NBR) and its multitemporal form,               included the mean normalized difference vegetation index
the delta normalized burn ratio (dNBR) (Lentile et al., 2006;           (NDVI) both before and after the fire event, the near-infrared
Fassnacht et al., 2021). These indexes reduce detection errors          (NIR) minimum value after the event, and each patch’s cal-
caused by shadows, waterbodies, agricultural or tree harvest-           culated area. The information added to the initial burned area
ing, flooding, and snowmelt (Chuvieco et al., 2019; Long et             patches could help to filter misclassified areas as burned ar-

Earth Syst. Sci. Data, 14, 3599–3613, 2022                                                https://doi.org/10.5194/essd-14-3599-2022
A. Miranda et al.: The Landscape Fire Scars Database                                                                                                  3603

Table 1. Description of the spectral indexes and formulas used in the workflow.

     Index                            Abbreviation        Formula                        Usage                              Reference
                                                          ρNIR−ρRED
     Normalized difference            NDVI                ρNIR+ρRED                      Detects pre- and post-fire vege-   Rouse et al. (1974)
     vegetation index                                                                    tation cover
                                                          ρNIR−ρSWIR2
     Normalized burned                NBR                 ρNIR+ρSWIR2                    Detects burned areas               Key and Benson (2003)
     ratio
     Delta normalized burn            dNBR                PreFireNBR − PostFireNBR       Detects changes in the NIR and     Key and Benson (2003)
     ratio                                                                               SWIR bands to identify burned
                                                                                         area and fire severity

     Relative delta normal-           RdNBR               PreFireNBR−PostFireNBR
                                                             √                           Normalizes changes by pre-fire     Miller and Thode (2007)
                                                               ABS(PreFireNBR)
     ized burn ratio                                                                     vegetation condition

NIR stands for near infrared, and SWIR represents short-wave infrared.

eas, thereby reducing commission errors. We also calculated                        ISO-REGION is the name of the administrative region based
the NDVI in order to estimate several vegetation parameters                        on the ISO 3166-2:CL norm; ID is the identification number
based on the red and infrared spectral bands (Table 1). The                        of the evaluated fire; THRESHOLD VALUE is the numerical
NDVI can be used to represent the current state of the compo-                      value of the RdNBR index used to separate burned and un-
sition, structure and phenology of vegetation as well as plant                     burned areas; and START DATE is the date used to find the
health and even burned vegetation; it can also be used to rep-                     first image previous to the fire, which will be the same as the
resent the changes over time in the abovementioned param-                          fire start date in day/month/year format (e.g., FireScar_CL-
eters (Helman, 2018; Pettorelli et al., 2005). Spatial filtering                   RM_ ID1920451_u330_19990215) in most cases. A detailed
begins by defining an initial search distance to the ignition                      description of each variable and its format is included as sup-
point of 1 km, although this distance can be interactively de-                     plementary material in the database metadata.
fined or modified later. The biggest patch within that distance
is then identified, and a new distance from this patch is de-
fined. Only the patches within this latter distance are con-                       2.4    Fire scar evaluation
sidered. At this stage, polygons or patches that may cause
commission errors are eliminated from the areas counted as                         We compared our fire scars with those generated by CONAF
burned in the preliminary mask. They may include (a) water-                        for the 2015–2016, 2016–2017 and 2017–2018 fire seasons
bodies with a pre-fire mean NDVI of less than 0.1, (b) poly-                       and published in Brull (2018). The aforementioned publica-
gons or patches for which the pre-fire mean NDVI is less than                      tion elaborated on a manual digitalization of the fire scar
0.1 (denoting a lack of vegetation), and (c) other filtering cri-                  perimeters using secondary information such as pre- and
teria similar to those proposed by Long et al. (2019). Each                        post-fire Landsat satellite images, the dNBR index, Visible
polygon or patch that satisfies the filtering criteria and has a                   Infrared Imaging Radiometer Suite (VIIRS) active fire data,
minimum area of 0.3 ha is retained. The filter values can be                       and Sentinel 2 images for high-resolution interpretation. The
changed to suit local conditions.                                                  fire perimeters were defined as the outer limit between the
   Finally, in Step (v), once the fire scar is delimited, the                      burned and unburned area in the landscape, but the unburned
event’s severity is calculated from the RdNBR in a con-                            areas inside this perimeter were not discounted in the final
tinuous raster format and categorized based on the sever-                          fire scars. Brull (2018) generated 194 fire scars, of which 78
ity category ranges proposed by Miller and Thode (2007):                           coincided with two criteria for making comparisons: (i) an
unchanged (< 69), low (69–315), moderate (316–640), and                            individual fire scar must be at a distance of at least 300 m
high (≥ 641). Our database also makes available the pre- and                       from another reported fire (by Brull, 2018), and (ii) the fire
post-fire NBR index for each image. Each fire scar and its                         must have the same name, start date and control as our seed
severity are exported in vector and raster format, along with                      data in order to avoid confusion. From 194 fire scars col-
the multispectral corrected Landsat images of pre- and post-                       lected by Brull (2018), 107 were within 300 m of another re-
fire events and the RdNBR index. The vector data contain                           ported fire, and the name and dates of fires did not match for
information about the fire record, the calculated area and                         9 fire scars. The mean area of the remaining 78 fire scars was
the spectral responses used for filtering. The output name of                      1180 ha (minimum area of 200 ha and max area of 12 250 ha).
each vector and raster file is OBJECT (FireScar, Severity,                         In order to avoid confusion between fire events, the evalua-
ImgPre, ImgPost and RdNBR) +_ISO-REGION_ID +_u-                                    tion was carried out for individual fires located at least 300 m
THRESHOLD RdNBR VALUE +_START DATE, where                                          from any other scar from the same season (according to the
                                                                                   date). The evaluation of the 78 fire scars itself was based on

https://doi.org/10.5194/essd-14-3599-2022                                                            Earth Syst. Sci. Data, 14, 3599–3613, 2022
3604 A. Miranda et al.: The Landscape Fire Scars Database
the index proposed by Singh et al. (2015) that compares two merge pre- and a post-fire images (ImgPreF.tif and Img-
georeferenced polygons using the closeness index (D): PosF.tif, respectively); three respective raster .tif images
with the shape of the fire scar that contain (1) zeroes
D (i, j ) = where there is no fire scar identified and ones where
q
(OverSegmentation (i, j ))2 + (UnderSegmentation (i, j ))2 , (1) a fire scar is identified (FireScar.tif), (2) zeroes where
there is no fire scar identified and severity index val-
where i is the reference polygon, j is the segment poly- ues (from one to three) to identify the severity where
gon, OverSegmentation (i, j ) = 1 − AAintersect (i,j )
, and Under- there is a fire scar (Severity.tif), and (3) the RdNBR
reference (i)
(i,j ) value (float numbers) for the points where there is a fire
Segmentation (i, j ) = 1 − AAintersect . Here, Aintersect (i, j ) is
segment (j ) scar (RdNBR.tif); and, finally, two vector shapefile im-
the common area between segment polygon j and the cor- ages that contain six files each (.shx, .shp, .dbf, .cpg, .fix
responding reference polygon i, Areference (i) is the area of and .prj), where one is the vectorized representation of
reference polygon i, and Asegment (j ) is the area of segment FireScar.shp, and the other is the vectorized representa-
polygon j . tion of Severity.shp with polygon and attribute informa-
In order to normalize the
values of D, we use the modifi- tion.
cation form Dnorm = 1− √D(2) , where Dnorm is the normal-
– For each set of resulting fire scar files, the ISO-
ization of D values between zero (non-matching polygons)
REGION_ID corresponds to the region assigned by the
and one (perfectly matching polygons).
original CONAF point dataset, and the START_DATE
To assess the accuracy of our framework, we include the
corresponds to the ignition point assigned by CONAF.
evaluation of commission and omission error calculated as
This was preserved to better identify the resulting fire
follows: commission error = FP/(FP+TP), and omission er-
scars with the seed database.
ror = FN/(FN+TP). Here, FP is the spatial explicit false pos-
itive area of the generated fire scar compared with the refer- – All raster .tif image files have the same area type and
ence polygon of Brull (2018), FN is the false negative area coordinate system. All pre and post-fire .tif images have
and TP is the true positive area. eight readable bands.
– For each fire, the pre- and a post-fire .tif images have the
2.5 Database quality control same width and height dimensions and the same exact
Even though the data generation process is done with stan- geographic extent. Moreover, their domain contains the
dard and stable GEE scripts, the project’s enormous scope fire scar’s ignition point and the resulting raster fire scar
could lead to involuntary discordances in resulting files. .tif images (FireScar.tif, Severity.tif and RdNBR.tif).
A thorough revision was performed over approximately The FireScar and Severity vector shapefiles files have
140 000 files, considering the three following major areas: consistent values in their attribute tables, and the num-
(i) file and layer naming, file readability and type and amount ber of polygons of the Severity vector image is equal
of files per fire scar; (ii) geographic locations and burned- or more than the number of polygons of the FireScar
area-related revision; and (iii) dates and season-related re- vector image. The dates in the attribute tables have the
vision. The approach was to define several tests regarding format YYYY-MM-DD, and the texts have UTF-8 en-
relations between the content and attributes of the files in coding. Original fire names that included diacritics (e.g.,
each area that the whole dataset should comply to. The re- ñ) were replaced by normal characters.
vision scripts were written in Python in the Google Co-
lab environment, with direct access to the Google Drive 3 Results
files generated by the GEE process. The tests were writ-
ten for our resulting database, but they are generic in most Using the data for all 12 250 fires recorded by CONAF be-
terms and assumptions and are available at https://github. tween 1985 and 2018 with a burned area greater than 10 ha,
com/cr2uchile/Quality_Control_FireScarCL (last access: 28 we were able to reconstruct 8153 fire scars, comprising
July 2022). Some of these tests led to human revision of the 66.56 % of the total registered fires (Table 2, Fig. 1). Suit-
fires, either regenerating them or removing them from the able images were found for 35 % of recorded fires for the pe-
fire scar database, and other tests led to automated fixes, like riod 1985–1994, 63 % of recorded fires for 1995–2004, 82 %
name change or attribute column and content changes in the of recorded fires for 2005–2014 and 93 % of recorded fires
vector files. The resulting database of 8153 fire scars com- for 2015–2018. The increasing trend evident in these per-
plies with the following statements: centages reflects how image availability has grown over time.
Smaller numbers of suitable images were found for the coun-
– All fires have a unique identifier and 17 related files, try’s southern regions (Los Ríos and Los Lagos), the wettest
including two satellite composite raster .tif images that and coldest areas included in our study, where cloud cover is
cover a domain larger than the identified fire scar and continuous for much of the year (Table 2).
Earth Syst. Sci. Data, 14, 3599–3613, 2022 https://doi.org/10.5194/essd-14-3599-2022A. Miranda et al.: The Landscape Fire Scars Database 3605
Table 2. Regional and temporal distribution of fires and reconstructed fire scars. The administrative regions are those included in the study.
The “Number of fires” column indicates the total number of fires recorded by CONAF for which the burned area was over 0.01 ha. “Yes”
denotes the number of reconstructed fire scars contained in our database, and “No” denotes the number of fire scars in the database that could
not be reconstructed due to the unavailability of satellite images.
Administrative Number of Number of Reconstructed fire Total fire scars Total fire scars Total fire scars Total fire scars Total fire scars
region fires fires > 10 ha scars > 10 ha (%) 1985–2018 1985–1994 1995–2004 2005–2014 2015–2018
Yes No Yes No Yes No Yes No Yes No
Coquimbo 1863 238 60.92 145 93 27 51 40 24 38 17 40 1
Valparaíso 31 857 1784 80.38 1434 350 400 160 352 40 425 140 257 10
Metropolitana 15 337 1109 85.75 951 158 208 79 252 42 261 33 230 4
O’Higgins 8249 1221 85.09 1039 182 240 93 251 56 365 26 183 7
Maule 14 475 1419 65.89 935 484 103 290 199 118 393 52 240 24
Ñuble and Biobío 77 704 3248 58.07 1886 1362 124 775 473 375 712 171 577 41
Araucanía 31 306 2369 57.41 1360 1009 30 458 346 356 424 131 560 64
Los Ríos 3680 339 35.99 122 217 8 154 41 48 33 10 40 5
Los Lagos 8416 523 53.73 281 242 5 100 53 111 143 27 80 4
Total 192 887 12 250 66.6 8153 4097 1145 2160 2007 1170 2794 607 2207 160
The total number of fires > 0.01 ha exhibits a positive 3.1 Fire scar evaluation
linear relationship with the total number of fires > 10 ha
recorded by CONAF between 1985 and 2018 (R 2 = 0.86). We evaluated the fire scars reconstructed using our approach
The number of recorded fires > 10 ha and the number of re- by contrasting them with the 78 scars derived from the offi-
constructed fire scars per region exhibit the same positive cial CONAF data that were suitable for making comparisons.
linear relationship (R 2 = 0.92), indicating that the distribu- A perfect match could not, of course, be expected given the
tion of the reconstructed data is regionally representative differences between the two methodologies. One particularly
(Table 2, Fig. 2). However, the pattern of relationships be- crucial difference is that the CONAF fire scar digitalization
tween recorded fires and reconstructed fire scars for the dif- includes patches that were actually not burned within the fire
ferent regions varies from period to period. For 1985–1994, perimeter for each fire event. These patches constituted any-
the relationship was weak (R 2 = 0.1), but it had strength- where from 13.5 % to 18.2 % of the area indicated as burned,
ened by 1995–2004 (R 2 = 0.91); the same pattern could depending on the fire season (Brull, 2018). Moreover, the
be seen again for 2005–2014 (R 2 = 0.93) and 2015–2018 CONAF digitalization was complemented by the agency’s
(R 2 = 0.93). The definitive version of our database is ordered own fieldwork, which improved the detection of low-severity
by region and fire season to facilitate exploration and analy- fires or surface fire under the canopy. Nevertheless, the global
sis, revealing, for example, the high levels of fire activity ar- accuracy assessment, derived from the closeness index and
eas near the coastal cities of Valparaíso and Concepción over calculated as the mean of the individual Dnorm , resulted in
the various decades (Fig. 3). a value of 0.79. Examples of the comparisons of our recon-
For each of the 8153 reconstructed fire scars, our database structed fire scars with CONAF data reported by Brull (2018)
contains the following: (i) a Landsat mosaic of pre- and post- are shown in Fig. 4 along with the respective Dnorm index for
fire event images (.tif) with eight spectral bands – blue, green, each case. Finally, we found a commission error of 7 % and
red, NIR, SWIR1 and SWIR2, NDVI, and NBR (Fig. 4); an omission error of 28 %.
(ii) the raster of the fire scar in binary format (.tif), where
one is the burned area and zero is the unburned area (Fig. 4);
3.2 Limitations and other observations regarding the
(iii) the RdNBR index, both in continuous values (.tif) and
Landscape Fire Scars Database
categorized by severity classification level, where zero is un-
changed, one is low severity, two is medium severity and The following points outline the limitations of our Landscape
three is high severity (Miller and Thode, 2007) (Fig. 4); and Fire Scars Database as well as other pertinent observations:
two vector files (.shp) containing (iv) the fire scar perimeter
and (v) the fire scar severity classification (Miller and Thode,
1. Our Landscape Fire Scars Database does not represent
2007). Layers of information are assigned to each individual
all of the fires recorded in the 1985–2018 period.
burned patch indicating its size as well as detected fire start
and control dates, and spectral data. NBR bands are available
for each image in order to enable reassessment of the fire scar 2. The reconstructed fire scars are mainly concentrated in
and its severity. A detailed description of each variable and the last 20 years of the abovementioned period, which
its format may be found in the database metadata. may be related to the improvement in image availability
over time .
https://doi.org/10.5194/essd-14-3599-2022 Earth Syst. Sci. Data, 14, 3599–3613, 20223606 A. Miranda et al.: The Landscape Fire Scars Database
Figure 2. Panel (a) shows the geographic distribution of the fire scar database, and panels (b) and (c) show examples of fire activity near the
cities of Valparaíso and Concepción for different periods.
3. Remotely sensed fire severity estimates the change in duplicated if they merged with another fire due to their
the spectral response in the burned area and must be proximity in space and time. We include a notification
carefully treated in the analysis of fires’ ecological im- in the database where this could have happened.
pact. Low-severity or surface fire may be underesti-
mated. 5. Commission errors may occur due to other land cover
4. Due to the 16 d interval between Landsat images, one changes such as tree plantation clear-cutting or harvest-
fire scar reconstructed from them may represent more ing of crops.
than one fire event in neighboring areas experiencing
multiple fires over that interval, especially in the case 6. In certain cases, the inclusion of additional available im-
of originally independent fire events that may have ages of pre- and post-fire events may help to improve the
merged. Thus, some fire scars in the database may be fire scars.
Earth Syst. Sci. Data, 14, 3599–3613, 2022 https://doi.org/10.5194/essd-14-3599-2022A. Miranda et al.: The Landscape Fire Scars Database 3607
Figure 3. The database content for each reconstructed fire scar. See Table 1 for details on the dNBR and RdNBR. The illustrated event is
from the Maule region and occurred in 2014.
Figure 4. Evaluation of the fire scars. Shown are three examples comparing fire scars from CONAF with the images reconstructed using our
Landscape Fire Scars Database methodology. See Sect. 2.3 for a detailed description of Dnorm.
4 Data availability that affected an area of over 10 ha. It contains data on fire
scar area, perimeter and severity, which are accessible to the
The Landscape Fire Scars Database for Chile can general public for analyzing future changes, improvements
be downloaded from the PANGAEA repository at and new evaluations. Furthermore, the methodology for gen-
https://doi.org/10.1594/PANGAEA.941127 (Miranda et erating these data was implemented in GEE so that others
al., 2022). may replicate our approach or apply it to other countries or
cases where no openly accessible datasets are currently avail-
able. Public institutions and researchers can take advantage
5 Discussion and conclusions
of this framework to generate long-term time series of fire
The creation of our Landscape Fire Scars Database for Chile scars for any years of interest or just for one particularly sig-
makes a high-resolution individual burned area product for nificant wildfire. The international community can replicate
the country publicly available for the first time. The georefer- this workflow using national fire occurrence data with the
enced database is a multi-institutional effort containing infor- minimum required information or with recently released data
mation on more than 8000 fire events between 1984 and 2018 on ignition coordinates, date and fire duration for more than
https://doi.org/10.5194/essd-14-3599-2022 Earth Syst. Sci. Data, 14, 3599–3613, 20223608 A. Miranda et al.: The Landscape Fire Scars Database
13 million individual fires worldwide that occurred between ample, NBR uses the near-infrared (NIR) and short-
2003 and 2016 (Andela et al., 2019). As a high-resolution wave infrared (SWIR) bands as proxies for the photo-
fire scar database, the Landscape Fire Scars Database should synthetic productivity and water content of vegetated ar-
be of much help in conducting accurate and systematic eval- eas (Lentile et al., 2006; van Wagtendonk et al., 2004).
uations of underlying wildfire forces, impacts and recoveries Both parameters are affected by fire; thus, the greater
as well as in delineating populations and biodiversity, pub- the temporal difference in the index, the greater the
lic policy, and informed territorial decision-making and plan- event’s severity. However, the spectral response of those
ning (Chuvieco et al., 2019; Long et al., 2019; Stenzel et al., bands may also be influenced by other factors. Forestry
2019). activity, especially tree plantation clear-cutting, defor-
Creating this database based on information distributed estation or harvesting on agricultural land as well as
over an extensive territory at a national scale using a single the drying of annual grassland in the summer season,
method presented diverse challenges with respect to (i) his- dried meadows and the cultural practice of burning agri-
torical image availability, (ii) land cover and land cover cultural wastes may all act to confuse the spectral re-
change dynamics, (iii) temporal image resolution and image sponse for a given landscape, assimilating them to wild-
cloud cover, and (iv) seeding datasets. In what follows, each fire (Ghermandi et al., 2019). Another local considera-
of these issues is discussed in turn. tion is the recovery rate of the vegetation. For example,
recovery is faster in the tropics than in temperate areas,
i. Historical image availability which could affect the mapping of burned areas or fire
GEE (https://earthengine.google.com, last access: 28 intensity estimation depending on how much time has
July 2022) provides free online access to original and passed between fire occurrence and the acquisition of a
corrected Landsat program data and products. Users do good-quality satellite image (Chuvieco et al., 2019). Lo-
not need to download the images, and the analysis and cal topography may also complicate the process of dis-
image modification are also carried out online, powered tinguishing burned areas in mountainous zones due to
by Google servers (Gorelick et al., 2017). Image avail- the increased presence of shadows, fog or melting snow
ability in the Landsat program is rather uneven across in cold or high-elevation areas (Huang et al., 2010; Still-
countries, with those in the developing world generally inger et al., 2019; Viale et al., 2019). Therefore, local
less well represented in terms of historical records. Nev- experience in landscape dynamics and practice is cru-
ertheless, the continuity of the image time series im- cial to ensuring the generation of accurate databases and
proves noticeably as the time period in question ap- may constitute a basis for adapting the most commonly
proaches the present. In the case of Chile, this pattern used burned area indexes to local realities.
of improvement is clearly evidenced in the fire scar gen-
eration success rates that we obtained for time periods iii. Temporal image resolution and image cloud cover
since the mid-1980s (1985–1994: 35 %; 1995–2004: Landsat images are widely used to study land cover
63 %; 2005–2014: 82 %; 2015–2018: 93 %), which are changes and trends due to their spatial and temporal res-
consistent with the availability of cloud-free pixels for olution (Soulard et al., 2016). However, the 16 d interval
the country (Fig. 5). This tendency must be considered between images could be a major limitation. In regions
when determining the time periods used to reconstruct with high fire activity, this can make it more difficult to
a database for any specific region. For example, accord- identify individual fire scars and differentiate them from
ing to the Landsat Global Archive Consolidation up- those produced on other days in neighboring locations.
dates (Wulder et al., 2016), availability and usable im- This means that a single final fire scar may in fact have
age quality are lower for Southern Hemisphere high- been created by multiple fire events occurring over the
latitude regions (Huang et al., 2010; Stillinger et al., 16 d period that converged or totally fused. This prob-
2019; Viale et al., 2019). lem could be mitigated by using Sentinel-2 images (also
available in GEE) for the earliest fire events, given that
ii. Land cover and land cover change dynamics the Sentinel-2 program is available from mid-2015 with
Almost 90 % of wildfire ignitions and burned areas a temporal resolution of 5–6 d (starting in 2017) and a
worldwide have anthropogenic origins (Ganteaume and pixel size of 10 and 20 m (e.g., SWIR band), although
Syphard, 2018). As a result, many of these fires im- the increased spatial resolution may raise another issue
pact the wildland–urban interface, urban and rural set- in that it could result in the underestimation of the influ-
tlements, and productive regions (e.g., agricultural lands ence of dead vegetation shadows on the spectral index
and tree plantations). Zones with high rates of land use signals (Fassnacht et al., 2021). The high temporal res-
or land cover change may present some difficulties in olution could also be helpful in zones with high cloud
fire scar and severity mapping. Remotely sensed burn cover such tropical and high-latitude or mountainous ar-
area indexes are based on the abrupt change in the pre- eas (King et al., 2013). For example, we observe that
fire spectral band values following a fire event. For ex- the Landsat archive in Africa could reduce its number
Earth Syst. Sci. Data, 14, 3599–3613, 2022 https://doi.org/10.5194/essd-14-3599-2022A. Miranda et al.: The Landscape Fire Scars Database 3609 Figure 5. The upper set of panels shows the available Landsat pixels over study area for each respective year from 1985 to 2018. The lower set of panels represents the number of available cloud-free Landsat pixels per year for the same respective years. https://doi.org/10.5194/essd-14-3599-2022 Earth Syst. Sci. Data, 14, 3599–3613, 2022
3610                                                                 A. Miranda et al.: The Landscape Fire Scars Database

    of cloud-free images (images with less than 40 % cloud             lection 6 burned area data, MCD64A1 (Giglio et al.,
    cover) to a mean of 25 %, with much fewer images in                2009); VIIRS active fire data (Schroeder et al., 2018);
    the tropical zone of the Congo Basin (Roy et al., 2010).           and Global Fire Atlas data (Andela et al., 2019; Giglio
    The RdNBR index is able to differentiate burned area               et al., 2018) can be used to evaluate the performance
    from non-burned area over a diverse range of climatic              of our approach for medium and large fires and to cre-
    and geographic conditions. No evident pattern associ-              ate new high-resolution datasets for mapping fire scars
    ated with the latitudinal or vegetation-type change was            in different ecosystems and under different land cover
    observed when applying the threshold value to identify             conditions.
    scars. In general, RdNBR performs wells when com-
    pared with field plots of severity. It is little influenced
                                                                  Author contributions. AM, RM, IM, MEG, AL, IC and MG de-
    by the type of forest and is determined mainly by the
                                                                  signed the study and database and were responsible for funding ac-
    fraction of consumed canopy cover (Cardil et al., 2019;       quisition. AM and RM managed the project and wrote the original
    Soverel et al., 2010; Fassnacht et al., 2021), demonstrat-    draft of the paper with contributions from all co-authors. AM, RM,
    ing the index’s high versatility. Nevertheless, the task of   GA, LA, DB, MB, SB, PC, FC, GC, FdlB, CH, IM, CO, FP, RR
    assessing the performance of the severity classification      and VU carried out the image interpretation, data processing and
    is left to users of the database, and it will depend on the   development of databases as well as providing different input on the
    local land cover context and field validations for identi-    manuscript and database. FM was responsible for the data curation
    fication of the best index. Our database does provide the     and database quality control.
    NBR band for the images in order to facilitate a compar-
    ison and evaluation of the dNBR and RdNBR indices.
                                                                  Competing interests. The contact author has declared that none
    The importance of the proposed database also stems
                                                                  of the authors has any competing interests.
    from its value as an input source for methods based on
    artificial intelligence (AI) aimed at automating the pro-
    cess of generating new fire scars. AI techniques (such        Disclaimer. Publisher’s note: Copernicus Publications remains
    as machine learning, ML; deep learning, DL; and, espe-        neutral with regard to jurisdictional claims in published maps and
    cially, the convolutional neural network, CNN) are in-        institutional affiliations.
    creasingly being used for classification or object seg-
    mentation problems (Alzubaidi et al., 2021). The inte-
    gration of such methods with remote sensing data is en-       Acknowledgements. Alejandro Miranda, Antonio Lara, Mauri-
    abling the development of burned area detection models        cio Galleguillos, Mauro González and Francisca Muñoz ac-
    that use manually (user-) delimited wildfire perimeters       knowledge funding from ANID/FONDAP (grant no. 15110009),
    as their training dataset. Promising results have been        and Alejandro Miranda is grateful to the ANID postdoctoral
    achieved using uni- or multi-temporal images and dif-         Fondecyt project (grant no. 3210101) and FONDEF-IDEA (grant
    ferent types of remote sensing data to address the many       no. ID20I10137) for financial support. The authors also wish to
                                                                  thank the Complex Engineering Systems Institute PIA/BASAL
    open challenges in wildfire mapping and monitoring
                                                                  (grant no. AFB180003). Mauro E. González is grateful to ANID/-
    (Hu et al., 2021; Knopp et al., 2020; Pinto et al., 2021).    Fondecyt (grant no. 1201528) and the Center for Fire and Socioe-
    In conclusion, we believe that the present study makes        cosistem Resilience (FireSES). The authors thank the Corporación
    a significant contribution to the development of high-        Nacional Forestal (CONAF) for providing the seeding and digital-
    resolution methods for mapping fire scars and their           ized fire scar data for database evaluation; they also wish to give
    temporal and spatial patterns. Our hope is that it will       special thanks to Jordi Brull and the hundreds of anonymous fire-
    serve as the first step in an ongoing effort to build         fighters and professionals who have observed, surveyed and devel-
                                                                  oped the CONAF official fire records since 1984. Finally, the au-
    and maintain an extensive, consistent database on for-
                                                                  thors wish to acknowledge the Chilean Institute for Disaster Re-
    est fires in Chile that will drive scientific research and
                                                                  silience (ITREND) for their support.
    improvements in landscape management. Further study
    is needed to broaden the current state of knowledge on
    local conditions through standardized field surveys.          Financial support. This research has been supported by ANID/-
                                                                  FONDAP (grant no. 15110009), ANID/Fondecyt (grant no.
 iv. Seeding datasets
                                                                  3210101), FONDEF-IDEA (grant no. ID20I10137), PIA/BASAL
    Studies in Chile have previously evaluated the perfor-        (grant no. AFB180003) and the Center for Fire and Socioecosys-
    mance of the global satellite burned area products show-      tem Resilience.
    ing good performance. A spatial resolution improve-
    ment of those products can be done using the fires de-
    tected by global datasets in Chile or another area as         Review statement. This paper was edited by Sander Veraverbeke
    the seed point. Global datasets such as MODIS Col-            and reviewed by three anonymous referees.

Earth Syst. Sci. Data, 14, 3599–3613, 2022                                         https://doi.org/10.5194/essd-14-3599-2022
A. Miranda et al.: The Landscape Fire Scars Database 3611
References burned area product based on MODIS 250 m reflectance bands
and thermal anomalies, Earth Syst. Sci. Data, 10, 2015–2031,
https://doi.org/10.5194/essd-10-2015-2018, 2018.
Ager, A. A., Preisler, H. K., Arca, B., Spano, D., and Salis, M.: Chuvieco, E., Mouillot, F., van der Werf, G. R., San Miguel, J.,
Wildfire risk estimation in the Mediterranean area: MEDITER- Tanase, M., Koutsias, N., García, M., Yebra, M., Padilla, M., Gi-
RANEAN WILDFIRE RISK ESTIMATION, Environmetrics, tas, I., Heil, A., Hawbaker, T. J., and Giglio, L.: Historical back-
25, 384–396, https://doi.org/10.1002/env.2269, 2014. ground and current developments for mapping burned area from
Alzubaidi, L., Zhang, J., Humaidi, A. J., Al-Dujaili, A., Duan, Y., satellite Earth observation, Remote Sens. Environ., 225, 45–64,
Al-Shamma, O., Santamaría, J., Fadhel, M. A., Al-Amidie, M., https://doi.org/10.1016/j.rse.2019.02.013, 2019.
and Farhan, L.: Review of deep learning: concepts, CNN archi- de la Barrera, F., Barraza, F., Favier, P., Ruiz, V., and Quense, J.:
tectures, challenges, applications, future directions, J. Big Data, Megafires in Chile 2017: Monitoring multiscale environmental
8, 53, https://doi.org/10.1186/s40537-021-00444-8, 2021. impacts of burned ecosystems, Sci. Total Environ., 637–638,
Amato, F., Tonini, M., Murgante, B., and Kanevski, M.: Fuzzy def- 1526–1536, https://doi.org/10.1016/j.scitotenv.2018.05.119,
inition of Rural Urban Interface: An application based on land 2018.
use change scenarios in Portugal, Environ. Model. Softw., 104, Duane, A., Castellnou, M., and Brotons, L.: Towards a comprehen-
171–187, https://doi.org/10.1016/j.envsoft.2018.03.016, 2018. sive look at global drivers of novel extreme wildfire events, Clim.
Andela, N., Morton, D. C., Giglio, L., Paugam, R., Chen, Change, 165, 43, https://doi.org/10.1007/s10584-021-03066-4,
Y., Hantson, S., van der Werf, G. R., and Randerson, J. 2021.
T.: The Global Fire Atlas of individual fire size, duration, Fassnacht, F. E., Schmidt-Riese, E., Kattenborn, T., and Hernán-
speed and direction, Earth Syst. Sci. Data, 11, 529–552, dez, J.: Explaining Sentinel 2-based dNBR and RdNBR
https://doi.org/10.5194/essd-11-529-2019, 2019. variability with reference data from the bird’s eye (UAS)
Artés, T., Oom, D., de Rigo, D., Durrant, T. H., Maianti, P., Lib- perspective, Int. J. Appl. Earth Obs. Geoinf., 95, 102262,
ertà, G., and San-Miguel-Ayanz, J.: A global wildfire dataset for https://doi.org/10.1016/j.jag.2020.102262, 2021.
the analysis of fire regimes and fire behaviour, Sci. Data, 6, 296, Fusco, E. J., Abatzoglou, J. T., Balch, J. K., Finn, J. T., and
https://doi.org/10.1038/s41597-019-0312-2, 2019. Bradley, B. A.: Quantifying the human influence on fire ig-
Balch, J. K., Bradley, B. A., Abatzoglou, J. T., Nagy, R. C., Fusco, nition across the western USA, Ecol. Appl., 26, 2390–2401,
E. J., and Mahood, A. L.: Human-started wildfires expand the https://doi.org/10.1002/eap.1395, 2016.
fire niche across the United States, P. Natl. Acad. Sci. USA, 114, Ganteaume, A. and Syphard, A. D.: Ignition Sources, in: Encyclo-
2946–2951, https://doi.org/10.1073/pnas.1617394114, 2017. pedia of Wildfires and Wildland-Urban Interface (WUI) Fires,
Boisier, J. P., Rondanelli, R., Garreaud, R. D., and Muñoz, edited by: Manzello, S. L., Springer International Publishing,
F.: Anthropogenic and natural contributions to the South- Cham, 1–17, https://doi.org/10.1007/978-3-319-51727-8_43-1,
east Pacific precipitation decline and recent megadrought 2018.
in central Chile, Geophys. Res. Lett., 43, 413–421, Garreaud, R. D., Boisier, J. P., Rondanelli, R., Montecinos, A.,
https://doi.org/10.1002/2015GL067265, 2016. Sepúlveda, H. H., and Veloso-Aguila, D.: The Central Chile
Bowman, D., Williamson, G., Yebra, M., Lizundia-Loiola, J., Petti- Mega Drought (2010–2018): A climate dynamics perspective,
nari, M. L., Shah, S., Bradstock, R., and Chuvieco, E.: Wildfires: Int. J. Climatol., 40, 421–439, https://doi.org/10.1002/joc.6219,
Australia needs national monitoring agency, Nature, 584, 188– 2019.
191, https://doi.org/10.1038/d41586-020-02306-4, 2020. Ghermandi, L., Lanorte, A., Oddi, F. J., and Lasaponara, R.: As-
Bowman, D. M. J. S., Balch, J., Artaxo, P., Bond, W. J., Cochrane, sessing Fire Severity in Semiarid Environments with the DNBR
M. A., D’Antonio, C. M., DeFries, R., Johnston, F. H., Keeley, and RDNBR Indices, Glob. J. Sci. Front. Res. H Environ. Earth
J. E., Krawchuk, M. A., Kull, C. A., Mack, M., Moritz, M. A., Sci., 19, 27–44, 2019.
Pyne, S., Roos, C. I., Scott, A. C., Sodhi, N. S., and Swetnam, T. Giglio, L., Randerson, J. T., and van der Werf, G. R.: Analy-
W.: The human dimension of fire regimes on Earth: The human sis of daily, monthly, and annual burned area using the fourth-
dimension of fire regimes on Earth, J. Biogeogr., 38, 2223–2236, generation global fire emissions database (GFED4): ANALYSIS
https://doi.org/10.1111/j.1365-2699.2011.02595.x, 2011. OF BURNED AREA, J. Geophys. Res.-Biogeo., 118, 317–328,
Brull, J.: Análisis de la severidad de los incendios de magnitud de la https://doi.org/10.1002/jgrg.20042, 2013.
temporada de incendios forestales 2017–2018, Sección de análi- Giglio, L., Schroeder, W., and Justice, C. O.: The col-
sis y predicción de incendios forestales. Corporación Nacional lection 6 MODIS active fire detection algorithm and
Forestal, Santiago, Chile, pp. 67, 2018. fire products, Remote Sens. Environ., 178, 31–41,
Butsic, V., Kelly, M., and Moritz, M.: Land Use and Wildfire: A https://doi.org/10.1016/j.rse.2016.02.054, 2016.
Review of Local Interactions and Teleconnections, Land, 4, 140– Giglio, L., Boschetti, L., Roy, D. P., Humber, M. L., and Jus-
156, https://doi.org/10.3390/land4010140, 2015. tice, C. O.: The Collection 6 MODIS burned area mapping
Cardil, A., Mola-Yudego, B., Blázquez-Casado, Á., and González- algorithm and product, Remote Sens. Environ., 217, 72–85,
Olabarria, J. R.: Fire and burn severity assessment: Cal- https://doi.org/10.1016/j.rse.2018.08.005, 2018.
ibration of Relative Differenced Normalized Burn Ratio Gómez-González, S., González, M. E., Paula, S., Díaz-Hormazábal,
(RdNBR) with field data, J. Environ. Manage., 235, 342–349, I., Lara, A., and Delgado-Baquerizo, M.: Temperature and agri-
https://doi.org/10.1016/j.jenvman.2019.01.077, 2019. culture are largely associated with fire activity in Central Chile
Chuvieco, E., Lizundia-Loiola, J., Pettinari, M. L., Ramo, R., across different temporal periods, Forest Ecol. Manage., 433,
Padilla, M., Tansey, K., Mouillot, F., Laurent, P., Storm, T., Heil, 535–543, https://doi.org/10.1016/j.foreco.2018.11.041, 2019.
A., and Plummer, S.: Generation and analysis of a new global
https://doi.org/10.5194/essd-14-3599-2022 Earth Syst. Sci. Data, 14, 3599–3613, 2022You can also read