The impact of the COVID-19 pandemic on the poor - Insights from the Hrishipara diaries
←
→
Page content transcription
If your browser does not render page correctly, please read the page content below

WIDER Working Paper 2021/46

The impact of the COVID-19 pandemic on the
poor

Insights from the Hrishipara diaries

Risto Rönkkö,1 Stuart Rutherford,2 and Kunal Sen3

March 2021

Abstract: In this paper, we examine the economic impact of the COVID-19 pandemic on the
livelihoods of the poor. We use an unusually rich data set from a ‘financial diaries’ study known as
the Hrishipara Daily Diaries Project. The data set tracks the economic and financial transactions
of 60 individuals and their families in a semi-rural setting in Bangladesh on a real-time basis from
October 2019 to September 2020. We document individual diarists’ behavioural responses to
COVID-19, which reveal the varied experiences of the poor during the pandemic. We find that
the pandemic and associated government lockdowns had significant negative effects on the
livelihoods of the poor in our study, with financial inflows and outflows, incomes, and household
expenditures below pre-pandemic levels during the pandemic period. To cope with the pandemic,
households drew down on their cash reserves at home, as well as cutting down on non-food
expenditures to protect their spending on food.
Key words: COVID-19 pandemic, lockdowns, diaries, livelihoods, Bangladesh
JEL classification: B40, I15, I32, O12
Acknowledgements: The authors acknowledge the insightful comments received from Mushfiq
Mobarak and Jonathan Morduch.

1UNU-WIDER; 2 Hrishipara Daily Diaries Project, Kapasia, Bangladesh;              3   UNU-WIDER and University of Manchester,
Manchester, UK, corresponding author: sen@wider.unu.edu
This study has been prepared within the UNU-WIDER project Transforming informal work and livelihoods.
Copyright © UNU-WIDER 2021
UNU-WIDER employs a fair use policy for reasonable reproduction of UNU-WIDER copyrighted content—such as the
reproduction of a table or a figure, and/or text not exceeding 400 words—with due acknowledgement of the original source,
without requiring explicit permission from the copyright holder.
Information and requests: publications@wider.unu.edu
ISSN 1798-7237 ISBN 978-92-9256-984-6
https://doi.org/10.35188/UNU-WIDER/2021/984-6
Typescript prepared by Merl Storr.
United Nations University World Institute for Development Economics Research provides economic analysis and policy advice
with the aim of promoting sustainable and equitable development. The Institute began operations in 1985 in Helsinki, Finland, as
the first research and training centre of the United Nations University. Today it is a unique blend of think tank, research institute,
and UN agency—providing a range of services from policy advice to governments as well as freely available original research.
The Institute is funded through income from an endowment fund with additional contributions to its work programme from
Finland, Sweden, and the United Kingdom as well as earmarked contributions for specific projects from a variety of donors.
Katajanokanlaituri 6 B, 00160 Helsinki, Finland
The views expressed in this paper are those of the author(s), and do not necessarily reflect the views of the Institute or the United
Nations University, nor the programme/project donors.

1      Introduction

Poor households in low-income agrarian societies face a variety of shocks to their livelihoods,
from economywide shocks such as increases in food prices to village-level climatic shocks such as
droughts and floods, and idiosyncratic shocks such as illness or death within the household
(Dercon 2002, 2004; Krishna 2010). Typically, poor rural households adjust to these shocks by
using a variety of coping mechanisms such as self-insurance through savings and informal risk-
minimization strategies, and borrowing from banks and microfinance institutions (MFIs),
moneylenders, and friends and family (Townsend 1994). However, rarely have poor households
in low-income societies faced generalized shutdowns of economic activity such as occurred during
the COVID-19 pandemic. The pandemic affected the economic life of poor households in low-
income rural societies through the direct route of the increased the risk of falling ill with the virus
if households went about their normal lives working on their farms and in the non-farm economy.
The pandemic also affected poor households’ livelihoods indirectly through the introduction of
draconian lockdown policies by national governments in developing economies, which shut down
economic activity for prolonged periods. Not only did lockdown policies lead to a cessation of
market and non-market economic activities, but they also led to the temporary closure of MFIs,
which effectively meant that households could not use the coping mechanisms to which they
would normally resort in times of crisis, such as loans and savings withdrawals. Furthermore, the
ban on movement within and outside the villages where they resided also meant that households
could not visit their extended families in search of financial support. 1 What was the effect of the
pandemic and associated lockdown policies on the livelihoods of poor rural households, and how
did these households cope during the pandemic? In this paper we examine the impact of the
pandemic on the livelihoods, incomes, expenditures, and financial transactions of 60 poor and very
poor households in a semi-rural setting in Bangladesh.

An emerging literature has begun to examine the effects of the COVID-19 pandemic on the
economic lives of the poor in developing societies (Ceballos et al. 2020; Egger et al. 2021; Kansiime
et al. 2021; Mahmud and Riley 2021; Malik et al. 2021; Schotte et al. 2021). These studies have
been able to provide a quantitative assessment of the effects of the pandemic, by asking households
retrospective questions on earnings and other economic data using phone surveys,
notwithstanding the well-known problems with recall methods in household surveys (Brzozowski
et al. 2017; Deaton 2003). 2 In this paper, we use an unusually rich data set that tracks the economic
and financial transactions of 60 individuals and their families in a rural setting in Bangladesh on a
daily real-time basis for 12 months, from 1 October 2019 to 30 September 2020. For the previous
five years these households had volunteered as respondents in a ‘financial diaries’ study known as
the Hrishipara Daily Diaries Project (HDDP 2021). The advantage of this data set is that it allows

1 While mobile banking is becoming increasingly popular in Bangladesh (see Lee et al. 2021), and most of the
respondents in the study on which this paper draws owned phones, the use of mobile banking to transfer money was
extremely limited among the 60 respondents, accounting for only 3.6 per cent of all inflow transactions, and a mere
0.2 per cent of all outflow transactions. The only cases where mobile banking was commonly used were for the receipt
of overseas remittances.
2 Exceptions are Gupta et al. (2021) and Janssens et al. (2021), who use weekly transactions data from rural households
in India and rural Kenya respectively to examine the economic impact of the COVID-19 lockdowns. They consider
the periods October 2019 to April 2020 and December 2019 to April 2020, which cover the pre-lockdown and
lockdown periods in India and Kenya respectively. In contrast to these studies, we use daily data, and we have a longer
period of analysis, extending into the post-lockdown months. See also Rahman et al. (2021) for a discussion of rapid
phone surveys as a means to collect data in the context of the COVID-19 pandemic in Bangladesh.

                                                                                                                     1
us to examine individual diarists’ behavioural responses to the pandemic with a granularity that is
not possible with large-scale phone surveys.

Our paper uses a mixed methods approach: we combine qualitative case studies of five diarists
with a quantitative analysis of the daily data extracted from the diaries. We use detailed transactions
data on incomes, expenditures, loans, savings, gifts received and given, and remittances to analyse
the impact of the pandemic (until September 2020), and in particular the government lockdowns,
on the economic and financial transactions of the 60 diarists. Our period of analysis covers six
months of the pre-pandemic period (October 2019 to March 2020), the two months when the
government of Bangladesh enforced a lockdown (April and May 2020), and four months after the
lockdown was lifted (June to September 2020). Therefore, our analysis covers both the pre-
pandemic and pandemic periods, allowing us to ascertain how the economic lives of the poor
evolved during the pandemic by comparing their incomes, expenditures, and financial transactions
in the pandemic period with the immediate pre-pandemic period.

We document the behavioural responses to COVID-19 by individual diarists, which reveals the
varied experiences of the poor during the pandemic. The case studies highlight the financial
hardship to which the pandemic contributed among the poor, as well as the different coping
strategies followed by the diarists. Further, we find from the quantitative analysis that the pandemic
had a significant negative impact on the livelihoods of the poor in our study, with financial inflows
and outflows, incomes, and household expenditures far below pre-pandemic levels in the
pandemic period, although expenditures did not decline as much as incomes. Exploring the coping
mechanisms that households used to adjust to declines in income and their lack of access to formal
and informal sources of finance, we find that households drew down on their cash reserves at
home, as well as cutting down on non-food expenditures to protect their spending on food.

The rest of the paper is in six sections. Section 2 describes the context of our study as well as the
history of the evolution of the pandemic in Hrishipara. Section 3 discusses the diary method used
to gather the data used in the study. Section 4 provides five case studies showing how individual
diarists coped with the pandemic. Section 5 introduces the quantitative data and provides an
empirical analysis of the impact of the pandemic on livelihoods in Hrishipara. Section 6 discusses
the coping mechanisms used by the diarists. Section 7 concludes.

2        Context

In this section, we describe the local context of our study and the evolution of the pandemic in
our study area.

2.1      Kapasia market town

Hrishipara is in Kapasia, Gazipur District, central Bangladesh. Kapasia is a moderately prosperous
market town of around 350,000 3 people lying some 50 kilometres north-east of Dhaka, the capital
(Figure 1). Hrishipara itself, where the diary project started, is a low-caste Hindu settlement of
about 3,500 people; 12 of our 60 respondent households live there. There is another cluster of 15
respondents, some Muslim and some Hindu, in Jelepara on the opposite bank of the river. The
remaining households live in or around Torgaon market and are mostly Muslim. Two households

3   Projected from 342,162 in the 2011 Bangladesh census.

                                                                                                     2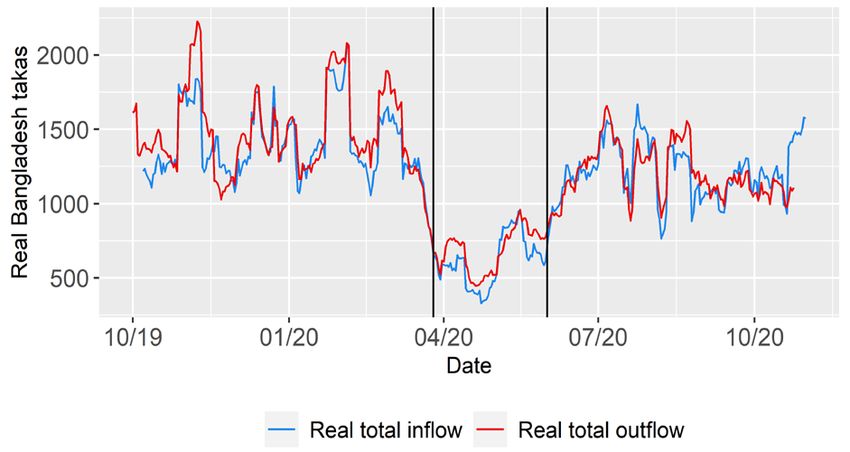
have left the Kapasia area and settled elsewhere, but the project continues to track their fortunes,
interviewing them by phone each day.
Figure 1: Location of the study

Note: clockwise from top left: Bangladesh, at the head of the Bay of Bengal; the location of Kapasia relative to the
capital, Dhaka; Kapasia, showing Hrishipara, Jelepara, and the Torgaon market area.
Source: Google Maps data © 2020.

Kapasia enjoys good road communications with the capital and other regional towns in central
Bangladesh. It stands on the Shitalokha River, which also links it to the capital, and which was
once—though is no longer—busy with barges. River flooding sometimes damages Hrishipara (it
did so again in August 2020), but the surrounding land is slightly elevated and escapes the flooding
that regularly affects about a third of Bangladesh each year. The town has government offices,
well-organized covered markets, a large government hospital, and several training institutions,
schools, and colleges—it has always had a good reputation for education. There are branches of
nationalized and private banks, and of insurance companies and their agents. All the national MFIs
work in the Kapasia area, alongside local MFIs and cooperatives. Shohoz Shonchoy, a small pro-
poor MFI cooperative whose staff run the daily diaries, is situated in Hrishipara. Politically,
Kapasia tends to vote for the Awami League, the party currently in power. In 1971, newly
independent Bangladesh’s first prime minister was from Kapasia.

Under the influence of local leaders, who say they wish to safeguard the environment, Kapasia has
not industrialized, and it lacks the garment factories that are changing many other towns on main
roads out of Dhaka, although some residents commute by bus to factories elsewhere. There are

                                                                                                                  3
some small-scale workshops, but only eight per cent of Kapasia’s people work in industry—about
half the national average. However, for many years Kapasia has exported workers overseas,
especially to Singapore and Malaysia, but also to the Gulf countries and even Europe. The money
that these workers send back, which is often invested in new homes, is changing the look of the
area, while the ideas and skills they bring with them when they return home are making the place
more worldly.
These features mean that, relative to other subdistricts in the country, Kapasia is doing moderately
well on economic measures and better than average on some social measures. Twenty-seven per
cent of its people are officially counted as ‘poor’, putting it in 229th place out of 554 subdistricts;
but two thirds of the poor are ‘extremely poor’, a higher proportion than in most other subdistricts.
On access to services such as electricity, water, and sanitation, its record is average. Mobile phone
connectivity is good and cheap, as it is in most of Bangladesh. Fifty-five per cent of the population
are literate, well above the national average; 86 per cent of its six-to-ten-years-olds are in school,
and the rate of secondary-level school completions is high. This mixed picture is well represented
by the project’s 60 respondents, of whom about a quarter are in ‘extreme poverty’ by international
standards.
2.2 The arrival of COVID-19 and lockdown
Bangladesh’s first confirmed cases of COVID-19—two returnees from Italy—were found on 8
March 2020. 4 Events then moved quickly. On 20 March 2020, the government revealed it was
considering a lockdown of selected areas; on 24 March, it declared that all shops, offices, and
schools nationwide would be closed from 26 March. In the diary project area, this ‘lockdown’
(bhondo ghosona) was quickly and harshly enforced by police, helped by the army. Newspapers ran
stories about ‘police excesses’, and most of the 348 arrests in Kapasia for disobeying the lockdown
(of which 270 resulted in fines) happened during this first period of strict enforcement, which
continued until the end of April. Most local people, already frightened by media stories of the
ferocity of the disease, reacted by staying indoors. They had initially been told that the lockdown
would end on 14 April, and were prepared to sit it out for some days. In any case, all transport,
including buses and trucks, was halted. Prices of goods that normally came from outside the area
began to rise, while local produce usually exported to Dhaka lost value, creating opportunities for
some local entrepreneurs, who set up ad hoc market stalls.
Banks and some other institutions could open with restricted hours, but these exemptions did not
apply to MFIs. The abrupt and strict effect of this lockdown on our diarists’ savings and loans
transactions is immediately clear in our records, as Figure 2 shows.
The MFIs simply closed their doors. Some, notably Brac, tried to service clients through mobile
money transfers, but there were no such transactions in our area, and in any case throughout
April’s strict lockdown the mobile money agents were partly closed. The leading cooperative kept
operating covertly, but it made only a few transactions, mostly savings withdrawals. Diarists
transacted with their informal partners, although not as frequently as before the lockdown. The
MFIs did not reopen until after the formal declaration of the end of lockdown at the end of May,
and in terms of the amount of money flowing through savings and loans, May’s total was even
lower than April’s. Even when they did finally reopen their doors, regulators restrained MFIs from
pressing their clients too hard for loan repayments, and as a result the MFIs lent less.
4 The source for the dates in this section is the national English-language daily newspaper The Daily Star, whose archives
are available at www.thedailystar.net/newspaper.
4Figure 2: Daily count of diarists’ savings and loans transactions with MFIs, cooperatives, and informal partners,
March to May 2020, transactions per day
50
Informal transactions are with friends or relatives (often interest-free) or community-based savings-and-
45 loan clubs
40
Cooperatives tend to provide a daily service: their transactions are therefore greater in
35 number but lower in value than those of MFIs. They serve individuals, not groups
30
25
The MFIs are all Grameen-style, with mostly weekly group meetings
20
15
Lockdown
10 began on
26 March
5
0
March
3
5
7
9
11
13
15
17
19
21
23
25
27
29
April
2
4
6
8
10
12
14
16
18
20
22
24
26
28
May
2
4
6
8
10
12
14
16
18
20
22
24
26
28
30
Source: authors’ calculations based on data from HDDP.
On 31 March, the lockdown was extended by a week, the first of several such extensions. Although
there were still no confirmed cases in the diary area, April was a period of intense fear. On 17
April, local youths in Hrishipara barricaded all entrances into the settlement. Hospitals, clinics, and
doctors, in almost total disarray, refused to see patients with COVID-like symptoms. Rumours
spread of people dying in their homes from COVID-19. The diary project ran a survey among our
diarists that showed they feared both the disease and its economic consequences, with a small
majority saying they feared the disease more. In mid-April the government announced relief
measures in both rice and cash that were to be targeted to the poor, but in the project area little of
this got through. Instead, better-off households gave baskets of essentials to their poorer
neighbours, and were joined by some non-governmental organizations, private companies,
political parties, and religious groups; but enthusiasm for this quickly waned. On 19 April, two
members of one diarist household—a couple with jobs at the local hospital—were confirmed to
have the virus, along with several colleagues. They self-isolated at home and recovered. No other
diarist tested positive for the disease during the period of study.
2.3 Easing of the lockdown
The beginning of May saw a second, milder version of the lockdown in force. The army had
withdrawn. The police too, having initially frightened people into staying at home, started to relax.
A public mood of ‘OK, we have to live with this’ took over. The government, announcing yet
another extension of the lockdown, was forced to appeal to the police to resume enforcement.
Nonetheless, people found ways round the lockdown: rickshaw drivers helped people to get about
in the early morning, before the police were on the streets; building sites away from main roads
resumed work. 5 Shops became more adept at judging when they could open without attracting the
attention of the police. Trucks reappeared on the roads. The barricades round Hrishipara were
dismantled on the last day of May because, as one of the young men involved said, ‘we thought
5 As Ali et al. (2021) note, by mid-May 2020, citizens in Bangladesh were beginning to return to normal life, rejecting
the lockdown as unworkable given its effects on their livelihoods and the relative lack of government support.
5things were improving and in any case, people need to move around to earn money’. The lockdown
was officially lifted on 1 June.
The post-lockdown period in our study can be broken down into two subperiods. The first
subperiod, 1 June to 30 July 2020, ended with the Islamic holiday of Eid al-Adha, the ‘sacrifice’
festival, which fell on the last day of July. Remittances from family members working overseas,
which had all but dried up as workers were furloughed, started flowing in large amounts, as many
of the overseas workers started earning again in July. Clothes shops had reopened by late May, and
people bought their Eid finery in the run-up to Eid al-Adha. In the second subperiod, 1 August to
30 September, the increased spending levels witnessed during the festival season came to an end.
However, by August, life for most people had settled into a new normal. 6 The pandemic remained
an ever-present reality in Hrishipara and Bangladesh, with an average of around 1,500 new
COVID-19 cases a day during the month of September.
3 The Hrishipara diaries
Diaries have long been used as a research method in the social sciences, but it was not until the
close of the 20th century that they were adapted to look into how people manage their money
(Collins 2008; Collins et al. 2009; Kamath et al. 2008; Morduch and Schneider 2017). The diary
method used in this study was originally used to experiment with novel ways of delivering
microfinance. One of these experiments, Shohoz Shonchoy (‘easy savings’), registered as a
cooperative MFI, began in the Hrishipara settlement in 2002. Starting in May 2015, daily diaries
were used to track the fortunes of a handful of Shohoz Shonchoy’s clients. The number of diarists
was later expanded to 60. Of these 60 households, 36 are Muslim and 24 are Hindu. Fewer than
half are clients of Shohoz Shonchoy.
The diarist households were selected not in any statistically representative manner, but to provide
a range of extremely poor, poor, and near-poor (but not rich) households, with a wide variety of
occupations (see Table A1 in the Appendix). The poorest is an illiterate widow who does odd jobs
for market stallholders; the richest include a farming household with about a hectare of land, and
a couple who earn government salaries as low-grade hospital staff. Despite the consequent
differences in income, all 60 households share many similarities: they eat the same kind of food,
shop in the same markets, ride in the same rickshaws, go to the same mosques or temples, and
take part in the same Muslim or Hindu festivals. Among the principal occupations of our 60 diarists
(many of whom have multiple jobs), 34 are self-employed, and 26 are wage employed. Most self-
employed diarists run shops or restaurants, and most wage employed diarists are casual labourers.
Households are invited to enrol as diarists, and are paid BDT100 (about US$1.17) a week as a
reward. In each household the project selects one person, male or female, as the ‘diarist’. The
diarist is usually the household’s ‘money manager’ through whose hands most or even all of the
household’s money passes. Having one respondent per household simplifies the data collection,
and collecting data every day, seven days a week, cuts out reliance on recall and hugely improves
data accuracy. Weekly resolutions that compare how much money the diarist has at home with his
or her money flow during the week provide a further check on quality.
6 In mid-November 2020, official records showed that 426 people in Kapasia had been confirmed to have had the
virus, of whom eight had died and all but five had recovered. Actual numbers may have been higher, but we did not
find clear evidence of that: for example, the priests in Hrishipara did not see a rise in the number of cremations.
6Shohoz Shonchoy staff manage the diary data collection. They are modestly educated local people
who share the culture and language of the diarists and have come to know them well over many
years. A team of four such collectors (three women and one man) visit each diarist daily, at a
convenient time but usually in the evening. There is no interview instrument. The collectors ask
just one question: ‘what money came into your hands today, and what went out?’ They record the
answers—the amount and description of each transaction—on a single page in a notebook with
‘inflow’ and ‘outflow’ sections, adding explanatory notes if needed (see Figure A1 in the Appendix).
They also add details about the household, which helps the project to build up its understanding
of the social and personal drivers of money management behaviour. We provide further details of
how the HDDP data is collected and a profile of the diarists in the Appendix.
4 The many lives of the poor during the pandemic
In this section, we present five case studies of the experiences of individual diarists during the
pandemic.
4.1 Case study 1: Liaqat, a self-employed newspaper vendor
Liaqat has been selling newspapers for more than 25 years. He is a person of habit, following the
same daily routine since before the HDDP started tracking him in August 2015. Early each
morning, seven days a week, he bought 220 newspapers for BDT930 from a local wholesaler. He
sold about half of them on the street for cash; he delivered the rest to regular customers, who paid
him in arrears. Averaged out over the years, his sales exceeded his stock purchases by just over 40
per cent. As Figure 3 shows, this pattern ended abruptly on 25 March 2020, the last day before the
lockdown started.
At the beginning of March, the papers Liaqat sold were treating the COVID-19 outbreak largely
as an overseas story. But soon they reported the first confirmed cases in Bangladesh, and on 18
March the first death. On 23 March there were rumours of a cluster of cases in a nearby village.
On the morning of 26 March, Liaqat stayed at home. He could have bought papers to sell, but
there were too few people on the streets to sell them to, and he was frightened of catching the
virus. Throughout April he sold no papers, but received some arrears payments from credit
customers.
On 18 May, Liaqat was confident enough to buy stock again, albeit at a much-reduced volume. By
early June he was buying at about two thirds of his pre-pandemic rate; by mid-August he had
settled on a new normal of BDT750 per day—80 per cent of his former rate. He enjoyed a few
good weeks in late May and early August, when he persuaded some more of his credit customers
to pay their bills.
7Figure 3: Liaqat's newspaper vending business: weekly stock purchases and sales, February to September 2020, BDT
12,000
10,000
Sales
8,000
6,000
Stock purchases
4,000
2,000
0
February March April May June July August September
Source: authors’ calculations based on data from HDDP.
8What was the impact of the pandemic on Liaqat’s household expenditures? The family’s first
response was to cut back on all spending other than food. In April they spent BDT2,940 on food,
and less than that on all other purchases combined; in previous months they had spent about the
same amount on food, but three times that amount on other goods. By May, when the Eid al-Fitr
festival occurred, their food costs rose to BDT4,000; in July they spent over BDT21,000 on food,
because of the Eid al-Adha festival at the end of the month. This rebound was largely funded by
the BDT36,000 sale of a cow they had been rearing, which they had always intended to sell ahead
of Eid, when prices are high. To celebrate Eid in the customary way, they bought a BDT18,000
share in another cow.
Liaqat’s case illustrates the pattern that we will explore in more detail with the aggregate
quantitative data in the next section: a collapse in economic activity when the lockdown began,
followed by a revival in stages starting in May, with a recovery in net income, but not enough to
return to pre-pandemic levels by September.
4.2 Case study 2: Radhu, a casual wage labourer
Radhu, now aged about 50, became HDDP’s first diarist in May 2015, and she is possibly the
poorest. She lives on less than a dollar a day, and she works in the local market—carrying water
for stallholders, sorting onions, or helping to load goods for the hizra, a transgender group who
survive by taking gifts from stallholders in return for not disrupting the market.
Radhu’s total income for February to September 2020 was less than BDT5,000, and her
expenditure was even less, since despite her poverty she saves almost every day, including all of
the US$1 per week she receives for being a diarist. Because she never drew on her savings, she had
built up a large savings balance of BDT58,000, all of which she regarded as belonging to her as-
yet unmarried daughter and therefore as not to be touched. In April and May, with the lockdown
enforced, she was blocked from the market by fear and by the police, and her earnings fell sharply.
Several items that she bought in March she went without in April. In May she drastically cut
spending on food but bought a stock of firewood (Figure 4).
Although her income recovered from June onwards, her spending—especially on food— did not,
remaining flat throughout September (Figure 4). Only her ferry fares across the river to the market
returned to their former level. A reason for this was that in April and May, while unable to go to
work, Radhu started doing housework for her sisters-in-law, in whose compound she lives, in
return for food; indeed, she still does so, although it is too early to say whether this marks a
permanent shift in her lifestyle. She also received a little food relief from public and private sources.
Another reason was that a marriage possibility for her daughter emerged, driving Radhu to save
more than ever. In September, for example, she saved BDT290 over and above her participation
reward from the diary project.
Radhu’s case shows that the pandemic had persistent negative effects on the food expenditures of
the poorest households, even though incomes showed a recovery in the post-lockdown period.
9Figure 4: Monthly income and expenditures for Radhu, March to September 2020, BDT
900
700
500
Earned income
300
100
-100
Food
-300
Clothes
-500 Healthcare
Home maintenance
-700 Transport
Firewood
-900
March April May June July August September
Source: authors’ calculations based on data from HDDP.
4.2 Case study 3: Rezia, a cake shop owner
Some households entered the pandemic period with their lives already in turmoil. Such was the
case for Rezia, her husband, and their two adult sons. In 2017 Rezia started a small shop selling
hot cakes. Her husband disapproved, they quarrelled, and she spent a few unsuccessful months
working in Saudi Arabia. When she returned, a reconciliation with her family took place. She
restarted the cake shop and made her first sales in November 2019. Other sources of income in
the family were her husband’s work as a rickshaw puller and her two sons’ semi-skilled manual
jobs.
January 2020 was a good month: Rezia grossed BDT14,000 from her shop, her husband earned
BDT11,000 with the rickshaw, and the sons contributed BDT13,000 from their jobs. That was
more than enough for their business costs and household spending, and they repaid BDT15,000
to two MFIs. In February 2020, the elder son lost his job, and the husband’s earnings shrank, but
Rezia plunged ahead: she took a fresh loan of BDT60,000 from one of the MFIs and bought a
refrigerator for the shop and furniture for the home. More money passed through their hands in
February than in any subsequent month. In March takings at the cake shop reached BDT26,000,
but the rickshaw income fell.
Then the pandemic dealt them another blow. In April the lockdown closed the cake shop and the
younger son’s metal workshop, and halted rickshaws. Household expenditure collapsed to
BDT2,000, paid out of cash reserves that Rezia had been keeping at home (Figure 5). Fortunately,
the MFIs were closed, so Rezia did not have to make any loan repayments. July saw a recovery,
with good cake sales in the run-up to the Eid al-Adha festival. The elder son got his job back, and
both sons contributed earnings to the household. But August was another bad month. The elder
son had a debt from a failed business venture the year before, and the creditor was pressing for
payment. It had to be paid, and seeing no other way, they sold the husband’s rickshaw. The MFIs
also started looking for repayments again, and Rezia paid them, eager to keep this line of credit
open. These shocks may have helped Rezia to impose more discipline on her unruly family: for
the remainder of the research period, Rezia ran her shop, and her husband (using a hired rickshaw)
and elder son brought in regular, if modest, incomes. They did not borrow again, but they kept up
10with their MFI loan repayments. Their expenditure remained much lower than at the beginning of
the year, but the household economy now looked more stable.
Figure 5: Main transactions by category for Rezia, monthly, January to September 2020, BDT
100,000
80,000
Rezia takes an MFI
loan and invests in a ...but they have to sell the
60,000 fridge... rickshaw to pay off the
son's debt
40,000
20,000
0
-20,000
-40,000 gross income asset sale
loans taken business costs
-60,000
household spending loan repayment
-80,000 savings deposited
-100,000
Jan Feb Mar Apr May Jun Jul Aug Sep
Source: authors’ calculations based on data from HDDP.
Rezia’s case illustrates how the pandemic interacted with the diarists’ pre-existing vulnerabilities,
leading to a calamitous decline in incomes during the lockdown period. At the same time, the case
study shows the resilience of the poor, even in the most difficult of circumstances.
4.4 Case study 4: Samarth, a small farmer turned trader
At first glance, Samarth is a typical small farmer. He owns about a tenth of a hectare of farmland,
and he sharecrops other land, growing rice and vegetables. His small home is on the edge of the
Hrishipara settlement; on the open land stretching down to the river he grazes one, two, or
sometimes three cows.
However, Samarth’s path through the COVID-10 pandemic proved unusual. He exploited the
closure of the transport system after the lockdown started. Local farmers, desperate to offload
produce they would otherwise have exported to Dhaka, let him buy at low prices, and he sold
them on the street inside Hrishipara, which had barricaded itself off from the outside world. As
Figure 6 shows, he did this for a month from 21 April. It boosted his income, but it was not
profitable: his outlay exceeded his sales. His family ended up eating much of the remaining stocks
that he had bought.
He was already immersed in a grand scheme for his son, who had graduated from a vocational
school. In late 2019 Samarth sold a cow for BDT109,000, and in January 2020 he borrowed
BDT100,000 interest-free from a friend (a bus owner with whom he had done business
previously). On 11 February he paid a Dhaka-based consultancy BDT100,000 to procure the son
a Canadian student visa. Two weeks later, a BDT51,000 bank savings plan matured, Samarth sold
much of the family’s gold jewellery for BDT108,000, and he borrowed BDT150,000 interest-free
from a nephew who had an office job. On 1 March Samarth paid the consultancy a further
BDT300,000. Then the pandemic struck, and the visa-processing ground to a halt. Samarth went
to see the agent several times, and he reported that he was confident that all would be well. But in
11the monthly surveys the project runs, when we ask each diarist how things have been that month,
Samarth was gloomy, especially during the July and August monsoon, when his grazing land and
vegetable plots were under water. The family did not go hungry because they could consume their
own produce. As Figure 7 shows, the big transactions related to his son’s visa dominated Samarth’s
accounts in 2020. After a frantic start to the year, things went ominously quiet in the second half
of 2020, with income flows from produce sales drying up in the post-pandemic period.
Figure 6: Samarth’s daily gross income, March to June 2020, BDT
3,000
2,000 produce
sales
1,000 milk sales
0
01-Apr
03-Apr
05-Apr
07-Apr
09-Apr
11-Apr
13-Apr
16-Apr
20-Apr
22-Apr
24-Apr
26-Apr
28-Apr
30-Apr
02-Jun
04-Jun
06-Jun
08-Jun
10-Jun
12-Jun
14-Jun
01-Mar
03-Mar
05-Mar
07-Mar
09-Mar
11-Mar
13-Mar
15-Mar
17-Mar
19-Mar
22-Mar
24-Mar
26-Mar
28-Mar
30-Mar
02-May
04-May
06-May
08-May
10-May
12-May
14-May
16-May
18-May
20-May
22-May
25-May
27-May
29-May
31-May
Source: authors’ calculations based on data from HDDP.
Figure 7: Main transaction categories for Samarth, monthly, January to September 2020, BDT
Savings withdrawn
300,000
200,000 Gross
Loans
income
taken
100,000
0
-100,000 loan given by diarist repayment on loan given
savings deposited expenditure
-200,000
business costs
-300,000
-400,000
Jan Feb Mar Apr May Jun Jul Aug Sep
Source: authors’ calculations based on data from HDDP.
Samarth’s case shows how individual diarists responded to the pandemic in ingenious ways—in
Samarth’s case, transforming himself from a small farmer to a trader overnight when he spotted a
profit opportunity during the lockdown. However, the profit-making opportunity was short-lived,
and Samarth’s income all but disappeared in the later part of our study period.
124.5 Case study 5: Shobhona, a breaker of bricks
Shobhona, now in her mid-30s, is another of our very poor diarists, but a supportive family, public
welfare payments, and a habit of keeping cash reserves at home helped her to survive the
lockdown. Her situation is unusual, as she is the breadwinner for her widowed younger sister and
the sister’s two children, both in primary school. The four of them live in a hut in the homestead
of Shobhona’s late brother-in-law. The hut was purpose-built—and still serves—as a weekly
meeting place for a Grameen Bank borrowers’ group, but the group is a male one, and male
attendance at MFI meetings these days is sparse, so no one finds it inconvenient.
Shobhona breaks bricks for a living. Bricks are broken in Bangladesh to provide aggregate for
concrete in a country that lacks stone. She goes to building sites to squat on the ground with a
hammer and a thick leather glove and bashes the bricks into small pieces, on a self-employed basis
paid by quantity. On average this brings in BDT4,000 each month, but she often gets paid in
arrears. There is no other earned income, but the sister is partially blind and receives a government
disability allowance of BDT700 a month, paid half-yearly. The household has no MFI accounts,
but Shobhona, thinking of her niece’s eventual marriage, has signed up for a ten-year commitment
savings account, at BDT7,000 a year, with an insurance company. They occasionally borrow
interest-free from neighbours and relatives, and keep a little money with ‘money guards’—older
family members who can be trusted to keep money safe for them. Shobhona also keeps cash
reserves at home: in May 2020, for example, she had more than BDT12,000 hidden away, about
three times her monthly income. Despite being entirely without schooling, Shobhona is shrewd
and thoughtful about money matters.
The two women have older siblings and receive both affection and financial help from them. Their
brother is a dried-fish seller living nearby, and he gives them a little cash almost every day to ensure
that the children get milk regularly. As the children have grown, he has gradually increased the
amount, from BDT5 to BDT10, then to BDT20 and sometimes BDT50 a day. An older sister,
who is married and lives a little way off, gives regularly although less frequently. Several neighbours
also occasionally give cash. Shobhona is liked and respected in the neighbourhood.
In April this year, just after the lockdown started, Shobhona contracted typhoid. She spent money
on tests and a lot of medicine. She could hardly have chosen a worse time to fall ill, but her
circumstances meant that her household survived the lockdown better than most. As Figure 8
shows, disability grants helped a lot: in the first quarter of the year they made a surplus, and the
second payment came just as they were trying to recover from a workless April. Shobhona’s
sickness then drew generous support from her relatives. Shobhona went back to work as soon as
she was able.
Shobhona’s case is an example of how government disability payments combined with gifts
received from relatives—an informal insurance mechanism—can provide an important safety net
for the poor during a period of economic crisis. It also illustrates that uneducated people can be
good at managing money.
13Figure 8: Inflows and outflows for Shobhona, January to September 2020, BDT
8,000 Sister's disability
allowance
3,000
-2,000
Medical
-7,000 expenses
In May Shobhona had over BDT12,000 in
cash reserves at home
-12,000
Jan Feb Mar Apr May Jun Jul Aug Sep
income gifts received allowances food household medical gifts given
Source: authors’ calculations based on data from HDDP.
The five case studies illustrate the varied experiences of the diarists during the pandemic. In all
five cases, large income losses, along with the uncertainty regarding how long the pandemic would
last, led to significant financial hardship and heightened anxieties about the future. In all these
cases, incomes and financial inflows remained below pre-pandemic levels several months after
lockdown was lifted. The cases also show that the pandemic exacerbated existing economic
vulnerabilities for the poor in Hrishipara, who had precarious livelihoods from before the onset
of the pandemic.
5 The impact of the pandemic on livelihoods of the poor in Hrishipara
In this section, we examine the impact of the pandemic on household incomes, expenditures, and
financial transactions until September 2020, differentiating between pre-lockdown, lockdown, and
post-lockdown periods. We first discuss the data we use in our empirical analysis. We next present
some descriptive statistics regarding the behaviour of incomes, expenditures, and financial flows
over the course of the pandemic. We then undertake an econometric analysis of the impact of the
pandemic on livelihoods, focusing on the lockdown and post-lockdown periods. Finally, we assess
whether the effects of the pandemic on the livelihoods of the 60 diarists differed according to the
diarists’ nature of employment and poverty status.
5.1 Data
We use daily data on incomes, expenditures, business costs, loans taken and repaid, savings
deposits and withdrawals, gifts received and given, and overseas remittances received. The list of
variables, along with short descriptions used in the empirical analysis, is provided in Table 1. The
data begins on 1 October 2019 and ends on 30 September 2020. We note that the official lockdown
period was from 26 March to 31 May 2020. However, as we discussed previously, the lockdown
was strictly enforced from 26 March to 30 April 2020, and was weakly enforced from 1 to 30 May
142020. Therefore, we split the lockdown period to two subperiods: ‘strict lockdown’ (26 March to
30 April) and ‘weak lockdown’ (1 to 31 May). The post-lockdown period also had two clear
subperiods: the Muslim festive season from 1 June to 31 July, which we denote by ‘post-lockdown
1’, and the subsequent subperiod from 1 August to 30 September, which we denote by ‘post-
lockdown 2’.
Table 1: Description of variables used in empirical analysis
Variable name Description
Total inflow All money from all sources recorded as coming into the diarist’s household.
These are gross income, savings withdrawals, borrowing, gifts in, participation
reward, repayments received on loans given to others, savings accepted from
others, inward savings account transfers, third-party transactions in, and
overseas remittances.
Total outflow All money going to all destinations recorded as leaving the diarist’s household.
These are household expenditures, costs, savings deposits, loan repayments,
gifts out, loans given to others, savings repaid to others, outward savings account
transfers, and third-party transactions out.
Gross income All earned income, including remittances and all revenue from sales.
Costs All outflows that are costs of doing business, including stock purchases, travel
expenses to get to work, wages paid out, and consumption of work-related
products and services such as battery-charging, food packaging, etc.
Net income Gross income - costs.
Expenditures All household and personal expenditure on food and other essentials and non-
essentials.
Savings deposit All deposits into savings made at all sorts of partners: banks, MFIs, cooperatives,
insurance companies, relatives, friends (i.e. money guards), or savings clubs.
Savings withdrawal All withdrawals from savings at all sorts of partners: banks, MFIs, cooperatives,
insurance companies, relatives, friends (i.e. money guards), or savings clubs.
Loans repayment All repayments on loans taken from all sources: banks, MFIs, cooperatives,
insurance companies, relatives, friends, moneylenders, or savings clubs.
Borrowing All loans taken from all sources: banks, MFIs, cooperatives, insurance
companies, relatives, friends, moneylenders, or savings clubs.
Gifts received Unearned inflows from relatives, friends, and well-wishers outside the diarist’s
household.
Gifts given All outflows given to others outside the diarist’s household as a gift.
Overseas remittances That part of gross income that flows in from members of the household working
overseas (it is always part of net income).
Note: ‘Third-party transactions’ is a category we use when the diarist is simply a conduit for transactions between
two other parties. One case involves mobile money (when someone living outside our area sends money to a
relative inside our area using our diarist’s mobile money account); another involves savings (a Grameen client
who does not attend the weekly Grameen meeting hands her Grameen savings to a diarist who does). In each
case there are usually matching inward and outward flows within a short period. The overall sums involved are
not large.
Source: authors’ compilation.
As large asset sales by one diarist can significantly affect the average values for all diarists, and tend
to occur very infrequently, we drop them from the sample. Specifically, we drop all asset sales
greater than or equal to BDT30,000 (approximately US$950 at 2019 purchasing power parity
exchange rates according to the World Bank’s World Development Indicators). This removes nine
observations, leaving us with a total sample of 19,400 observations. 7
7 We also drop a specific set of outlier transactions in our sample, which involves a case where a household sold a plot
of land co-owned with another household to pay off a large debt. In addition to the repayment of the debt, money
generated from this land sale was deposited into a bank account and granted as a gift for the building of a school. We
also drop 11 observations that involve purely moving funds from one savings account to another.
155.2 Descriptive statistics
We begin with plots of incomes, expenditures, business costs, loans borrowed and repaid, savings
deposits and withdrawals, gifts received and given, and overseas remittances received. All graphs
use 14-day centred moving averages, and we deflate the nominal values by the relevant monthly
consumer price index (CPI) for rural areas, obtained from the Bangladesh Bureau of Statistics.
Total real inflows and total real outflows for all 60 diarists track each other closely over time, and
show a clear decline during the first month of the lockdown period (strict lockdown) (Figure 9).
They show some recovery in the second month of the lockdown period (weak lockdown), carrying
on into the first two months of the post-lockdown period (post-lockdown 1). Interestingly, this
recovery is not sustained as we move into the final two months of our period of analysis—August
and September 2020 (post-lockdown 2).
Figure 9: Daily means of total inflows and outflows, 14-day centred moving average
Note: vertical lines mark start and end of lockdown. Nominal values deflated with monthly CPI.
Source: authors’ illustration based on data from HDDP.
We see very similar patterns for gross income, business costs (costs), household expenditures
(expenditures), and net income (Figure 10). Incomes, costs, and expenditures fall in the first month
of the lockdown period, and recover somewhat in the second month of the lockdown period. A
stronger recovery is seen in the first two months of the post-lockdown period, but this recovery
is not sustained in August and September 2020. We see that gross income shows stronger recovery
than business costs in the second month of the lockdown period, which is reflected in a strong
recovery in net income in May 2020.
16Figure 10: Gross income, net income, expenditures, and costs, 14-day centred moving average
Source: authors’ illustration based on data from HDDP.
We now look at savings deposits and withdrawals, gifts received and given, loan repayments and
borrowings, and overseas remittances. It is striking to see the near-shutdown in financial
transactions during the lockdown period, with very limited savings deposits and withdrawals, loan
repayments and borrowings, or gifts in and gifts out (Figure 11). All financial transactions show
some recovery in the post-lockdown period. We also look at the behaviour of overseas remittances,
as 11 of the diarist receive remittances from abroad, supplementing their earned income (these 11
diarists received total remittances of over BDT100,000 each between January and September
2020). We do not see very strong inflows of overseas remittances in the lockdown period, possibly
related to the fact that migrants had stopped working due to lockdown policies in the regions and
countries where most Bangladeshis from this area go for work—the Gulf region, Singapore, and
Malaysia. However, there is a large inflow of remittances during the festival season just before or
during Eid al-Adha (recall that 36 out of the 60 diarists are Muslims). Even without taking overseas
remittances into account, net income shows a strong recovery in the weak lockdown and post-
lockdown periods.
17Figure 11: Savings, loans, gifts, and overseas remittances, 24-day centred moving average
Source: authors’ illustration based on data from HDDP.
5.3 Econometric analysis
We now undertake an econometric analysis of the impact of the pandemic on the livelihoods of
our 60 diarists. We use weekly data, which comprises the averages of the daily data in the
corresponding week. We do this to take into account the fact that diarists do not make transactions
in every category every day, which effectively means that a large number of our observations have
the value zero. By converting our daily data to a weekly format, we reduce the number of
observations with zero values in our data set. We have 3,153 week-diarist observations in our panel
data set of weekly data.
We present the summary statistics for our main outcome variables—total real inflows, total real
outflows, total real gross and net incomes, total costs, and total expenditures—in the Appendix in
Table A2, with the summary statistics for the other variables presented in Table A3.
18We find that the average values of all variables are significantly lower in the strict lockdown period
compared with the pre-lockdown period. For example, total real inflows are 64 per cent less in the
strict lockdown period compared with the pre-lockdown period, and total real outflows are 54 per
cent less in the strict lockdown period compared with the pre-lockdown period. Real net income
and real expenditures are 61 per cent and 21 per cent less in the strict lockdown period compared
with the pre-lockdown period. These are dramatic declines in household incomes, expenditures,
and financial transactions within the short window of a month. However, while household
incomes, expenditures, and financial flows remain depressed during the weak lockdown period,
the rate of decline is not as pronounced as in the earlier period. For example, total real inflows and
outflows are respectively 43 and 44 per cent less in weak lockdown compared with pre-lockdown.
Interestingly, real net income is 21 per cent higher in weak lockdown compared with pre-
lockdown, driven mostly by a recovery in gross real income without a corresponding increase in
business costs. Real expenditures also show a strong recovery, being only five per cent lower than
the pre-lockdown level. After the lockdown is lifted, economic activity continues to recover.
Nonetheless, in the first two months after the lockdown (post-lockdown 1), total inflows,
outflows, and most financial transactions remain below pre-lockdown levels. However, income,
expenditures, and overseas remittances exceed the pre-lockdown averages, which is in large part
explained by the Eid al-Adha-related resumption of economic activity. In the second half of the
post-lockdown period (post-lockdown 2), starting just after Eid al-Adha, incomes and
expenditures decrease from the first part of the lockdown, and the averages of all the variables
remain below pre-lockdown levels. By this time, at least two months have elapsed since the official
lockdown was lifted. In part, weak economic activity can be explained by the fact that the markets
had not recovered their normal functioning by August and September 2020, and also by the fact
that people remained fearful of COVID-19 during the summer and early autumn, limiting their
mobility and their willingness to seek work.
In our econometric analysis, we look at income and financial inflows, as well as expenditures and
financial outflows. We are interested in examining whether there are discernible aggregate effects
of the lockdown and post-lockdown periods on the diarists’ incomes, expenditures, and financial
inflows and outflows relative to the pre-lockdown period. We would also like to see whether these
effects differ depending on the nature of the lockdown and post-lockdown periods. We estimate
empirical specifications of the form:
Yit = ao + a1StrictLockdownt + a2WeakLockdownt + a3PostLockdown1t +
a4PostLockdownt + eit [1]
where Y is the outcome variable. In the econometric analysis, we look at total inflows, total
outflows, net income, and total expenditures. Here total inflows comprise both income and
financial inflows (such as savings withdrawals, gifts in, and borrowings), and total outflows
comprise both household expenditures and financial outflows (savings deposits, gifts out, and
loans repaid). The error term is denoted by eit. The subscript i denotes the individual, and the
subscript t denotes time.
We use the inverse hyperbolic sine transformation for all the variables, as the original variables are
highly skewed to the left (with a mass of observations at value zero, where the household does not
make any transaction on a particular day), and in the case of net income we also have negative
values.
StrictLockdown, Weaklockdown, Postlockdown1, and Postlockdown2 are dummy variables
capturing the different lockdown and post-lockdown periods. Thus, the variable StrictLockdown
takes the value one from 26 March to 30 April 2020, and zero otherwise. The variable
19WeakLockdown takes the value one from 1 to 31 May 2020, and zero otherwise. The variable
Post-Lockdown1 takes the value one from 1 June to 31 July 2020, and zero otherwise. The
variable Post-Lockdown2 takes the value one from 1 August to 30 September 2020, and zero
otherwise. The residual period is the pre-lockdown period.
We use both pooled ordinary least squares (OLS) and individual fixed effects (FE) models to
estimate equation [1]. The panel structure of our sample allows us to use individual FE estimation
methods to take into account any unobserved time-invariant heterogeneity. 8
In Table 2, we present the regression results for total inflow, total outflow, net income, and
expenditure for OLS and FE estimates in columns (1) to (8). For each of these outcome variables,
we find that lockdown had a clear negative effect, with the coefficients on the strict lockdown and
weak lockdown dummy variables negative and statistically significant at the five per cent level and
below in most estimates. The results are qualitatively similar for OLS and FE estimates. The only
exception to this is the lack of statistical significance for the OLS and FE estimates of weak
lockdown on expenditure. We also find that the coefficient values for the strict lockdown dummy
are systematically higher in absolute terms than the coefficient values for the weak lockdown
dummy across all estimates, indicating that the effect of the lockdown period on incomes,
expenditures, and financial flows differed across the two subperiods, and that the strict lockdown
period had a more pronounced negative effect on the diarists’ economic activity than the weak
lockdown period. In columns (7) and (8), we also observe that that the negative effects of the
lockdown were more muted on expenditures than on incomes, suggesting that households found
a way to smoothen their expenditures, even in the face of a sharp downturn in incomes. We return
to this point, and to how households coped with the income loss due to the pandemic, in the next
section. 9
Table 2: Regression results, weekly data
(1) (2) (3) (4) (5) (6) (7) (8)
Dependent Total Total Total Total Net Net Expend- Expend-
variable inflow inflow outflow outflow income income itures itures
Strict -1.416*** -1.395*** -0.677*** -0.658*** -2.291** -2.283*** -0.270*** -0.260**
lockdown (0.157) (0.178) (0.074) (0.090) (0.252) (0.294) (0.094)
Weak -0.701*** -0.676*** -0.447*** -0.426*** -0.705** -0.709** 0.013 0.023
lockdown (0.179) (0.166) (0.091) (0.092) (0.284) (0.331) (0.902) (0.084)
Post-lockdown -0.178** -0.189 -0.152*** -0.156*** -0.078 -0.097 -0.016 -0.017
1 (0.123) (0.150) (0.067) (0.052) (0.209) (0.251) (0.067) (0.073)
Post-lockdown -0.336** -0.344*** -0.227*** -0.225*** -0.572*** -0.578** -0.218*** -0.212***
2 (0.121) (0.124) (0.067) (0.062) (0.215) (0.227) (0.065) (0.077)
Constant 6.329*** 6.328*** 6.965*** 6.961*** 4.531*** 4.534*** 6.123*** 6.121***
(0.061) (0.051) (0.034) (0.027) (0.106) (0.099) (0.031) (0.033)
F-stat 22.49*** 17.42*** 24.34*** 13.85*** 22.06*** 16.39*** 5.25** 4.41**
Estimation OLS FE OLS FE OLS FE OLS FE
method
Observations 3153 3153 3153 3153 3153 3153 3153 3153
Note: robust standard errors in parentheses. ***,**, and * indicate one, five, and ten per cent levels of
significance.
Source: authors’ calculations based on data from HDDP.
8 We use robust standard errors in all our regressions.
9 Our finding that incomes fell more sharply than consumption expenditures during lockdown is similar to Gupta et
al.’s (2021) findings for rural India.
20You can also read