The Impact of Icing on the Airfoil on the Lift-Drag Characteristics and Maneuverability Characteristics
←
→
Page content transcription
If your browser does not render page correctly, please read the page content below
Hindawi
Mathematical Problems in Engineering
Volume 2021, Article ID 5568740, 16 pages
https://doi.org/10.1155/2021/5568740

Research Article
The Impact of Icing on the Airfoil on the Lift-Drag
Characteristics and Maneuverability Characteristics

 Kang Wang ,1 Yuan Xue ,1,2 Hongfeng Tian,1 Miaosen Wang,1 and Xiaolong Wang1
 1
 Aeronautics Engineering College, Air Force Engineering University, Xi’an 710038, China
 2
 Aeronautics College, Northwestern Polytechnical University, Xi’an 710009, China

 Correspondence should be addressed to Yuan Xue; wowszxy@163.com

 Received 27 February 2021; Revised 18 May 2021; Accepted 1 June 2021; Published 14 June 2021

 Academic Editor: Hao Zhang

 Copyright © 2021 Kang Wang et al. This is an open access article distributed under the Creative Commons Attribution License,
 which permits unrestricted use, distribution, and reproduction in any medium, provided the original work is properly cited.
 Icing has now become an important factor endangering flight safety. This paper takes the icing data of the NACA 23012 airfoil as
 an example, establishes an icing influence model for real-time simulation based on icing time and aircraft angle of attack, and
 analyzes the influence of different icing geometry on aircraft characteristics. The two-dimensional interpolation method is used to
 improve the model of the aircraft’s stall area, which is mainly divided into the correction of the lift-drag coefficient linear area and
 the stall area and the correction of the aircraft stability derivative and the control derivative. The aerodynamic equation of the
 airplane after icing is established, and the modal analysis of the airplane under different icing conditions is completed through the
 linearization of the flight equation. The closed-loop simulation system of the altitude holding mode and roll attitude holding mode
 is used to calculate and analyze the flight quality changes of the aircraft after the wing surface is frozen. The analysis results show
 that, under icing conditions, in the range of small angles of attack, icing has no obvious influence on the aircraft mode. As the
 degree of icing increases, the throttle skewness and the negative deflection angle of the airplane’s level flight requirements continue
 to increase. The case of icing flight in altitude hold and roll hold modes shows that flying in the autopilot mode under severe icing
 conditions is very dangerous and is prone to cause the aircraft to stall.

1. Introduction In terms of flight test, the aerodynamic data of the
 aircraft after icing are identified mainly through the aircraft
The main cause of flight accidents caused by airplane icing is icing test flight data. NASA has launched projects including
the loss of control caused by the airplane stall. Under severe the Tail Icing Project (TIP) [2, 3] and conducted a large
icing conditions, the stall angle of the aircraft decreases, and number of flight tests with the Twin Otter aircraft (DHC-6),
the stall speed increases. In 2001, Frank and Abdollah accumulating a large amount of aircraft icing flight data
compared the stall angle of attack and the maximum lift [4, 5]. Since 1999, Miller and Ribbens adopted identification
coefficient of the wing and found that when the angle of attack methods such as SWR and OFFIT to obtain aerodynamic
of the wing is between 0° and 11°, the change in the maximum data [6, 7]. In 2000, Bragg et al. proposed a model with
lift coefficient is in linear relationship with the lift coefficient obvious physical meaning and simple structure to describe
after icing [1]. Since 1994, NASA had conducted research on the effects of icing, which can be used to estimate the
tail icing for three years and pointed out that the flat tail icing aerodynamic parameters of the aircraft after icing [8]. Dale
is the cause of abnormal elevator efficiency. For a Twin Otter simulated icing on the flat tail of the “Twin Otter” aircraft,
aircraft, when the flap deflects more than 30°, the flat tail stalls and the response of the aircraft output was consistent with
from the leading edge, causing the aircraft to be out of control. the test flight data [9]. Lampton and Valasek transformed the
However, due to the complexity of the flat tail flow field and flight test results of the “Double Otter” aircraft into an icing
the influence of the wing flaps on the downwash of the flat tail, influence factor model to simulate the longitudinal motion
it is difficult to determine the boundary of the flat tail stall. of the aircraft [10]. As discussed elsewhere [10, 11], an

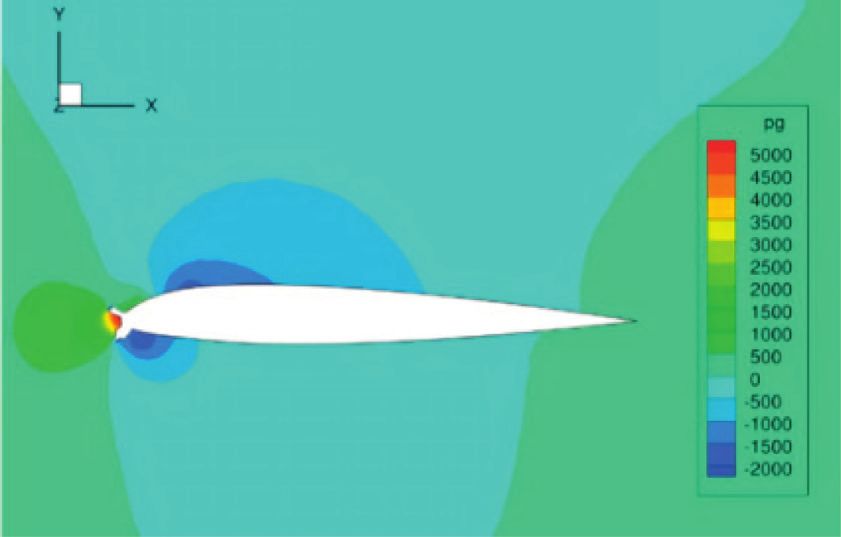
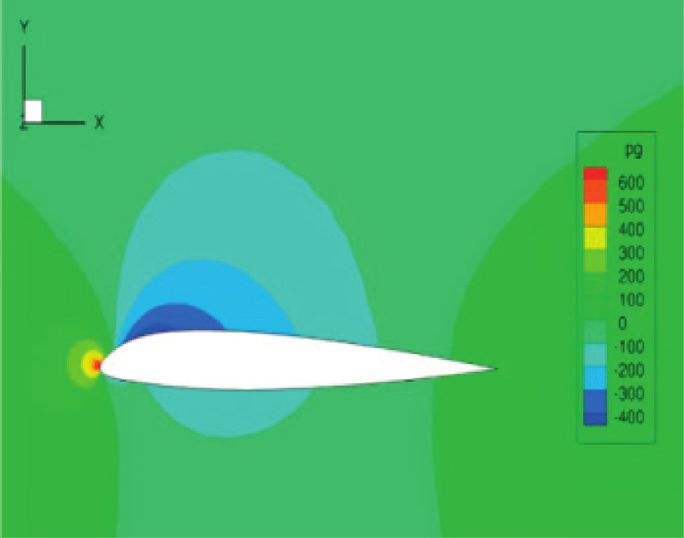
2 Mathematical Problems in Engineering

asymmetric icing model was established, the lateral move- Clear ice has a great influence on the distribution of the flow
ment of the aircraft under icing was simulated, and the flight field. The pressure on the upper and lower wing surfaces is
test on the Cessna 208B aircraft verified the reliability of the reduced, and the pressure on the lower wing surface is
model. The model characteristics of the aircraft were greatly reduced. The pressure difference between the two
analyzed. wing surfaces is significantly reduced. Clear ice causes a
 Since it is currently impossible to eliminate the hazards significant drop in the lift coefficient of the airfoil.
of icing to flight safety, there is an urgent need for safety According to the icing geometry classification, for the
protection under icing conditions. In order to fully un- NACA 23012 airfoil, the lift-drag characteristics of four ice
derstand the effect of icing on the lift-drag characteristics shapes, namely, roughness ice, horn ice, streamwise ice, and
and stability characteristics of aircraft flight, a real-time spanwise-ridge ice, are shown in Figure 3.
simulation icing influence model is established in this paper It can be seen from the figure that the ice ridge has the
based on NACA 23012 airfoil icing data. Since icing will greatest influence on the aerodynamic characteristics of the
affect the stall characteristics of the aircraft and reduce the airfoil. The maximum lift coefficient is reduced from 1.8 to
stall angle of attack, the model of the stall area of the aircraft 0.5, and the stall angle of attack is reduced from 18° to 6°. The
is improved by modeling the aircraft in the linear phase and resistance has increased significantly after the stall, as well as
the stall phase. At the same time, two modes of autopilot are the pitching moment coefficient. The severity of other ice
designed on the basis of the simulation model, namely, roll shapes is horn ice, roughness ice, and streamwise ice in a
attitude hold (RAH) and altitude hold (ALH). The focus is descending order.
on the analysis of the stability characteristics of the aircraft in The difference in the ice shape is closely related to the
the open loop and closed loop under icing conditions. freezing time. Taking clear ice which has a serious impact on
Through open-loop simulation, the influence of icing on the aerodynamic characteristics as an example, for the NACA
longitudinal long- and short-period mode and the transverse 23012 airfoil [14], the NASA Glenn Center conducted an
mode is studied, and the influence of icing on the perfor- icing wind tunnel experiment under such conditions. The ice
mance of autopilot is studied through closed-loop shape and lift-drag coefficient changes with time are shown
simulation. in Figure 4.
 As the freezing time increases, the shape of ice on the
 airfoil surface changes continuously. During the formation
2. Materials and Methods of clear ice, when ice freezes for 1 minute, streamwise ice that
2.1. The Influence of Airfoil Icing on Aircraft Aerodynamics and has a small impact on aerodynamics is formed. After 5
 Model Establishment minutes of freezing, the ice shape develops into horn ice that
 has a serious impact on aerodynamic characteristics.
2.1.1. The Influence of Airfoil Icing on Lift-Drag
Characteristics. The selected wing of the aircraft is a trap-
ezoidal wing with a large aspect ratio, and the aerodynamic 2.2. Effect Modeling of Icing on the Longitudinal Aerodynamic
layout is that the airfoil with a larger lift coefficient is Coefficient. The effect of icing on the aerodynamic char-
arranged at the wing tip. The airfoil with a smaller lift co- acteristics of the aircraft is mainly reflected in the reduction
efficient is arranged at the wing root to ensure that the of lift, the increase of drag, and the reduction of control
separation of aircraft airflow gradually spreads from the efficiency. Icing will also affect the stall characteristics of the
wing root to the wing tip. When an airplane wing tip stalls, aircraft and reduce the stall angle of attack. Therefore, it is
the entire wing stalls. This paper selects NACA 23012 airfoil necessary to improve the model of the stall area of the
icing data which are close to the wing tip airfoil [12] for aircraft. Due to the difference in the icing time of the aircraft,
modeling. the aerodynamic characteristics are different. This paper
 Different shapes of ice determine different effects of icing selects NASA’s clear ice icing data that have a serious impact
on the aerodynamic characteristics of the airfoil. Taking the on NACA 23012 airfoil icing data. The data change curve of
NACA 23012 airfoil as an example, the lift-drag charac- the lift-drag coefficient with the angle of attack under dif-
teristics of rime ice, glaze ice, and runback ice formed by ferent icing times is shown in Figure 5. Freezing for 5
different physical processes of ice accumulation are shown in minutes is considered as severely icing.
Figure 1 [13]. Due to the complicated changes in the longitudinal
 The NACA 23012 airfoil is simulated under icing con- aerodynamic characteristics of the aircraft after icing, the
ditions with the airfoil surface at Ma � 0.1, Re � 1.0 × 10⁶ , modeling in this paper is divided into two phases: the linear
and angle of attack at 0°. The NASA Glenn Center has phase and the stall phase. For the modeling of the stall zone
conducted wind tunnel icing experiments on it [13]. The affected by icing, it can be seen from Figure 6 that it is
flow field distribution of the NACA 23012 airfoil under difficult to describe and model with a function. Therefore,
nonicing conditions and severe frost and clear ice conditions this paper adopts the two-dimensional interpolation table.
is shown in Figure 2. According to the NASA icing data, this paper standardizes
 It can be seen from the NACA 23012 airfoil flow field the effect of icing on aerodynamic derivatives and takes
distribution diagram that when the angle of attack is 0°, frost nonicing as the standard to obtain the icing influence
has little effect on the flow field distribution, and the airfoil correction factor. In real-time simulation, the two-dimen-
pressure on the leading edge of the wing changes slightly. sional interpolation method is used to correct the
Mathematical Problems in Engineering 3

 1.6
 0.10
 1.4

 1.2 0.08

 Drag coefficient, CD
 Lift coefficient, CL

 1.0
 0.06
 0.8

 0.6 0.04

 0.4
 0.02
 0.2

 0.0 0.00
 2 4 6 8 10 12 14 16 18 20 –2 0 2 4 6 8 10
 Angle of attack (deg) Angle of attack (deg)

 Clean Glaze Clean Glaze
 Rime Runback Rime Runback
 (a) (b)

Figure 1: The aerodynamic characteristics of the NACA 23012 airfoil under different ice shapes: (a) lift coefficient and (b) drag coefficient.

 (a) (b) (c)

 Figure 2: Flow field distribution diagram of the NACA 23012 airfoil: (a) without icing, (b) under frost, and (c) under clear ice.

 2.0 0.08

 0.07
 1.5
 0.06
 1.0 0.05
 CD
 CL

 0.5 0.04

 0.03
 0.0
 0.02
 –0.5
 0.01

 –1.0 0.00
 –10 –5 0 5 10 15 20 –10 –5 0 5 10 15
 α (deg) α (deg)

 Clean Streamwise ice Clean Streamwise ice
 Roughness ice Spanwise-ridge ice Roughness ice Spanwise-ridge ice
 Horn ice Horn ice
 (a) (b)

Figure 3: The lift-drag characteristic curve of the NACA 23012 airfoil under different ice shapes: (a) lift coefficient and (b) drag coefficient.
4 Mathematical Problems in Engineering

 2 1.6
 1 0.10
 1.4
 0 1min
 –1 1.2 0.08
 –1 0 1 2 3 4
 2 1.0
 1 0.06

 CD
 CL
 2.5min 0.8
 0
 –1 0.6 0.04
 –1 0 1 2 3 4
 2 0.4
 1 0.02
 5min 0.2
 0
 –1 0.0 0.00
 –1 0 1 2 3 4 2 4 6 8 10 12 14 16 18 20 –1 0 1 2 3 4 5 6 7
 Angle of attack (deg) Angle of attack (deg)
 Clean 2.5min Clean 2.5min
 1 min 5 min 1 min 5 min
 (a) (b) (c)

Figure 4: Experimental results of the lift-drag coefficient of the NASA ice wind tunnel: (a) ice shape, (b) lift coefficient, and (c) drag
coefficient.

 1.6
 0.10
 1.4

 1.2

 1.0
 CD
 CL

 0.8
 0.05
 0.6

 0.4

 0.2

 0.0
 0.00
 –5 0 5 10 15 20 0 1 2 3 4 5 6
 Angle of attack (deg) Angle of attack (deg)
 t=0 t = 2.5min t=0 t = 2.5min
 t = 1min t = 5min t = 1min t = 5min
 (a) (b)

Figure 5: The data change curve of the lift-drag coefficient with the angle of attack under different icing times: (a) lift coefficient and (b) drag
coefficient.

aerodynamic data of the aircraft stall area lift-drag coeffi- kL (α, t) � −0.0015 · t · |α|1.75 + 1, (1)
cient. The influencing factors KCL of the two-dimensional
interpolation data of lift coefficient after normalization are
 kD (α, t) � 0.05 · t · |α|1.7 + 0.275 · t + 1. (2)
shown in Table 1, and the influencing factors KCD of re-
sistance coefficient are shown in Table 2.
 For the linear area of the pneumatic data of lift-drag According to the correction coefficient, taking the flight
coefficient, a correction formula is used for correction. The state of 0.2 Mach with the flap angle of the selected aircraft
correction factors kL and kD for lift coefficient and drag being 0° as an example, the curves of the change and lift-drag
coefficient are equations (1) and (2), respectively, which are coefficient, with the angle of attack under different icing
functions of angle of attack and icing time: conditions are shown in Figure 7.
Mathematical Problems in Engineering 5

 0.8 0.6
 0.6
 0.5
 0.4
 0.4
 0.2

 CD
 CL

 0.0 0.3

 –0.2
 0.2
 –0.4
 0.1
 –0.6

 –0.8 0.0
 –8 –6 –4 –2 0 2 4 6 8 10 –8 –6 –4 –2 0 2 4 6 8 10
 Angle of attack (deg) Angle of attack (deg)
 t=0 t = 2.5min t=0 t = 2.5min
 t = 1min t = 5min t = 1min t = 5min
 (a) (b)

 Figure 6: Lift curve of the air condition of the whole aircraft.

 Table 1: Correction coefficients of the interpolation table of the stall zone lift coefficient.
Angle of attack (degrees) −1 1 3 5 7 9 11 13 15 17 18
Not frozen 1 1 1 1 1 1 1 1 1 1 1
Freeze for 1 min 1 1 1 0.9959 0.9700 0.9887 0.9592 0.8695 0.6703 — —
Freeze for 2.5 min 1 1 0.9312 0.9013 0.9469 0.8528 0.7953 0.6541 0.5040 — —
Freeze for 5 min 1 1 0.7993 0.8061 0.6494 0.6188 0.6883 0.5641 0.4152 — —

 Table 2: Modification coefficient of the interpolation table of the stall zone drag coefficient.
Angle of attack (degrees) 1 2 3 4 5 6
Not frozen 1 1 1 1 1 1
Freeze for 1 min 1.600 1.700 1.800 2.000 2.100 2.200
Freeze for 2.5 min 1.625 1.765 1.944 2.000 2.143 2.273
Freeze for 5 min 1.731 1.667 1.571 1.525 1.556 1.940

 The effect of icing on the pitching moment coefficient of icing effect mainly depends on the icing time and the air-
the aircraft in the linear region is expressed as a percentage craft’s angle of attack. However, NASA public data contain
of decrease. When the aircraft is approaching the stall angle less for other aerodynamic derivatives of the aircraft. De-
of attack, its changes are also very complicated. This paper tailed studies through flight tests were only carried out in
also uses the two-dimensional interpolation correction co- NASA’s DHC-6 Twin Otter aircraft. Its aerodynamic data
efficient method for the stall area. The correction coefficient are given as a percentage increase or decrease. Lampton
of the aerodynamic coefficient is shown in Table 3. applied them to the Cessna aircraft and verified the ratio-
 Taking the correction of lift coefficient after icing as an nality and usability of the data through flight tests. The
example, firstly, according to the lift coefficient and angle of changes of the aerodynamic derivative are also used in this
attack when the aircraft is not icing, the linear zone cor- paper, which are shown in Tables 4 and 5.
rection equation coefficient and the two-dimensional lookup Assuming that these aerodynamic derivatives change
table interpolation coefficient are obtained. Then, the lift linearly with time, taking ΔCYβ as an example, when its value
coefficient is revised. The correction of drag coefficient and is reduced by 20%, it is regarded as a severe icing condition,
pitching moment coefficient is similar to this. that is, the condition reached after icing for 5 minutes.
 This paper selects the air flight state of the airplane at 0.2 Therefore, the correction coefficient kCYβ of the aerodynamic
Mach when the flap angle is 0°. The lift coefficient and drag derivative CYβ under icing conditions is expressed as follows:
coefficient at different icing times are shown in Figure 8.
 20%
 kCYβ (t) � 1 − × t, (3)
 5
2.3. Model of the Influence of Airfoil Icing on Other Aerody-
namic Derivatives. The aircraft’s lift, drag, and pitching where t represents the freezing time, and it is calculated in
moment coefficients can be corrected by NASA data, and the minutes. The aerodynamic derivative value after icing is
6 Mathematical Problems in Engineering

 2.0
 1.2

 1.5 1.0

 0.8
 1.0

 CD
 CL

 0.6

 0.5 0.4

 0.2
 0.0

 0.0
 0 5 10 15 20 25 –6 –4 –2 0 2 4 6 8 10 12 14
 Angle of attack (deg) Angle of attack (deg)
 t=0 t = 2.5min t=0 t = 2.5min
 t = 1min t = 5min t = 1min t = 5min
 (a) (b)

 Figure 7: The modified curve of the lift-drag coefficient in the linear region: (a) lift coefficient and (b) drag coefficient.

 Table 3: Stall zone interpolation table of pitching moment versus angle of attack derivative.
Angle of attack 0 6 7 8 9 10 12 16 30
Not frozen 1 1 1 1 1 1 0.95 0.85 0.75
Freeze for 1 min 1 1 1 1 0.95 0.95 0.75 0.75 0.75
Freeze for 2.5 min 1 1 0.95 0.95 0.85 0.75 0.75 0.75 0.75
Freeze for 5 min 1 0.95 0.95 0.85 0.75 0.75 0.75 0.75 0.75

 Table 4: The influence of icing on the stable derivative.
 3.0
 Stable derivative Variation %
 2.5 ΔCLα −1.20
 ΔCma −10
 2.0 ΔCmq −3.50
 ΔCYβ −20
 ΔClβ −10
 CL

 1.5
 ΔClp −10
 1.0 ΔClr 0
 ΔCnβ −20
 0.5 ΔCnr −6.10

 0.0
 Table 5: The influence of icing on the manipulation derivative.
 –10 –5 0 5 10 15 20 25
 αW Manipulation derivative Variation %
 ΔCLδe −9.50
 δ f = 35° δ f = 6° ΔCmδe −10
 δ f = 25° δ f = 0° ΔCYδr −8
 δ f = 15° ΔClδa −10
Figure 8: The modified curve of the lift-drag coefficient: (a) lift ΔClδr −8
coefficient and (b) drag coefficient. ΔCnδr −8.30
Mathematical Problems in Engineering 7

kCYβ · CYβ . Similarly, all aerodynamic derivatives can be 3. Icing Aerodynamic Model and
expressed as follows: Autopilot Design
 ⎪
 ⎧ 1.2% 3.5%
 ⎪
 ⎪ kCLα (t) � 1 − × t kCmq (t) � 1 − × t, 3.1. Aerodynamic Equation of the Airplane after Icing.
 ⎪
 ⎪ 5 5
 ⎪
 ⎪ Icing mainly causes the changes in aerodynamic parameters
 ⎪
 ⎪
 ⎪
 ⎪ of the aircraft. Its modeling adopts the form of correction
 ⎪
 ⎪ 10% 10%
 ⎪
 ⎪ kClβ (t) � 1 − × t kClp (t) � 1 − × t, factor. Regarding the aircraft body shafting, the linear
 ⎪
 ⎪
 ⎪
 ⎪ 5 5 models of aerodynamic forces and aerodynamic moment
 ⎪
 ⎪
 ⎪
 ⎪ coefficients can be divided into longitudinal and transverse
 ⎪
 ⎪
 ⎪
 ⎪ 20% 6.1% models. The aerodynamic parameter models after icing are
 ⎪
 ⎪ kCnβ (t) � 1 − × t kCnr (t) � 1 − × t,
 ⎪
 ⎪ 5 5 expressed as follows:
 ⎨
 ⎪
 ⎪
 ⎪
 ⎪ 9.5% 10%
 ⎪
 ⎪ kCLδ (t) � 1 − ×t kCmδ (t) � 1 − × t,
 ⎪
 ⎪
 ⎪
 ⎪ e 5 e 5
 ⎪
 ⎪
 ⎪
 ⎪
 ⎪
 ⎪
 ⎪
 ⎪ 8% 10%
 ⎪
 ⎪ kCYδ (t) � 1 − × t kClδ (t) � 1 − × t,
 ⎪
 ⎪ r 5 a 5
 ⎪
 ⎪
 ⎪
 ⎪
 ⎪
 ⎪
 ⎪
 ⎪ 8% 8.3%
 ⎪
 ⎩ kClδ (t) � 1 − × t kCnδ (t) � 1 − × t.
 r 5 r 5
 (4)

 ⎪
 ⎧
 ⎪ c
 ⎪
 ⎪ CL � kL (t, α)CL0 + kCL (t, α)CLα α + kCL (t)CLδ δe + kCLq (t)CLq q ,
 ⎪
 ⎪ δe e 2V
 ⎪
 ⎪
 ⎪
 ⎪
 ⎪
 ⎪
 ⎪
 ⎪ CD � kD (t, α)CD0 + kCD (t, α) CDα α + CDα2 α2 ,
 ⎪
 ⎪
 ⎪
 ⎪
 ⎪
 ⎪
 ⎪
 ⎪
 ⎪
 ⎪
 ⎪ C � k (t)β + k (t)C δ + C p c + C r c ,
 ⎪
 ⎪
 ⎪
 ⎪ Y CYβ CYδr Yδr r Yp
 2V Yr
 2V
 ⎪
 ⎪
 ⎨
 ⎪ (5)
 ⎪
 ⎪ c
 ⎪
 ⎪
 ⎪ Cm � Cm0 + km (t, α) kCmα (t)Cmα α + kCmδe (t)Cmδe δe + kCmq (t)Cmq q ,
 ⎪
 ⎪
 ⎪ 2V
 ⎪
 ⎪
 ⎪
 ⎪
 ⎪
 ⎪
 ⎪
 ⎪ b b
 ⎪
 ⎪ Cl � kClβ (t)Clβ β + kClδ (t)Clδa δa + kClδ (t)Clδr δr + kClp (t)Clp p + kClr (t)Clr r ,
 ⎪
 ⎪
 ⎪
 ⎪ a r 2V 2V
 ⎪
 ⎪
 ⎪
 ⎪
 ⎪
 ⎪
 ⎪
 ⎩ Cn � kC (t)Cnβ β + Cnδ δa + kC (t)Cnδ δr + Cnp p b + kC (t)Cnr r b ,
 ⎪
 nβ a nδr r
 2V nr
 2V

where CL , CD , CY are the lift, drag, and side force coefficients and polar curves of the air condition of the whole aircraft are
of the aircraft in the shaft system, respectively, Cm , Cl , Cn are shown in Figures 6 and 9.
the pitch, roll, and yaw moment coefficients of the aircraft,
δe , δr , δa are the elevator, rudder, and aileron deflection
angles, α, β are the aircraft’s angle of attack and sideslip 3.2. Altitude Hold Mode. It is necessary to maintain altitude
angle, V is the airspeed, b is the wingspan, c is the average stability during the initial stages of aircraft climb, cruise, and
aerodynamic chord length of the aircraft wing, k∗ represents landing. In the airplane altitude hold mode, the airplane can
the aircraft icing correction coefficient, which is a function of automatically maintain at a certain fixed altitude. By directly
time, where kCL , kCD , kCm are the correction coefficient close introducing the desired altitude, through the altitude dif-
to the stall angle of attack and are given in the form of two- ference signal, and the pitch attitude hold mode inner loop,
dimensional interpolation, and C∗∗ represents each aero- the aircraft attitude change is controlled to realize the
dynamic derivative. The aerodynamic data used in this paper control of the aircraft altitude. Its structure principle is
come from the wind tunnel test of the whole machine. Lift shown in Figure 10.
8 Mathematical Problems in Engineering

 3.0

 2.5

 2.0

 CL
 1.5

 1.0

 0.5

 0.0

 0.05 0.10 0.15 0.20 0.25 0.30 0.35
 αW

 δ f = 35° δ f = 6°
 δ f = 25° δ f = 0°
 δ f = 15°
 Figure 9: Polar curve of the air condition of the whole aircraft.

 Its control law can be expressed as follows:
 kHI / S
 + θref H
 Href Aircraft
 Δδa � G(s) kϕP Δϕ + kϕI Δϕdt + kp p ,
 kHp Limiter longitudinal
 + + inner loop
 – (7)
 – H
 kHD
 g
 Δδr � G(s) kψP ψ − tan ϕ + kr r − kβ βdt .
 V
Figure 10: The schematic structure diagram of the altitude hold
mode after icing.
 4. Results and Discussion
 Its control law can be expressed as follows: 4.1. The Influence of Airfoil Icing on the Airplane Mode.
 _ The longitudinal motion of the aircraft can be divided into
 θref � kHP ΔH + kHI ΔHdt − kH_ ΔH, (6) the short-period mode and long-period mode, and the
 lateral motion of the aircraft can be divided into the roll
where ΔH is the altitude difference between the aircraft mode, Dutch roll mode, and spiral mode. The mode char-
altitude command and the aircraft’s current altitude, that is, acteristic parameters with the aircraft in the state of level
ΔH � Href − H. In the figure, the longitudinal inner loop of flight at an altitude of 3000 m and a speed of 120 m/s are
the aircraft after icing is the pitch hold loop after icing. analyzed, at which the trim angle of attack α � 1.47 deg. They
 are linearized into a small disturbance equation, and the
 characteristic roots are obtained by solving the longitudinal
3.3. Roll Attitude Angle Hold Mode. In the airplane roll angle fourth-order equation of the aircraft:
hold mode, the airplane can track the expected roll angle by
controlling the ailerons. Maintaining the aircraft’s roll at- λ1,2 � −0.8989 ± 1.6257, λ3,4 � −00084 ± 0.1015. (8)
titude is mainly based on the aircraft’s full-state feedback to
increase the aircraft’s roll damping and stability so that the The natural frequency and damping ratio of the short-
aircraft can track the roll attitude angle. Due to the coupling period mode are calculated as
of the aircraft’s lateral and heading direction, the aircraft’s
roll attitude must be adjusted through two channels: the ωsp � 1.8577, ζ sp � 0.4839. (9)
lateral channel and the heading channel. In the lateral au-
tomatic control mode, the sideslip angle of the course is The natural frequency and damping ratio of the long-
generally set to 0. Due to the roll attitude angle of the aircraft, period mode are
it is necessary to ensure that the lift component in the
vertical direction of the aircraft is balanced with gravity, and ωp � 0.1018, ζ p � 0.0825. (10)
the component in the horizontal direction is balanced with
the centrifugal force of the aircraft during coordinated turns. The characteristic roots are obtained by solving the
The basic structure is shown in Figure 11. fourth-order equation of the aircraft’s lateral heading:
Mathematical Problems in Engineering 9

 Damper
 kϕI/S p
 + δa
 – –
 ϕref Steering ϕ
 kϕP Limiter
 + + gear Aircraft
 flight
 dynamics
 δr model
 Steering ψ
 kψP Limiter
 gear
 – +
 r β
 kr

 kβ/S
 + Coordinated turn
 g/V tan ϕ
 –

 Figure 11: No-slip roll angle attitude hold mode.

 λ1 � −2.9249, λ2 � 0.0024, λ3,4 � −0.2131 ± 1.1062i. basically unchanged, and the damping ratio increases. The
 time constant of the rolling mode does not change much,
 (11) indicating that, under the condition of symmetrical icing on
 The calculated roll mode time constant to the aircraft is the wing of the aircraft, when the angle of attack is small, it
 has little effect on the roll mode of the lateral heading and the
 τ r � 0.3419 s. (12) Dutch roll mode, but with the change of freezing time, the
 spiral time constant of the aircraft is subjected to great
 The natural frequency and damping ratio of the aircraft
 impact. Because the aircraft itself is relatively stable, its spiral
in the Dutch roll mode are
 time constant still meets the first-class flight quality. Gen-
 ωd � 1.1265, ζ d � 0.1892. (13) erally speaking, the change of icing time will have an impact
 on various modal parameters of the aircraft. However, since
 The spiral mode time constant of the aircraft is the angle of attack is small when the aircraft is in level flight,
 τ s � 416.67s. (14) icing has little effect on the aerodynamics of the aircraft, so
 icing has little effect on the flight quality modal parameters at
 Select the flight at an altitude of 3000 m, level flight at low angles of attack. When the aircraft is flying at low speed
90 m/s, and trim angle of attack α � 5.33 deg as the com- and high angle of attack, icing has a significant impact on the
parison of the icing situation at a higher angle of attack. The quality of the aircraft.
aircraft longitudinal modal characteristics are analyzed
under different icing conditions. Choose from nonicing to
icing for 10 minutes for calculation, and obtain the time- 4.2. Case Analysis of Flight Simulation after Icing in the Al-
varying curve of aircraft longitudinal modal parameters as titude Hold Mode. The flight in the aircraft altitude main-
shown in Figures 12 and 13. taining mode is taken as an example, and the influence of the
 It can be seen from the figure that, as the severity of icing aircraft’s icing conditions on the aircraft’s longitudinal
increases, the natural frequency of the aircraft’s short-period dynamic response is studied. Through the design of the
mode remains basically unchanged, and the natural fre- aircraft altitude hold mode, the aircraft is analyzed in the
quency rises at higher angles of attack. The natural fre- nonicing condition and the icing condition. The data of the
quencies of the long-period modes have all decreased. Both airplane flying horizontally at an altitude of 4000 m at a
short-period and long-period damping ratios have in- speed of 120 m/s are selected, the flight without freezing and
creased, and the damping ratio has increased significantly at freezing for 2 min and 5 min is simulated, and the set altitude
90 m/s, which is at a larger angle of attack. This is because in is maintained at 4100 m. The icing and nonicing simulation
level flight, the angle of attack of the aircraft is small, and the curves are shown in Figure 16.
effect of icing on the lift and drag of the aircraft is not Comparing the nonicing and icing states, the aircraft can
obvious. As the angle of attack increases, icing has a more still maintain normal flight after 2 minutes of freezing. Due
obvious impact on the aircraft flight performance. In the to the influence of icing, the drag on the aircraft increases,
same way, the time-varying curves of the transverse and the speed decreases, and the elevator efficiency decreases due
heading modal parameters can be obtained as shown in to icing. The negative deflection angle of the elevator needs
Figures 14 and 15. to be increased. The angle of attack of the aircraft increases,
 It can be seen from the figure that, in the Dutch rolling but the overall change is not significant. After 5 minutes of
mode, with the icing time, its natural frequency remains freezing, the aircraft cannot maintain altitude and fly
10 Mathematical Problems in Engineering

 1.9 0.55

 0.54
 Short-period natural frequency
 1.8

 Short-cycle damping ratio
 0.53
 1.7
 0.52

 1.6 0.51

 1.5 0.50

 0.49
 1.4
 0.48
 0 2 4 6 8 10 0 2 4 6 8 10
 Freezing time (min) Freezing time (min)

 120 m/s 120 m/s
 90m/s 90 m/s
 (a) (b)

 Figure 12: Change curves of natural frequency and damping ratio of the short-period mode with icing time.

 0.135 0.14

 0.130
 Long-period natural frequency

 0.125 0.12
 Long-period damping ratio

 0.120
 0.10
 0.115

 0.110
 0.08
 0.105

 0.100 0.06
 0.095

 0.090 0.04
 0 2 4 6 8 10 0 2 4 6 8 10
 Freezing time (min) Freezing time (min)

 120m/s 120 m/s
 90m/s 90 m/s
 (a) (b)

 Figure 13: Change curves of natural frequency and damping ratio of the long-period mode with icing time.

normally. As can be seen from the figure, before 30 s, the 4.3. Case Analysis of Flight Simulation after Icing in the Roll
aircraft can still climb normally, the speed decreases, the Attitude Hold Mode. The flight in the roll attitude hold mode
pitch angle increases, and the negative deflection angle of the is taken as an example to study the influence of the aircraft in
elevator increases. As the angle of attack of the aircraft icing conditions on the aircraft’s lateral dynamic response.
increases significantly, the aerodynamic characteristics of Through the design of the airplane roll angle hold mode,
the aircraft deteriorate further due to the influence of icing, the airplane is analyzed in the nonicing condition and the
which causes the aircraft to stall and the aircraft’s altitude to icing condition. The airplane flies horizontally at an altitude
drop sharply. Therefore, when the aircraft is in severe icing of 4000 m at a speed of 120 m/s and enters the clouds. Under
conditions, the aircraft is likely to stall due to the reduced icing conditions, a coordinated turn is made with a 20° roll
angle of attack of the aircraft in the aircraft altitude angle after flying for 200 s. The simulation curves are shown
maintaining mode. in Figure 17.
Mathematical Problems in Engineering 11

 1.15 0.23
 Dutch rolling mode natural frequency

 Dutch rolling mode damping ratio
 0.23
 1.10
 0.22

 1.05 0.22
 0.21
 1.00
 0.21

 0.95 0.20
 0.20
 0.90
 0.19
 0.85 0.19
 0 2 4 6 8 10 0 2 4 6 8 10
 Freezing time (min) Freezing time (min)

 120m/s 120m/s
 90m/s 90 m/s
 (a) (b)

 Figure 14: Change curves of natural frequency and damping ratio with icing time in the Dutch rolling mode.

 0.46 450

 0.44 400
 Rolling mode time constant (s)

 Spiral mode time constant

 350
 0.42
 300
 0.40
 250
 0.38 200

 0.36 150

 100
 0.34
 50
 0.32
 0 2 4 6 8 10 0 2 4 6 8 10
 Freezing time (min) Freezing time (min)

 120m/s 120 m/s
 90 m/s 90 m/s
 (a) (b)

 Figure 15: Change curves of time constant with icing time in the rolling mode and spiral mode.

 When the aircraft maintains a roll attitude without by the aircraft has increased significantly. Compared with
sideslip, as the freezing time increases, the aerodynamic the nonicing state, the aircraft’s angle of attack has in-
characteristics of the aircraft further deteriorate. In order creased significantly. At the same time, the aircraft’s stall
to maintain the flight altitude, the deflection angle of the angle of attack has decreased due to the icing of the
aircraft’s elevator is increased, as well as the angle of aircraft, which makes the aircraft extremely prone to stall
attack and pitch of the aircraft. Under severe icing con- and to lose control, resulting in accidents. Therefore, in
ditions, that is, icing for 5 minutes, the aircraft cannot the case of severe icing, the roll attitude maintenance
maintain the normal flight altitude, and the flight speed is mode cannot work normally, which can easily cause the
significantly reduced, indicating that the drag experienced aircraft to stall.
12 Mathematical Problems in Engineering

 120
 115
 110

 V (m/s)
 105
 100
 95
 90
 0 20 40 60 80 100
 t (s)
 4100
 4050
 4000
 H (m)

 3950
 3900
 3850
 0 20 40 60 80 100
 t (s)
 Clean
 Freeze for 2 minutes
 Freeze for 5 minutes
 (a)
 1
 Pitch angle (deg)

 0
 –1
 –2
 –3
 –4
 –5
 0 20 40 60 80 100
 t (s)
 Elevator deflection angle (deg)

 9
 8
 7
 6
 5
 4
 3
 2
 1
 0 20 40 60 80 100
 t (s)
 Clean
 Freeze for 2 minutes
 Freeze for 5 minutes
 (b)
 Figure 16: Continued.
Mathematical Problems in Engineering 13

 6
 5

 Angle of attack (deg)
 4
 3
 2
 1
 0
 –1
 0 20 40 60 80 100
 t (s)
 8
 7
 Pitch rate (deg/s)

 6
 5
 4
 3
 2
 1
 0 20 40 60 80 100
 t (s)
 Clean
 Freeze for 2 minutes
 Freeze for 5 minutes
 (c)

Figure 16: Aircraft state curves under different icing conditions in the altitude hold mode: (a) curves of height and speed, (b) curves of pitch
angle and elevator deflection angle, and (c) curves of angle of attack and pitch speed.

 7
 6
 Pitch angle (deg)

 5
 4
 3
 2
 1
 0
 0 20 40 60 80 100
 t (s)
 25
 20
 Roll angle (deg)

 15
 10
 5
 0
 0 20 40 60 80 100
 t (s)
 Clean
 Freeze for 2 minutes
 Freeze for 5 minutes
 (a)
 Figure 17: Continued.
14 Mathematical Problems in Engineering

 125
 120
 115
 V (m/s)
 110
 105
 100
 95
 90
 0 20 40 60 80 100
 t (s)
 4050
 A
 4000
 3950
 3900
 H (m)

 3850
 3800
 3750
 3700
 0 20 40 60 80 100
 t (s)

 Clean
 Freeze for 2 minutes
 Freeze for 5 minutes
 (b)
 1.5
 1.0
 Pitch angle ratio

 0.5
 (deg/s)

 0.0
 –0.5
 –1.0
 0 20 40 60 80 100
 t (s)
 14
 12
 Roll angle ratio

 10
 8
 (deg/s)

 6
 4
 2
 0
 –2
 0 20 40 60 80 100
 t (s)

 Clean
 Freeze for 2 minutes
 Freeze for 5 minutes
 (c)
 Figure 17: Continued.
Mathematical Problems in Engineering 15

 2

 Aileron deflection
 0
 –2
 (deg) –4
 –6
 –8
 –10
 0 20 40 60 80 100
 t (s)
 2
 1
 Elevator deflection

 0
 angle (deg)

 –1
 –2
 –3
 –4
 –5
 –6
 0 20 40 60 80 100
 t (s)

 Clean
 Freeze for 2 minutes
 Freeze for 5 minutes
 (d)
 1.2
 Sideslip angle (deg)

 1.0
 0.8
 0.6
 0.4
 0.2
 0.0
 –0.2
 –0.4
 –0.6
 –0.8
 0 20 40 60 80 100
 t (s)
 9
 Angle of attack (deg)

 8
 7
 6
 5
 4
 3
 2
 1
 0 20 40 60 80 100
 t (s)

 Clean
 Freeze for 2 minutes
 Freeze for 5 minutes
 (e)

Figure 17: Aircraft state curves under different icing conditions in the roll attitude hold mode: (a) curves of roll angle and pitch angle, (b)
curves of height and speed, (c) curves of roll angle speed and pitch angle speed, (d) curves of the deflection angle of the elevator and aileron,
and (e) curves of airflow angle.

5. Conclusions (2) This paper selects NASA’s clear ice icing data with
 serious icing influence from the NACA 23012 airfoil
 (1) An icing influence model for real-time simulation icing data. The linear phase and the stall phase are
 based on icing time and aircraft angle of attack is modeled separately, and the two-dimensional in-
 established. According to the classification of terpolation method is used for correction, which is
 icing geometry, it is concluded that spanwise- mainly divided into the correction of the lift-drag
 ridge ice has the greatest influence on the aero- coefficient of the linear zone and the stall zone and
 dynamic characteristics of the airfoil. the correction of the aircraft stability derivative and
16 Mathematical Problems in Engineering

 the control derivative. The correction results turn out Aerospace Sciences Meeting and Exhibit, Reno, NV, USA,
 to be good. January 2000.
 [9] W. Dale II., “An evaluation of an analytical simulation of an
 (3) Airplane modes under different icing conditions airplane with tailplane icing by comparison to flight data,”
 were analyzed, the results of which showed that, National Aeronautics and Space Administration, Scientific
 under icing conditions, in the range of small angles and Technical Information Branch, Washington, DC, USA,
 of attack, icing has no obvious influence on the NASA/CR-2000-210561, 2000.
 aircraft mode. As the degree of icing increases, the [10] A. Lampton and J. Valasek, “Prediction of icing effects on the
 throttle skewness and the negative deflection angle of lateral/directional stability and control of light airplanes,”
 the aircraft for level flight continue to increase. The Aerospace Science and Technology, vol. 23, no. 1, pp. 305–311,
 icing flight case in altitude hold and roll hold modes 2012.
 shows that flying in severe icing and in the autopilot [11] A. Lampton and J. Valasek, “Prediction of icing effects on the
 mode is very dangerous and prone to cause the coupled dynamic response of light airplanes,” Journal of
 Guidance, Control, and Dynamics, vol. 31, no. 3, pp. 656–673,
 aircraft to stall.
 2008.
 [12] M. A. Cunningham, A Simplified Icing Model for Simulation
Data Availability and Analysis of Dynamic Effects, West Virginia University,
 Morgantown, WV, USA, 2012.
The data used to support the findings of this study are [13] M. Papadakis and A. Rachman, “Water impingement ex-
available from the corresponding author upon request. periments on a NACA 23012 airfoil with simulated glaze ice
 shapes,” in Poceedings of the 42nd AIAA Aerospace Sciences
 Meeting and Exhibit, Reno, NV, USA, January 2004.
Conflicts of Interest [14] T. P. Ratvasky, AIrcraft Icing and its Effects on Performance
 and Handling, NASA Glenn Research Center, Cleveland, OH,
The authors declare that there are no conflicts of interest USA, 2008.
regarding the publication of this paper.

Acknowledgments
This study was supported by the National Natural Science
Foundation of China (no. 61873351).

References
[1] T. L. Frank and K. Abdollah, “Effects of ice accretions on
 aircraft aerodynamics,” Progress in Aerospace Sciences, vol. 37,
 no. 8, pp. 669–767, 2001.
[2] T. P. Ratvasky, J. F. V. Zante, and J. T. Riley, “NASA/FAA tail-
 plane icing program overview,” in Proceedings of the 37th
 Aerospace Sciences Meeting and Exhibit, Reno, NV, USA,
 January 1999.
[3] T. P. Ratvasky, J. F. V. Zante, and A. Sim, “NASA/FAA tail-
 plane icing program: flight test report,” National Aeronautics
 and Space Administration, Washington, DC, USA, NASA/
 TP-2000-209908, 2000.
[4] R. J. Ranaudo, “The measurement of aircraft performance and
 stability and control after flight through natural icing condi-
 tions,” in Proceedings of the 3rd Flight Testing Conference and
 Technical Display, Las Vegas, NV, USA, April 1986.
[5] R. J. Ranaudo and J. G. Batterson, “Determination of longi-
 tudinal aerodynamic derivatives using flight data from an
 icing research aircraft,” in Proceedings of the 27th Aerospace
 Sciences Meeting, Reno, NV, USA, January 1989.
[6] R. Miller, W. Ribbens, The effects of icing on the longitudinal
 dynamics of an icing research aircraft,” in Proceedings of the
 37th Aerospace Sciences Meeting and Exhibit, Reno, NV, USA,
 January 1999.
[7] K. Vladislav, G. B. James, and C. Patrick, “Determination of
 airplane model structure from flight data using modified
 stepwise regression,” National Aeronautics and Space Ad-
 ministration, Scientific and Technical Information Branch,
 Washington, DC, USA, NASA TR-1916, 1981.
[8] M. B. Bragg, T. Hutchison, and J. Merret, “Effect of ice ac-
 cretion on aircraft flight dynamics,” in Proceedings of the 38th
You can also read