The Effect of Service Quality and Customer Satisfaction on Purchasing Intention: A Case Study in Indonesia
←
→
Page content transcription
If your browser does not render page correctly, please read the page content below
Adelheid Rinny MAHARSI, Rosemarie Sutjiati NJOTOPRAJITNO, Bram HADIANTO, Jessica WIRAATMAJA /
                                    Journal of Asian Finance, Economics and Business Vol 8 No 4 (2021) 0475–0482                                         475

Print ISSN: 2288-4637 / Online ISSN 2288-4645
doi:10.13106/jafeb.2021.vol8.no4.0475

                    The Effect of Service Quality and Customer Satisfaction on
                        Purchasing Intention: A Case Study in Indonesia*

                                       Adelheid Rinny MAHARSI1, Rosemarie Sutjiati NJOTOPRAJITNO2,
                                                           Bram HADIANTO3, Jessica WIRAATMAJA4

                                Received: September 30, 2020                    Revised: February 22, 2021 Accepted: March 02, 2021

                                                                                        Abstract
This research intends to examine and analyze the service quality effect on petrol buying intention through satisfaction when the Maranatha
Christian University lecturers spend their money in the Pertamina-affiliated gas stations in Bandung. To attain this goal, we develop
four relevant hypotheses to be tested. Furthermore, we use simple random sampling to acquire samples by denoting a sample size set
by the Slovin formula. To collect the responses, we use the online survey and fruitfully yield a 53.54% rate with a total of 106 lecturers
participating in completing the distributed questionnaire link. This number is near 100; hence, we employ a structural equation model with a
variance basis to analyze them. After examining the data and conferring the results, we conclude three things. First, service quality does not
affect purchasing intention, but customer satisfaction positively does. Second, service quality has a positive impact on customer satisfaction.
Finally, consumer satisfaction successfully mediates the effect of service quality on the intention to buy. Based on these conclusions, this
paper finds the superior service to the petrol buyers is the key driver for the gas stations under Pertamina control to effectively compete with
their rivals in the marketplace, especially in Bandung.

Keywords: Customer Satisfaction, Gas Station, Intention to Buy, Service Quality, Perception

JEL Classification Code: I23, L95, M30, M31

                                                                                                 1. Introduction
                                                                                                     Pertamina is an Indonesian state-owned oil and
*Acknowledgements:
 We appreciate Maranatha Christian University for the supporting
                                                                                                 natural gas corporation based in Jakarta that is responsible
 fund of this study.                                                                             for producing and distributing petrol and supervising
 First Author. Lecturer, Management Department, Faculty of
1
                                                                                                 its distribution to society (Kuncoro et al., 2009). By
 Economics, Maranatha Christian University, Bandung, Indonesia.                                  understanding the customer perspective, this corporation
 Email: arin.maharsi@gmail.com
 Lecturer, Management Department, Faculty of Economics,
2                                                                                               can deliver an exceptional experience. Hence, the customer
 Maranatha Christian University, Bandung, Indonesia.                                             focus can be the priority in every decision made to beat
 Email: rosemarie.sutjiati@gmail.com                                                             the competition. Nationally, Pertamina has six competitors
 Corresponding Author. Lecturer, Management Department, Faculty
3
                                                                                                 having gas stations: Vivo Energy (VE), Total Oil Indonesia
 of Economics, Maranatha Christian University, Bandung, Indonesia
 [Postal Address: Jl. Prof. Drg. Suria Soemantri, MPH. No. 65,                                   (TOI), Aneka Retroindo Raya (ART), Exxon Mobil Indonesia
 Bandung 40164, Indonesia] Email: tan_han_sin@hotmail.com                                        (EMI), AKR Corporindo (AKRC), and Shell Indonesia
 Management Department, Faculty of Economics, Maranatha
4
                                                                                                 (SI) (Mustika, 2019). In Bandung, Pertamina only has two
 Christian University, Bandung, Indonesia.
 Email: jessicawiraatmaja16@gmail.com
                                                                                                 competitors. They are TOI and SI affiliated with the French
                                                                                                 and Malaysian companies (Mustika, 2019). By observation
© Copyright: The Author(s)
This is an Open Access article distributed under the terms of the Creative Commons Attribution   of the Google Map, Pertamina has 147 affiliated gas stations
Non-Commercial License (https://creativecommons.org/licenses/by-nc/4.0/) which permits
unrestricted non-commercial use, distribution, and reproduction in any medium, provided the
                                                                                                 providing petrol. Conversely, TOI and SI own one and three
original work is properly cited.                                                                 stations, individually.
Adelheid Rinny MAHARSI, Rosemarie Sutjiati NJOTOPRAJITNO, Bram HADIANTO, Jessica WIRAATMAJA /
476 Journal of Asian Finance, Economics and Business Vol 8 No 4 (2021) 0475–0482
According to Directorate for Human Resource Internal The second is the impact of SQ on CS. The third is the CS
data, Maranatha Christian University (MCU) has 441 lecturers mediating role on the service quality impact on the purchase
in the nine faculties: medicine, engineering, psychology, intention in Pertamina-affiliated gas stations in Bandung, indeed,
letters-and-culture, economics, art-and-design, information based on the perception of the lecturers working at MCU.
technology, law, and dentistry as of March 2020. Based on the
information from the head of security and parking in MCU, 2. Literature Review
Buddy Supriadi, 391 of them register their vehicles to get
free parking in the working days. This total consists of 73 car When studying the service quality effect on store
owners and 318 motorcycle owners. MCU is located on Jl. visitor purchase intention, Kim (2013) found a positive
Prof. Drg. Suria Soemantri, MPH No.65, Bandung; hence, its relationship. Furthermore, Aptaguna and Pitaloka (2016)
lecturers prefer buying petrol in the two gas stations affiliated showed that service quality positively contributed to the user
with Pertamina near their workplace. Therefore, this research intention of Go-Ojek. This positive contribution was also
is relevant to reveal the determinants of their buying intention supported by Banjarnahor (2017), who analyzed the effects
in the Pertamina-affiliated gas stations. of service quality on purchase intention of internet services
As the least possible, two determinants of buying in West Jakarta. Likewise, the same result was confirmed
intention exist based on the previous research evidence: by Murwanti and Pratiwi (2017), who investigated the effect
service quality and customer satisfaction. However, based of service quality on utilizing the garage of the motorcycle.
on the initial research, their impact is not consistent. For After studying the impact of service quality on the dealer
service quality as the first antecedent, Aptaguna and Pitaloka user intention, Widyastuti et al. (2017) summarized a positive
(2016), Banjarnahor (2017), Murwanti and Pratiwi (2017), sign. Similarly, Alharthey (2019) proved a positive effect of
Widyastuti et al. (2017), Octaviana and Nugrahaningsih service quality on grocery buying intention. Also, Naveed
(2018), Alharthey (2019), Wiyadi and Ayuningtyas (2019), et al. (2019) confirmed a similar impact when investigating the
and Naveed et al. (2019) confirm its positive presence. canteen products. Likewise, Wiyadi and Ayuningtyas (2019)
Unfortunately, other scholars find no impact (Mambu, 2015; verified that service quality positively affects purchasing a
Widajanti & Suprayitno, 2017; Wonggotwarin & Kim, 2017). motorcycle. Hence, the first hypothesis is stated as follows:
For customer satisfaction as the second determinant of
buying intention, this positive impact is demonstrated by H1: Service quality has a positive effect on the intention
Iskandar et al. (2015), Salem et al. (2015), Banjarnahor (2017), to buy.
Nodira and Přemysl (2017), Murwanti and Pratiwi (2017), Putri
In their study, Iskandar et al. (2015) showed a positive
and Astuti (2017), Widajanti and Suprayitno (2017), Alharthey
influence of customer satisfaction on durian soup buying
(2019), Hong et al. (2020), Lamai et al. (2020), and Tran and
intention. Consistently, Salem et al. (2015) found this impact
Le (2020). Conversely, another researcher, Octaviana and
on the college students becoming the users of the Dell-branded
Nugrahaningsih (2018), shows no effect.
laptop, Banjarnahor (2017) and Nodira and Přemysl (2017) on
Besides, customer satisfaction can be positively affected
the fruit juice users; Murwanti and Pratiwi (2017), and Putri
by service quality, as shown by Kim (2013), Iskandar et al.
and Astuti (2017) on the users of pasta and chocolate blends;
(2015), Banjarnahor (2017), Putri and Astuti (2017), Murwanti
Widajanti and Suprayitno (2017) on the steak consumers.
and Pratiwi (2017), Dawi et al. (2018), Octaviana and
Also, Alharthey (2019) affirmed this influence when learning
Nugrahaningsih (2018), Alharthey (2019), and Tjahjaningsih
about grocery buyers, and so did Hong et al. (2020) and
et al. (2020). On the other hand, the study by Naik et al. (2010)
Lamai et al. (2020) when surveying the auto maintenance and
shows no impact.
repair service users and the restaurant visitors, respectively.
Additionally, the previous scholars attempt to prove
Additionally, Tran & Le (2020) found the same tendency
that customer satisfaction is the mediating factor of the
when researching convenience store customers. Hence, the
service quality effect on buying intention (Kalia et al., 2016;
second hypothesis is stated as follows:
Murwanti & Partiwi, 2017; Putri & Astuti, 2017; Octaviana
& Nugrahaningsih, 2018). However, the findings of these H2: Customer satisfaction has a positive effect on the
studies are also inconsistent. In their research, Kalia et al. intention to buy.
(2016), Murwanti and Pratiwi (2017), and Putri and Astuti
(2017) succesfully prove this mediating effect, but Octaviana When investigating the service quality effect on store visitor
and Nugrahaningsih (2018) do not. satisfaction, Kim (2013) displayed a positive association.
Based on the above inconsistent findings of different Similarly, Iskandar et al. (2015) found that all the service
researcher investigations, this study attempts to prove and quality dimensions positively influence customer satisfaction.
analyze three things. The first is the effect of service quality Likewise, the study of Bajarnahor (2017), Putri and Astuti
(SQ) and consumer satisfaction (CS) on buying intention. (2017), Murwanti and Pratiwi (2017), Dawi et al. (2018),Adelheid Rinny MAHARSI, Rosemarie Sutjiati NJOTOPRAJITNO, Bram HADIANTO, Jessica WIRAATMAJA /
Journal of Asian Finance, Economics and Business Vol 8 No 4 (2021) 0475–0482 477
Alharthey (2019), and Tjahjaningsih et al. (2020) confirmed exogenous and endogenous. The exogenous has a role in
that customer satisfaction was positively affected by service explaining the outcome. However, the endogenous has a
quality. Hence, the third hypothesis is stated as follows. function to be described.
The exogenous variable is service quality, where its
H3: Service quality has a positive effect on customer dimensions and their items are adopted from Tjiptono et al.
satisfaction. (2004) (see Table 1).
The endogenous variable is customer satisfaction and
When investigating online purchasing behavior in intention to buy, where the items are adopted from Olsen et al.
India, Kalia et al. (2016) showed that service quality was (2013) and Wang and Hazen (2016) (see Table 2).
a mediating variable in the relationship between electronic
service quality and buying intention in the future. Similarly, 3.2. Population, Samples, and Method to
after using the Sobel test, the study of Murwanti and Pratiwi Accumulate Data
(2017) and Putri and Astuti (2017) exhibited that customer
satisfaction acted as a mediator in the relationship between This study population is 391 lecturers working at MCU
service quality and buying intention in Indonesia. Hence, the having registered vehicles with free parking at the MCU.
fourth hypothesis is stated as follows. Moreover, to estimate the sampling size, the Slovin formula
is utilized. According to Suliyanto (2009), this formula
H4: Customer satisfaction mediates the effect of service involves the margin of error and the population size, as seen
quality on the intention to buy. in the first equation.
3. Research Method N
n (1)
3.1. Variables and Operationalization 1
Ne 2
The employed variables are latent in the two models: the In the first equation, n and N show the sample
first order and the second one. In the first-order model, the number and population size, respectively. Furthermore,
latent variable only has items. Meanwhile, in the second- e is the error margin decided by the researchers. By
order model, the latent has dimensions and items. Based utilizing a 5% margin of error, we get the total samples
on the position, the variable can be divided into two types: 391
( n) 197.72
198 .
1
391*(5%) 2
Table 1: The Dimensions of Service Quality and their Indicators
Dimension Symbol Indicators
Tangibility T1 Pertamina affiliated-gas stations provide the modern means of payment of petrol.
T2 Gas stations affiliated with the Pertamina provide visually attractive facilities.
T3 The staff at the gas station affiliated with Pertamina are dressed neatly.
T4 Information about the type of petrol available is written around the station.
Reliability REL1 There is an accurate filling of petrol always in Pertamina-affiliated gas stations.
REL2 Pertamina-affiliated gas stations always open and close according to their schedule.
Responsiveness RES1 The staff at the Pertamina-affiliated gas station serve their customers quickly.
RES2 Pertamina-affiliated gas station’s staff always remind vehicle drivers to put out/extinguish
their cigarette or not smoke and turn off the engine during petrol purchase.
RES3 Pertamina-affiliated gas station’s staff always remind both the driver and passengers in
the vehicle to turn off their cellular phones during petrol purchase.
Assurance A1 The staff at the Pertamina-affiliated gas station are polite.
A2 The Pertamina-affiliated gas station staff can answer customers’ questions, like vehicle
drivers, owners, passengers.
Empathy EMP1 Operating hours of Pertamina–affiliated gas station make its customers calm.
EMP2 The staff at the Pertamina-affiliated gas station prioritize their customer interest.Adelheid Rinny MAHARSI, Rosemarie Sutjiati NJOTOPRAJITNO, Bram HADIANTO, Jessica WIRAATMAJA /
478 Journal of Asian Finance, Economics and Business Vol 8 No 4 (2021) 0475–0482
Table 2: Customer Satisfaction, Intention to Buy, and their Indicators
Endogenous
Indicators Source
Variable
Customer I get a good service when buying petrol in the gas station affiliated with Pertamina Modified from
satisfaction (CS1). Olsen et al. (2013)
I feel happy with the service when purchasing petrol in the gas station affiliated with
Pertamina (CS2).
I enjoy the service given by the Pertamina affiliated gas stations (CS3).
Intention to I prefer to buy petrol in gas stations affiliated with Pertamina (ITB1). Modified from
buy I will recommend my friend buying petrol in the gas stations affiliated with Pertamina Wang and Hazen
(ITB2). (2016)
Then, we distributed questionnaires to 198 lecturers
through the online mode. Likewise, to measure their response,
we employed a 5-point Likert scale, where “1” means strongly
disagree, and “5’’ means strongly agree (Sugiyono, 2019).
3.3. Validity and Reliability Test
Validity and reliability test are utilized to measure the
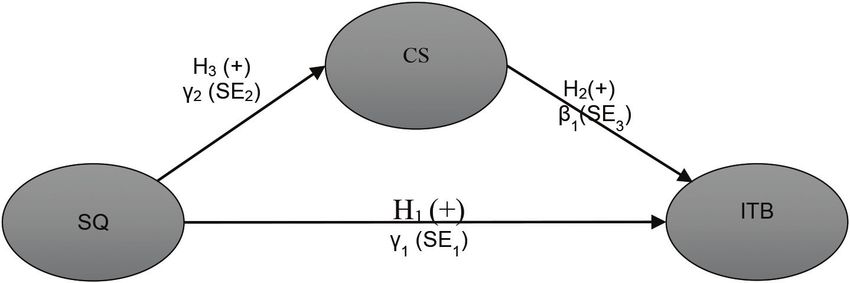
Figure 1: Research Model
instrument quality, taking the form of the questionnaire.
• The validity measures the respondent response 2 *
1
accuracy. Furthermore, we use confirmatory factor Z -statistic for Sobel = (2)
SE
analysis (CFA) to execute it by loading factor (LF)
and average variance extracted (AVE). According
to Sholihin and Ratmono (2013), if the LF and AVE where SE = SQRT((γ22)*(SE32) + (β12)*(SE22) + (SE22 * SE32))
exceed 0.5, the respondent answer on the question items Moreover, the probability (2-tailed) of the Z-statistic for
is convergently and discriminantly valid, respectively. Sobel is calculated by the Microsoft Excel formula as shown
• The reliability measures the response consistency. in equation 3.
Moreover, we employ the composite reliability
NORM.DIST (Z-statistic; 0;1; FALSE) (3)
coefficient to inspect the reliable condition, as
explained by Sholihin and Ratmono (2013). If this To prove the mediating effect of CS, we follow the
coefficient exceeds 0.7 as its cut-off point, the valid following rule:
answer on the question items is consistent.
a. If the probability of the Z-statistic is lower than 5%,
3.4. Method for Analyzing Data the mediating effect exists.
b. If the Z-statistic probability is similar to or higher
This study employs the structural equation model based than 5%, the mediating effect is not present.
on variance. It is because the total number of lecturers who
responded to the questionnaires was 106. This number is
close to Ghozali (2008), who stated 100 as the maximum. 4. Results and Discussion
The research model is shown in Figure 1.
Contrasting the probability of t-statistic for the path 4.1. Descriptive Statistics
coefficient of γ1, γ2, and β1 from the WarpPLS7 output, a 5%
significant level (α) is essential to test the first, second, and This survey was held in April 2020. Of 198 lecturers,
third null hypotheses. If the probability is lower than α, the only 106 participated. Thus, the response rate was
null hypothesis becomes accepted, and vice versa. 106
100%
53.54%. Fortunately, this rate is still acceptable
Additionally, this study uses the Sobel test. This test 198
utilizes the path coefficients and their standard error based because of above 20%, as Sugiyanto et al. (2018) suggest.
on the model estimation output to prove the mediating Furthermore, 106 lecturers are from nine faculties, with the
effect of consumer satisfaction. The formula is in the second total detailed in Panel A of Table 3. Their other features: gender
equation. and tenure, are also presented in Panels B and C.Adelheid Rinny MAHARSI, Rosemarie Sutjiati NJOTOPRAJITNO, Bram HADIANTO, Jessica WIRAATMAJA /
Journal of Asian Finance, Economics and Business Vol 8 No 4 (2021) 0475–0482 479
Table 3: The Total Lecturers Based on Faculty Origin, Gender, and Tenure
Panel A. The total lecturers based on faculty origin
The name of the faculty The number of lecturers Percentage (%)
Medicine 10 9.43
Engineering 18 16.98
Psychology 6 5.66
Letter and culture 10 9.43
Economics 26 24.53
Art and design 10 9.43
Information technology 6 5.66
Law 12 11.32
Dentistry 8 7.55
Total 106 100
Panel B. The total number of lecturers based on gender
Category The number of lecturers Percentage (%)
Male 52 49.06
Female 54 50.94
Total 106 100.00
Panel C. The total lecturers based on tenure
Category The number of lecturers Percentage (%)
Below ten years 21 19.81
Between 11 and 20 years 25 23.58
Between 21 and 30 years 36 33.96
Between 31 and 40 years 24 22.64
Total 106 100.00
Table 4: Cross-loading Factors, AVE, the Composite Reliability Coefficient
TANG EMP REL RES AS CS ITB
T1 0.694 –0.315 0.247 –0.164 0.113 –0.139 0.518
T2 0.764 0.005 –0.367 0.078 –0.18 –0.346 0.128
T3 0.669 0.259 –0.139 –0.261 0.653 0.062 –0.116
T4 0.722 0.057 0.28 0.317 –0.524 0.443 –0.527
EMP1 –0.066 0.795 0.005 0.262 –0.119 –0.256 0.022
EMP2 0.066 0.795 –0.005 –0.262 0.119 0.256 –0.022
REL1 0.047 –0.368 0.84 0.086 –0.108 0.607 –0.087
REL2 –0.047 0.368 0.84 –0.086 0.108 –0.607 0.087
RES2 –0.111 0.06 –0.043 0.919 –0.226 0.338 –0.038
RES3 0.111 –0.06 0.043 0.919 0.226 –0.338 0.038
A1 –0.135 0.016 0.089 –0.067 0.91 0.228 –0.04
A2 0.135 –0.016 –0.089 0.067 0.91 –0.228 0.04
CS1 –0.19 –0.04 0.111 –0.045 0.014 0.946 0.031
CS2 –0.251 0.056 0.074 –0.088 0.105 0.948 0.042
CS3 0.552 –0.02 –0.232 0.167 –0.15 0.757 –0.091
ITB1 –0.125 0.177 –0.218 –0.041 –0.085 0.403 0.906
ITB2 0.125 –0.177 0.218 0.041 0.085 –0.403 0.906
AVE 0.508 0.633 0.706 0.844 0.828 0.789 0.822
Composite reliability coefficient 0.805 0.775 0.827 0.916 0.906 0.918 0.902Adelheid Rinny MAHARSI, Rosemarie Sutjiati NJOTOPRAJITNO, Bram HADIANTO, Jessica WIRAATMAJA /
480 Journal of Asian Finance, Economics and Business Vol 8 No 4 (2021) 0475–0482
4.2. Validity and Reliability Test Result 4.4. Discussion
Table 4 presents the relevant loading factor for consumer From the prior section, it can be revealed that service quality
satisfaction, intention to buy, and the dimension of tangibility, does not directly affect the buying intention, but it indirectly
empathy, reliability, responsiveness, assurance items (see the affects this intention through customer satisfaction. Hence,
grey-highlighted value). All the highlighted loading factor customer satisfaction can mediate the service quality influence
values exceed 0.5; hence, the respondent answer achieves on purchase/buying intention. The absence of the service quality
convergent validity. Also, AVE goes beyond 0.5 so that their effect on this intention supports the study of Mambu (2015),
response fulfills the discriminant validity. The composite Widajanti and Supriyatno (2017), and Wonggotwarin and Kim
reliability coefficient is over 0.7. Therefore, their response is (2017). Furthermore, a positive influence of customer service
consistent or accomplishes the reliability test. on the purchase/buying intention is in line with the studies of
Iskandar et al. (2015), Salem et al. (2015), Banjarnahor (2017),
4.3. Estimation Result of Structural Nodira and Přemysl (2017), Murwanti and Pratiwi (2017),
Equation Model Putri and Astuti (2017), Widajanti and Suprayitno (2017),
Alharthey (2019), Hong et al. (2020), Lamai et al. (2020), and
Table 5 exhibits the estimation result of the structural Tran and Lee (2020). Meanwhile, a positive impact of service
equation model. In this table, the path coefficient, standard quality on customer satisfaction confirms the earlier research
error, t-statistic, and probability value to test hypotheses one, of Kim (2013), Iskandar et al. (2015), Banjarnahor (2017),
two, and three are available (see Panel A) and parameters Putri and Astuti (2017), Murwanti and Pratiwi (2017), Dawi
related to the Sobel test (see Panel B). et al. (2018), Octaviana and Nugrahaningsih (2018), Alharthey
To prove the first, second, and third null hypotheses, we (2019). Additionally, the mediating effect of customer
liken the probability of t-statistic with a 5% significance satisfaction confirms the work of Kalia et al. (2016), Murwanti
level. In Table 5 of Panel A, this value is 0.448 for and Pratiwi (2017), and Putri and Astuti (2017).
SQ ITB. Because this value is higher than 5%, we accept Hence, from the above results, we can conclude that
the null hypothesis declaring that service quality does not MCU lecturers prefer gas stations affiliated with Pertamina.
influence the intention to buy. To be attractive, the owners of a gas station, through their
In the same panel, the probability is < 0.0001 for staff members on duty giving the service to customers,
SQ CS and CS ITB. Because this probability is lower must conform to the Pertamina regulations regarding safety,
than 5%, we accept the alternative hypothesis declaring quality, and reliability. The members have to remind the
that service quality positively affects customer satisfaction, drivers or passengers to turn off their engine and cellphones
and customer satisfaction positively impacts the intention during refueling. This rule is useful to avoid static electricity
to buy. leading to a spark of flame. As the worst consequence, it
To verify consumer satisfaction as the mediating effect, can explode the petrol station. Besides, ease of payment is
we employ the Sobel test, where the result is shown in Panel also a positive point; for example, customers can pay online
B of Table 5. In this panel, the probability of Z-statistic is via an electronic data capturing machine. Additionally, the
0.0000, which is lower than 5%. Consequently, consumer staff members must be polite, dress neatly, wear the proper
satisfaction mediates the effect of service quality on the uniform, answer customer questions patiently and correctly,
intention to buy. and be accurate and honest when refueling their vehicles.
Table 5: The Estimation Result of the Structural Equation Model Based on Variance
Panel A. The partial test result of hypothesis one, two, and three
Study
Hypothesis Causal association Path coefficient Standard error t-statistic p-value
One SQ ITB –0.019 0.144 –0.13194 0.448
Two CS ITB 0.830 0.043 19.30233 < 0.001
Three SQ CS 0.798 0.041 19.46341 < 0.001
Panel B. The mediating Sobel test result of consumer satisfaction
Study Multiplication between
Causal association Standard error Z-statistic p-value
Hypothesis path coefficients
Four SQ CS ITB 0.66234 0.04832692 13.70540 0.0000Adelheid Rinny MAHARSI, Rosemarie Sutjiati NJOTOPRAJITNO, Bram HADIANTO, Jessica WIRAATMAJA /
Journal of Asian Finance, Economics and Business Vol 8 No 4 (2021) 0475–0482 481
5. Conclusion repair service. Journal of Distribution Science, 18(1), 59–69.
https://doi.org/10.15722/jds.18.1.202001.59
As the answer to this research goal, we infer three points. Iskandar, D., Nurmalina, R., & Riani, E. (2015). The effect of
First, the purchase intention is not determined by service service, product quality, the perceived value on consumer
quality but positively affected by customer satisfaction. purchase intention. Indonesian Journal of Business and
Second, customer satisfaction is positively influenced by Entrepreneurship, 1(2), 51–62. https://doi.org/10.17358/
service quality. Last, the service quality impact on the intention IJBE.1.2.51
to buy is successfully mediated by consumer satisfaction. Kalia, P., Arora, R., & Kumalo, S. (2016). Service quality,
By concerning the limitations of this study, such as utilizing consumer satisfaction, and future purchase intentions in e-retail.
the respondents in the narrow population scope: the lecturers E-Service Journal, 10(1), 24–41. https://doi.org/10.2979/
working at Maranatha Christian University and using one eservicej.10.1.02
determinant factor of customer satisfaction and intention to Kim, G. C. (2013). A study on the effects of super-supermarket
purchase, the future scholars are expected to overcome these service quality on satisfaction in-store selection. Journal of
two things based on the following suggestions. Industrial Distribution & Business, 4(2), 41–49. https://doi.
org/10.13106/jidb.2013.vol4.no2.41.
• They can utilize the lecturers from the higher education Kuncoro, M., Tandelilin, E., Ancok, D., Basuki, H., Purbasari,
from the private and public institutions in West Java to D. P., Adji, A., Wulandaru, D. R., Jurnasin, E., Purwoto, H.,
represent their perspective and the sub-group analysis Sulistyaningrum, E., & Fitradi, A. (2009). A transformation of
testing to prove the institution types as the moderating Pertamina: The Dilemma between business and public service
variable. orientations. Yogyakarta: Penerbit Galangpress.
• They can use the other determinants of customer Lamai, G. H., Thavorn, J., Klongthong, W., & Ngamkroeckjoti,
satisfaction and intention to buy. For customer satisfaction C. (2020). Critical factors influencing revisit intention of
antecedents, the customer experience and product quality large restaurant chains in Myanmar. Journal of Distribution
become the proposed alternative. Meanwhile, they can Science, 18(12), 31–43. https://doi.org/10.15722/jds.18.12.
apply the perceived value, customer trust, brand image, 202012.31
and price for purchasing intention determining factors. Mambu, E. (2015). The influence of brand image and service
quality on the customer intention to use Blue Bird Taxi Manado.
References Jurnal Riset Ekonomi, Manajemen, Bisnis, dan Akuntansi, 3(4),
645–653. https://media.neliti.com/media/publications/2861-
Alharthey, B. K. (2019). Impact of service quality on customer EN-the-influence-of-brand-image-and-service-quality-toward-
trust, purchase intention, and store loyalty, with mediating consumer-purchase-intent.pdf
role of customers’ satisfaction on customer trust and purchase
Murwanti, S., & Pratiwi, A. P. (2017). The impact of service quality
intention: Study of grocery shopping. British Journal of
and promotion on the using intention by customer satisfaction as
Marketing Studies, 7(2), 40–61. https://www.eajournals.org/
mediating variable: A study in a motorcycle garage of Ahass at
wp-content/uploads/Impact-of-Service-Quality-on-Customer-
branch UMS. Proceeding of National Seminar of Management
Trust-Purchase-Intention-and-Store-Loyalty.pdf
and Business Research: The Development Concept and
Aptaguna, A., & Pitaloka, E. (2016). The impact of service quality E-business Studies in Indonesia (pp. 207–227). Surakarta:
and price on the intention to use the Go-Jek services. Widyakala, Muhammadiyah University Press. https://publikasiilmiah.ums.
3, 49–56. https://doi.org/10.36262/widyakala.v3i0.24 ac.id/handle/11617/8984
Banjarnahor, J. (2017). The antecedent of customer satisfaction and its Mustika, N. (2019). The competitors threaten Pertamina in the
effect on purchase intention. Jurnal Manajemen dan Pemasaran gas station business. https://www.finansialku.com/pertamina-
Jasa, 10(1), 141–156. https://doi.org/10.25105/jmpj.v10i1.1680 terancam-pesaing
Dawi, N. M., Jusoh, A., Streimikis, J., & Mardani, A. (2018). Naik, C. N., Gantasala, S. B., & Prabhakar, G. V. (2010). Service
The influence of service quality on customer satisfaction and quality and its effect on customer satisfaction in retailing.
customer behavioral intentions by moderating the role of European Journal of Social Sciences, 16(2), 231–243. https://
switching barriers in the satellite pay-TV market. Economics pdfs.semanticscholar.org/d124/e866687313a05a8ae38c2cd8d7
and Sociology, 11(4), 198–218. https://doi.org/10.14254/2071- f49e257830.pdf
789X.2018/11-4/13
Naveed, R. T., Ahmad, N., Albassami, A. M., & Moshfegyan, M.
Ghozali, I. (2008). The structural equation modeling: The
(2019). The impact of store image and store service quality
alternative method by partial least square. Semarang: Badan
on purchase intentions: A study from armed forces operated
Penerbit Universitas Diponegoro.
canteen stored (CSD), Pakistan. Pacific Business Review
Hong, J. P., Kim, B. Y., & Oh, S. H. (2020). The perceived International, 11(8), 84–95. http://www.pbr.co.in/2019/2019_
experiential value and service quality of auto maintenance and month/Feb/7.pdfAdelheid Rinny MAHARSI, Rosemarie Sutjiati NJOTOPRAJITNO, Bram HADIANTO, Jessica WIRAATMAJA /
482 Journal of Asian Finance, Economics and Business Vol 8 No 4 (2021) 0475–0482
Nodira, Z., & Přemysl, P. (2017). The effects on purchase intention: Tjahjaningsih, E. T., Ningsih, D. H. U., Utomo, A. P. (2020). The
The case of fruit juice. Journal of Competitiveness, 9(3), 111–128. effect of service quality and product diversity on customer
https://doi.org/10.7441/joc.2017.03.08 loyalty: The role of customer satisfaction and word of mouth.
Octaviana, R. A., & Nugrahaningsih, H. (2018). The impact of Journal of Asian Finance, Economics, and Business, 7(12),
experiential marketing and service quality on the purchasing 481–490. https://doi.org/10.13106/jafeb.2020.vol7.no12.481
intention through customer satisfaction as the intervening Tjiptono, F., Chandra, Y., & Diana, A. (2004). Marketing scale.
variable: A case study in PT. Meratus Line Jakarta. Media Yogyakarta: Penerbit ANDI.
Manajemen Jasa, 6(2), 57–72. http://journal.uta45jakarta. Tran, V. D., & Le, N. M. T. (2020). Impact of service quality and
ac.id/index.php/MMJ/article/view/1406/973 perceived value on customer satisfaction. Journal of Asian
Olsen, S., Tudoran, A. A., Brunsø, K., & Verbeke, W. (2013). Finance, Economics, and Business, 7(9), 517–526. https://doi.
Extending the prevalent consumer loyalty modeling: The role org/10.13106/jafeb.2020.vol7.no9.517
of habit strength. European Journal of Marketing, 47(1/2),
Wang, Y., & Hazen, B. T. (2016). Consumer product knowledge and
303–323. https://doi.org/10.1108/03090561311285565
intention to purchase remanufactured products. International
Putri, A., & Astuti, S. R. (2017). The factors affecting satisfaction Journal of Production of Economics, 181(B), 460–469. https://
and its impact on the customer purchasing intention: Study doi.org/10.1016/j.ijpe.2015.08.031
in the Blends Pasta & Chocolate at branch Unika Semarang.
Widajanti, E., & Suprayitno, S. (2017). The analysis of the influence
Diponegoro Journal of Management, 6(2), 73–82. https://
of price, service quality, and satisfaction on buying intention:
ejournal3.undip.ac.id/index.php/djom/article/view/17481
The study of the customers purchasing Steak Moen Moen in
Salem, A., Ghafar, A., Ibrahim, M., Yousuf, M., & Ahmed, N. (2015). Surakarta. Eksplorasi, 29(2), 117–193. http://ejurnal.unisri.
Product perceived quality and purchase intention with consumer ac.id/index.php/Exsplorasi/article/view/1585/1392
satisfaction. Global Journal of Management and Business
Research: E-Marketing, 15(1), 21–27. https://globaljournals. Widyastuti, S., Prasetyo, H., & Gustari, I. (2017). An investigating
org/GJMBR_Volume15/3-Product-Perceived-Quality.pdf on the purchase intention: Developing dealers’ reputation
through customer trust and service quality. European Journal
Sholihin, M., & Ratmono, D. (2013). The analysis of SEM-PLS by of Social Sciences, 54(3), 316–331. http://dosen.univpancasila.
the WarpPLS 3.0. Yogyakarta: Penerbit ANDI. ac.id/dosenfile/1192211017153922778511October2018.pdf
Sugiyanto, C., Nahartyo, E., Misra, F., Bastian, I., Hartono, J., Wiyadi, W., & Ayuningtyas, N. (2019). Product aspects of
Saputro, J. A, Sholihin, M., Sivilokonom, N. I., Almahendra, R., marketing effort and purchase intention. Humanities & Social
Winardi, R. D., Rostiani, R., Warsono, S., Ciptono, W. S., & Sciences Reviews, 7(3), 541–547. https://doi.org/10.18510/hssr.
Widyaningsih, Y. A. (2018). Business research strategy. 2019.7380
Yogyakarta: Penerbit ANDI.
Wonggotwarin, T., & Kim, S. (2017). The products’ factors
Sugiyono, S. (2019). The method of quantitative and qualitative affecting purchase intention: A case study of a condominium
studies and research & development (2nd ed.). Bandung: Alfabeta. in Bangkok, Thailand. AU-GSB E-Journal, 10(1), 223–331.
Suliyanto, S. (2009). Business research methods. Yogyakarta: http://www.assumptionjournal.au.edu/index.php/AU-GSB/
Penerbit ANDI. article/view/2875You can also read