The decline of housing supply in New Zealand: Why it happened and how to reverse it - Te Waihanga Research Insights series March 2022
←
→
Page content transcription
If your browser does not render page correctly, please read the page content below
The decline of housing
supply in New Zealand: Why
it happened and how to
reverse it
Te Waihanga Research Insights series

March 2022
`

New Zealand Infrastructure
commission / Te Waihanga
Te Waihanga seeks to transform infrastructure for all New Zealanders. By doing so our goal is to
lift the economic performance of Aotearoa and improve the wellbeing of all New Zealanders.

We are an autonomous Crown entity, listed under the Crown Entities Act 2004, with an
independent board. We were established by the New Zealand Infrastructure Commission/Te
Waihanga Act 2019 on 25 September 2019.

Information on the Commission is available at www.tewaihanga.govt.nz/

How to cite this document
New Zealand Infrastructure Commission. (2022). The decline of housing supply in New Zealand:
Why it happened and how to reverse it. Wellington: New Zealand Infrastructure Commission / Te
Waihanga. Te Waihanga Research Insights series.

    Disclaimer
    This document is provided subject to Te Waihanga's Terms of Use
    (https://www.tewaihanga.govt.nz/terms-of-use/ - noting that “our websites” includes this document).
    It is recommended that you seek independent advice on any matter related to the use of this document.
    Any view, opinion, finding, conclusion or recommendation of an external party (including experts,
    researchers, parties providing feedback or surveyed respondents) are strictly those of the party
    expressing them. Their views do not necessarily reflect the views of Te Waihanga.
    Te Waihanga takes reasonable care to ensure information in the document is accurate and complete
    and that any opinions given are fair and reasonable. However, we disclaim any express or implied
    warranties in relation to such information and opinions to the maximum extent permitted by law.

Research Insights series contact

Peter Nunns
T: +64 21 535 185
E: peter.nunns@tewaihanga.govt.nz
Website: tewaihanga.govt.nz
Linkedin: tewaihanga

    Acknowledgement
    This research note was drafted by Peter Nunns and Nadine Dodge, with input from several Te Waihanga
    colleagues. We are grateful for review comments from Chris Parker (NZ Treasury), Ryan Greenaway-
    McGrevy (University of Auckland), and Shane Martin (MRCagney).

Te Waihanga Research Insights                                                                      Page: 1
`
Contents
Cut to the chase................................................................................................................................. 3
The problem is slowing supply, rather than accelerating demand ............................................... 3
We can explain the decline in housing supply ............................................................................... 3
Planning has become more complex and restrictive..................................................................... 4
Urban travel speeds dictate the pace of urban expansion ............................................................ 4
We can make different choices ..................................................................................................... 5
Introduction....................................................................................................................................... 6
We have a housing supply and affordability problem ................................................................... 6
Infrastructure and urban planning can help .................................................................................. 6
We can learn from the past ........................................................................................................... 6
Benchmarking against our past ......................................................................................................... 8
Population, incomes, house prices, and new construction ........................................................... 8
A simple housing market model .................................................................................................. 11
Prices now rise more in response to demand ............................................................................. 12
We build less than our grandparents .......................................................................................... 13
Explaining these patterns ................................................................................................................ 14
A more sophisticated housing market model ............................................................................. 14
Key factors that drive urban housing markets ............................................................................ 15
The evolution of urban planning in New Zealand ....................................................................... 16
The evolution of urban travel speeds .......................................................................................... 20
Planning policies and travel speeds explain changes in urban housing markets ........................ 22
Housing would be more affordable if we made different choices .............................................. 24
Conclusions...................................................................................................................................... 26
Write plans that allow cities to grow and change ....................................................................... 26
Restore the link between planning and infrastructure ............................................................... 27
Make different choices to lift urban accessibility ........................................................................ 27
Provide different infrastructure to serve changing cities ............................................................ 27
Appendix 1: Estimating long-run housing market models .............................................................. 29
Appendix 2: The Alonso-Muth-Mills model of urban spatial structure ........................................... 37
Appendix 3: Historical data for Auckland ........................................................................................ 42
References ....................................................................................................................................... 49
Te Waihanga Research Insights Page: 2`
Cut to the chase
Te Waihanga’s Infrastructure Strategy highlights that we cannot have economically productive
and inclusive cities without abundant and affordable housing. However, over the last 20 years,
New Zealand has experienced faster growth in real house prices than any other OECD country.
Housing has gone from being abundant and reasonably affordable to being scarce and
prohibitively expensive, especially in our fast-growing cities.
This raises two questions: Why did housing supply and affordability decline, and what can we do
to reverse this trend?
The problem is slowing supply, rather than accelerating demand
We analyse how housing prices and supply have changed between the 1930s and 2010s.
Population and incomes, which drive housing demand, grew more rapidly in the middle of the 20th
century than in recent decades. However, house prices have risen more rapidly in recent decades
and new housing construction has slowed down.
Increased housing demand now has a larger impact on prices than it did in the past (Figure 1).
Between the late 1930s and late 1970s, a 1% rise in population caused house prices to increase by
roughly 0.5%. Between the late 1970s and late 2010s, a 1% rise in population caused house prices
to increase by roughly 2.0%. Income growth also had a larger impact on prices in recent decades.
Prices now rise more rapidly because housing supply is slower to respond to demand. We
estimate that when demand for housing increases, we now build one-quarter to one-third fewer
homes than our grandparents did.
Figure 1: How much do house prices increase in response to a 1% increase in housing demand?
1% increase in incomes 1% increase in population
3%
2%
1%
0%
Mid-century Recent decades
-1%
Source: Te Waihanga analysis. Bars indicate estimated model coefficients, and black lines indicate
one standard error ranges around estimated coefficients.
We can explain the decline in housing supply
We use an urban economics model to show that changes to urban planning policies and urban
transport speeds can explain most, if not all, of the acceleration in house prices and decline in
Te Waihanga Research Insights Page: 3`
housing supply in recent decades.
When urban planning policies limit development, either ‘up’ in the centre of the city or ‘out’ at
the fringes, it leads to higher house prices and reduced supply over time. When travel speeds
change, it changes the attractiveness of different locations are desirable for housing
development, which can open up more opportunities to build. Urban planning and transport
facilitated housing prior to the 1970s, but subsequent changes have erected barriers to housing.
Planning has become more complex and restrictive
Between the 1930s and 1970s, planning rules made it easy to build new houses or apartments in
existing suburbs and to build new suburbs. In Auckland, plans provided enough capacity for
central suburbs to triple in population (Figure 2). However, planning rules became more
restrictive and more complex over time. Central Auckland’s capacity for new housing was cut in
half in the early 1970s – a change that was partially reversed in the 2016 Auckland Unitary Plan.
Legislative changes also had an impact. The Town and Country Planning Act 1977 made it easier to
appeal planning decisions and increased the role of consultation in plan-making. This led to plans
that prioritised preservation of amenity for existing residents over provision for new housing and
infrastructure. The Resource Management Act 1991 then introduced an effects-based planning
regime. Councils responded by carrying over development restrictions from existing plans and
writing more complex plans that tried to manage a wider range of effects.
Figure 2: Ratio of estimated zoning capacity to current population in central Auckland
4.0
Ratio of capacity to current population
3.0
2.0 1961 District
Scheme
2016 Auckland
Unitary Plan
1970 District 1981 District 1991 District 1999 District 2005
Scheme Scheme Plan Plan update
1.0
1950 1960 1970 1980 1990 2000 2010 2020 2030
Source: Te Waihanga analysis
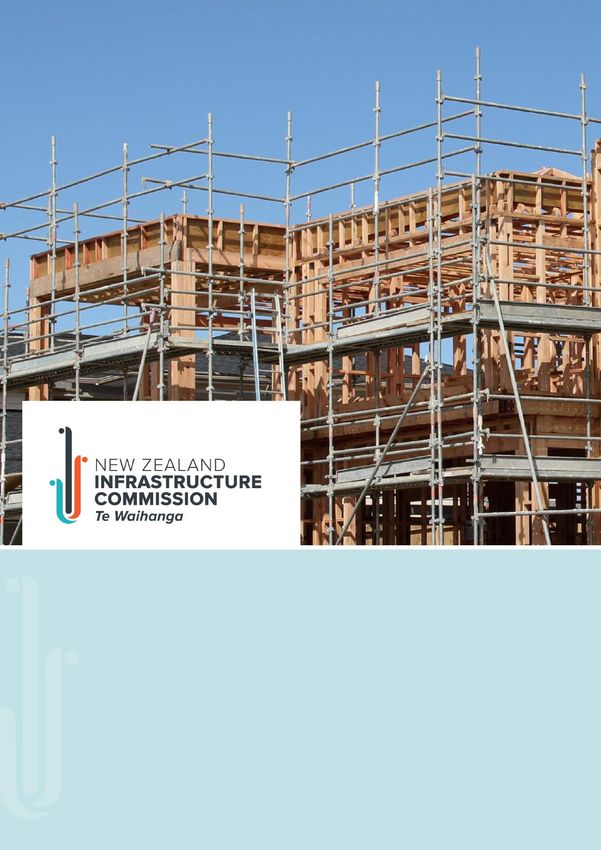
Urban travel speeds dictate the pace of urban expansion
Between the 1930s and 1970s, average urban travel speeds increased rapidly due to the adoption
of a new technology (the car) and improvements to urban roads (Figure 3). Improvements to
travel speeds slowed in the 1970s and reversed starting in the early 1990s. By the late 2010s,
increasing traffic congestion had eroded around one-third of previous gains in travel speeds
despite significant motorway expansion. Transport modelling suggests that this trend will
continue even with further increases in investment.
Rising travel speeds between the 1930s and 1970s facilitated housing supply by increasing the
Te Waihanga Research Insights Page: 4`
area where new homes could be built. Auckland’s built-up area expanded rapidly during this
period. When growth in travel speeds slowed in the 1970s and then began to reverse in the
1990s, urban expansion also slowed down as it became harder to build at the edge of the city.
It will be difficult to reverse the decline in travel speeds through investment, as new road capacity
tends to ‘induce’ additional driving, resulting in few sustained benefits for travel speed. A
potential approach would be to use a combination of congestion pricing, to mitigate severe
congestion and widespread, low-cost deployment of new transport options to lift mobility.
Figure 3: Urban travel speeds increased from the 1940s to the early 1990s and then declined
35
30
Estimated average travel speed, km/h
25
20
15
10
5
0
1920 1930 1940 1950 1960 1970 1980 1990 2000 2010
Source: Te Waihanga analysis
The negative impacts of changes to urban planning and changes to urban travel speeds
compounded each other. Ironically, councils chose to limit urban intensification at the point at
which changing transport speeds were about to make urban expansion harder.
We can make different choices
Our analysis shows that accelerating house prices were not inevitable. If we had not downzoned
central Auckland in the 1970s, or if we had chosen to adopt successful congestion-mitigation
policies, then housing would now be more abundant and house prices would be lower.
Going forward, we can boost housing supply and improve affordability by reforming our approach
to urban infrastructure and urban planning. Our analysis reinforces the value of recommendations
in Te Waihanga’s Infrastructure Strategy to write plans that allow cities to grow and change,
restore the link between planning and infrastructure, make different choices to lift urban
accessibility, and provide different infrastructure to serve changing cities.
Te Waihanga Research Insights Page: 5`
Introduction
We have a housing supply and affordability problem
Over the last 20 years, New Zealand has experienced faster growth in real house prices than any
other OECD country (OECD, 2022). In the space of a generation, housing has gone from being
abundant and reasonably affordable, to being scarce and prohibitively expensive. Home-building
has increased significantly over the last half decade, but it will take time to address a deficit of
housing that has accumulated over a long period of time.
The social and economic costs of scarce and unaffordable housing are large. All large and mid-
sized New Zealand cities have median house prices well over five times the median household
income (Urban Reform Institute and Frontier Centre. 2022). This makes it difficult for young
people and people on low incomes to seek economic opportunities in cities, leading many to seek
opportunities in Australia (Nunns, 2021). New Zealanders are spending an increasing share of
their incomes on rent and mortgage payments, limiting how much we can save for retirement or
invest in businesses (Ministry of Social Development, 2019). A lack of quality housing also means
that many people live in damp or moldy homes, experience overcrowding and have poor health
and wellbeing as a result (SNZ, 2019, 2020a).
However, unaffordable housing is not inevitable or inescapable. Homes are more abundant and
hence affordable in many other countries. Some places, like Japan, have succeeded in improving
housing affordability and increasing construction over time (Sorensen, 2005; Gleeson, 2019). And
housing used to be more affordable in New Zealand, for instance in the decades after World War
II.
Infrastructure and urban planning can help
Housing markets are shaped by infrastructure provision and urban planning policies. For instance:
• Providing transport infrastructure can open up new locations for development or make
existing areas more attractive for redevelopment (Duranton and Turner, 2012; Garcia-
López, 2012; Mohammad et al, 2013)
• Water and wastewater services are needed to enable urban housing development (Coury
et al, 2022)
• Planning policies can integrate and coordinate housing, employment, and infrastructure
development, or, conversely, constrain development in desirable areas (Cheshire, Nathan,
and Overman, 2014; de Groot et al, 2015).
Te Waihanga’s Infrastructure Strategy outlines some opportunities to improve. Reforming our
approach to urban infrastructure and urban planning could boost housing supply and improve
affordability.
We can learn from the past
The purpose of this Research Insights piece is to improve our understanding of how infrastructure
can contribute to housing supply and affordability. To do so, we analyse how housing prices and
supply have changed over the nine-decade period from the 1930s and 2010s.
First, we benchmark against our past, using long-run data series to measure how the New Zealand
housing market functioned in the middle of the 20th century relative to how it has functioned in
Te Waihanga Research Insights Page: 6` recent decades. This allows us to understand whether more rapid price increases in recent decades are due to faster growth in housing demand, or slow housing supply responses. Second, we investigate causes of changing housing supply and price dynamics. We use a standard urban economics model to identify underlying infrastructure and urban planning factors that might have caused housing supply to slow down. We measure how those factors have changed over time and use our model to show that these factors can explain observed changes in housing markets. We conclude by considering the implications of this research. Our findings provide further evidence for several recommendations in the Infrastructure Strategy. However, they also highlight how difficult it may be to restore housing affordability. Some factors that acted as tailwinds for housing supply in the middle of the 20th century have turned into headwinds. It is possible to overcome these challenges, but it will not be possible unless we change our approach to planning and infrastructure provision. Te Waihanga Research Insights Page: 7
`

Benchmarking against our past
House prices, population growth, and income growth, 1926-2018

In the long run, demand for housing is driven by fundamentals: how many people need housing,
and how much can they pay to get it? Demand for housing has risen through New Zealand’s
history, as our population grows and as incomes rise.

However, how we respond to increased housing demand has changed over time. In recent years,
large increases in house prices – indicating high demand for housing – have coincided with a
slower pace of new construction – indicating less responsive housing supply.

In this section, we assess how the New Zealand housing market has responded to increased
demand over a nine-decade period. We use data on house prices, incomes, population, and
housing stock to examine changes over the 1926 to 2018 period.1 We find that:

    •    Housing demand increased more rapidly in the decades after World War II than in recent
         decades, mainly due to faster population growth
    •    House prices have increased more rapidly in recent decades than in the middle of the
         century
    •    Faster increases in house prices appear to reflect a decline in housing supply
         responsiveness, rather than stronger demand.

Appendix 1 provides supporting information for this section.

Population, incomes, house prices, and new construction
We compile historical data on the New Zealand housing market from a range of sources, which
are described in Appendix 1.2 This data shows how demand for housing has evolved over time and
how the supply and price of housing has responded.

Population growth has slowed, while income growth has continued

Figure 4 shows population growth rates since 1930. All else equal, a larger population will demand
more housing – either more homes to accommodate more households, or larger homes to
accommodate growing households.

New Zealand’s population growth rate peaked in the 1950s and declined in subsequent decades.
Population growth rates bottomed out in the 1980s – a decade of significant economic crisis –
before increasing in the 1990s. While there is a perception that New Zealand is experiencing
unusually high rates of population growth, growth rates remain significantly below what we
experienced in the 1940s, 1950s, and 1960s.

The composition of growth has also changed. Net migrant inflows fluctuate significantly between

1
  Our analysis period ends in 2018 due to data availability. Some datasets are available up to 2018 but not
for subsequent years. In particular, our estimates of dwelling stock are based on historical Census data
Analysis stops in 2018 because historical data is only available thru this year. The 2018 Census is the last
record of number of completed dwellings as opposed to consents. There has been a significant increase in
consenting of new homes since 2018, but we do not yet know how many consents have been turned into
completed dwellings.
2
  We would particularly like to thank Andrew Coleman for compiling and sharing house price data for the
1926-1986 period. Without this data, this analysis would not have been possible.

Te Waihanga Research Insights                                                                         Page: 8
`
years but were similar as a share of population in the post-war decades as in recent decades. But
because birth rates have dropped significantly, migration now contributes a larger share of total
growth.
Figure 4: Changes in New Zealand population, 1930-2018
Population
30%
Percentage change over decade
25%
20%
15%
10%
5%
0%
1930-1940 1940-1950 1950-1960 1960-1970 1970-1980 1980-1990 1990-2000 2000-2010 2010-2018
Source: Te Waihanga analysis of data described in Table 4
Figure 5 shows growth in incomes, proxied by real (inflation-adjusted) GDP per capita, since 1930.
All else equal, a wealthier population will demand more housing – either larger homes to
accommodate increased demand for space, or higher-quality homes located in more desirable
places.
Growth in per-capita GDP has been reasonably steady throughout this period. There were periods
of faster growth in the 1930s, as New Zealand recovered from the initial shock of the Great
Depression, and in the 1960s, as the post-war baby boom began to enter the workforce.
Figure 5: Changes in real GDP per capita, 1930-2018
Real GDP per capita
40%
Percentage change over decade
35%
30%
25%
20%
15%
10%
5%
0%
1930-1940 1940-1950 1950-1960 1960-1970 1970-1980 1980-1990 1990-2000 2000-2010 2010-2018
Source: Te Waihanga analysis of data described in Table 4
Changes to mortgage interest rates are another potential driver of housing demand. When
interest rates are lower, people can afford to pay more for housing relative to their income. We
could not capture interest rates in our analysis as data is only available from 1964. This is an area
where further work would be useful.
Changes in interest rates and lending policies since the 1980s are likely to have contributed to
subsequent house price growth (Andrews et al, 2010; Eaqub and Eaqub, 2015). However, credit
conditions were also relatively liberal in the immediate post-war decades. Figure 16 in Appendix 1
Te Waihanga Research Insights Page: 9`
shows that real (inflation-adjusted) mortgage interest rates were significantly lower between
1964 and 1982 than they are today. Post-war governments also adopted various policies to
increase credit availability for homebuyers, including government guarantees for low-interest
mortgages and the option to capitalise the family benefit into a home deposit.
Housing prices have accelerated, but new construction has declined
Figure 6 shows changes in real (inflation-adjusted) house prices since 1930.3 House price growth
accelerated between the 1930s and 1960s, before slowing in the next two decades. House price
growth resumed in the 1980s. Prices grew more rapidly in the 2000s and 2010s than in any
previous decade.
The recent acceleration in house prices contrasts with slowing population growth and stable
income growth. Real house prices grew twice as rapidly in the 2000s than in the 1950s, even
though income growth was similar in both periods and population grew twice as rapidly in the
1950s.
Figure 6: Changes in real house prices, 1930-2018
Real house prices
70%
Percentage change over decade
60%
50%
40%
30%
20%
10%
0%
1930-1940 1940-1950 1950-1960 1960-1970 1970-1980 1980-1990 1990-2000 2000-2010 2010-2018
Source: Te Waihanga analysis of data described in Table 4
Figure 7 shows changes in New Zealand’s dwelling stock, in terms of number of homes and
estimated total residential floor area, since 1930. New Zealand was building at a rapid rate in the
post-war decades. The total number of homes increased by one-third in the 1950s and more than
one-quarter in the 1960s and 1970s – faster than population growth. The pace of construction has
declined since then. Over the 2010-2018 period, the number of homes increased by only 9% - less
than growth in population. However, this period does not capture further increases in dwelling
consents after 2018.
The average size of new dwellings has increased over this period. Between 1974 and 2018, the
average size of new homes increased from 109 square metres to 170 square metres (SNZ, 2020b).
Total residential floor area has continued to grow at a faster rate than total number of dwellings.
Construction of new residential floor area has not declined as rapidly as construction of new
dwellings, but it has still declined relative to the post-war decades.
3
As set out in Appendix 1, house price growth is estimated using a combination of data sources. House
price growth from 1962 to 2018 is adjusted for changes in the quality and size of houses, while house price
growth prior to 1962 is not quality-adjusted. Because housing has generally increased in size and quality
over this period, this means that we are likely to over-state price growth prior to 1962.
Te Waihanga Research Insights Page: 10`
Figure 7: Changes in dwelling stock, 1930-2018
Number of dwellings Dwelling floor area
40%
Percentage change over decade
35%
30%
25%
20%
15%
10%
5%
0%
1930-1940 1940-1950 1950-1960 1960-1970 1970-1980 1980-1990 1990-2000 2000-2010 2010-2018
Source: Te Waihanga analysis of data described in Table 4. Changes in dwelling floor area prior to
1974 are estimates rather than actual data.
A simple housing market model
Housing supply seems to have slowed down, but how much has it declined?
To answer this question, we outline a simple supply and demand model of the New Zealand
housing market and estimate this model using historical data. This is an aggregate model of the
entire New Zealand housing market, which is useful for identifying long-run changes in housing
markets but not necessarily for explaining why changes have occurred.
Figure 8 illustrates the model. At any point in time, housing prices and the total quantity of
housing available is set by the interaction of housing demand (the downward-sloping lines) and
housing supply (the upward sloping line). Housing demand rises over time due to population
growth or rising incomes. When this happens, new housing is supplied, but at an increasing cost
because the sites that are easiest to develop tend to get developed first.
Panel A shows that when housing supply is more responsive, or elastic, to price, increases in
housing demand result in more new construction and smaller price increases. Panel B shows that
when housing demand is less responsive, increases in housing demand result in less new
construction and larger price increases.
As a result, measuring how house prices respond to rising housing demand in different time
periods allows us to estimate changes to housing supply responsiveness. Appendix 1 lays out our
approach for doing so, which is based on Malpezzi and Maclennan’s (2001) analysis of long-run
changes to housing supply responsiveness in the United States and United Kingdom.
Te Waihanga Research Insights Page: 11`
Figure 8: A simple housing supply and demand model
Panel A: When housing supply is more Panel B: When housing supply is less elastic,
House price elastic, prices rise at a slower rate prices rise at a faster rate
House price
Housing
supply
Housing
supply
Housing Housing
demand demand
Quantity Quantity
Source: Te Waihanga
Prices now rise more in response to demand
We used historical income, population, and housing data to estimate a simple model of New
Zealand housing prices over multi-decade time periods. Our analysis focuses on two four-decade
periods:
• Mid-century (1937 to 1977): Model results for this period illustrate how the New Zealand
housing market functioned in the decades between the Great Depression and the 1970s
oil price shocks.
• Recent decades (1978 to 2018): Model results for this period illustrate how the New
Zealand housing market has functioned in the decades after the 1970s oil price shocks.
This includes the period of economic crisis and reform in the 1980s.
Appendix 1 describes how the model was estimated and how these time periods were chosen and
provides full results from model estimation, including results for the full 1926-2018 period. Figure
9 presents our key results. It shows how much house prices increased in response to a 1%
increase in either population or incomes in each period. Point estimates imply that:4
• Between 1938 and 1977, a 1% rise in incomes led to a roughly 0.9% increase in house
prices, while a 1% rise in population lifted prices by roughly 0.5%.
• Between 1979 and 2018, a 1% rise in incomes led to a roughly 1.2% increase in house
prices, while a 1% rise in population lifted prices by roughly 2.0%.
4
These coefficients are not estimated very precisely, as shown by the standard error bars on the chart.
Te Waihanga Research Insights Page: 12`
Figure 9: How much do house prices increase in response to a 1% increase in housing demand?
1% increase in incomes 1% increase in population
3%
2%
1%
0%
Mid-century Recent decades
-1%
Source: Te Waihanga analysis. Bars indicate estimated model coefficients, and black lines indicate
one standard error ranges around estimated coefficients.
We build less than our grandparents
This analysis shows that house prices have grown more rapidly in recent decades not because
demand for housing is growing faster, but because housing supply is now less responsive to
demand. This causes prices to rise faster in response to a similarly sized increase in demand.
In Appendix 1 (Table 7), we use these results, plus some supplementary assumptions, to estimate
housing supply elasticities for each period. Our results suggest that the New Zealand-wide
housing supply elasticity has declined by one-quarter to one-third between the mid-century
period and recent decades. In other words, when demand for housing increases, we build one-
quarter to one-third fewer new homes than our grandparents did. However, the homes we build
tend to be larger.
Te Waihanga Research Insights Page: 13` Explaining these patterns The role of urban planning and the role of urban travel speeds The previous section shows that house prices now increase more in response to population and income growth than they did during the middle of the 20th century. This suggests that housing supply responsiveness has declined over time. This section analyses the causes of this decline. A large body of research looks at why housing supply is more responsive in some places and less in others. Lower housing supply has been linked to physical geography that limits development, like hills and harbours, and urban planning systems that make it more difficult to build new housing (Saiz, 2010; Gyourko and Molloy, 2015; Mayo and Sheppard, 1996). While we have a good understanding of why housing supply differs between locations, there is less evidence on what might cause it to change over time. There is evidence that housing supply responsiveness has changed over time in some places. Some of these changes have been linked to new planning legislation (Malpezzi and Maclennan, 2001), changes to local land use regulation (Ganong and Shoag, 2017; Fischel, 2015), or even changes to transport technology (Knoll, Schularick and Steger, 2017; Brinkman and Lin, 2019). In this section, we analyse the impact of past changes to urban planning and urban infrastructure performance on New Zealand’s urban housing market. To do so, we develop a more sophisticated housing market model, use it to identify factors that are likely to affect how urban housing markets respond to growing demand, and then measure how those things have changed over time. To conclude, we use this model to show that observed changes in urban planning policies and urban travel speeds explain why housing prices have accelerated in recent decades. Appendices 1 and 2 provide supporting material for this section. A more sophisticated housing market model Our analysis in previous section is based on a simple housing market model that treats the entire New Zealand housing market as a single, homogenous entity. To analyse why market dynamics might have changed over time, we need to develop a more sophisticated model that captures the spatial structure of urban housing markets. We use the Alonso-Muth-Mills (AMM) model to analyse what will happen when cities grow under different conditions. This is a widely used urban economics model that has previously been used for policy analysis in New Zealand and Australia (Kulish, Richards, and Gillitzer, 2012; Lees, 2014, 2015; Parker, 2021). Glaeser (2008) provides a full exploration of this model, including a range of model variants. Our analysis is based on Bertaud and Brueckner’s (2005) version of the model. In the model, people choose where in the city to live to minimise their combined housing and transport costs. In equilibrium, nobody stands to gain from moving to a different location. This means that differences in house prices between locations are proportional to differences in the cost, in time and money, to commute from those locations. Places that are further away from the city centre have higher transport costs and hence lower house prices, lower population density, and lower land prices.5 Appendix 2 describes this model and its underlying assumptions. 5 Our version of the model does not account for employment decentralisation or other ‘attractors’ for housing development, like access to beaches and other natural amenities, that may be dispersed throughout the city. The basic AMM model can be extended to capture these features, but this would require additional work to gather sufficient historical data to allow us to measure their impact over time. Te Waihanga Research Insights Page: 14
`

The AMM model does a reasonably good job at explaining urban spatial structure and how cities
evolve over time (Glaeser, 2008). It can be used to analyse how different factors, including
population and income growth and changes to urban planning and infrastructure, will affect
urban house prices and the shape of cities (Brueckner, 2000).

Key factors that drive urban housing markets
We use the AMM model to identify three underlying factors that might cause urban housing
markets to be more or less responsive to increased demand.6 The first factor is physical
geography: cities with less land available for housing development, for instance due to hilly
terrain, will find it harder to accommodate growth. However, as physical geography does not
change over time, it cannot explain why housing supply responsiveness has declined.7

The second factor is changes to urban planning policies that limit development either ‘up’ in the
centre of the city or ‘out’ at the fringes. The third factor is changes to urban travel speeds that
change the number of locations that are available for housing development. These factors can
change over time, and as a result may explain why housing supply has changed over time.

Figure 10 uses the AMM model to illustrate how urban planning policies and travel speeds affect
urban housing markets. Blue lines indicate outcomes under a baseline model without a floor area
ratio (FAR) limit that caps the maximum size and height of buildings, orange lines indicate
outcomes with a FAR limit, and grey lines indicate outcomes with lower transport costs.8

Imposing a FAR limit and lowering transport costs both result in a more dispersed and lower-
density city than the baseline scenario. However, they have opposite impacts on house prices.
FAR limits raise house prices throughout the city because they reduce the availability of housing in
relatively accessible locations. Lower transport costs make more locations accessible for
development, which reduces overall house prices but results in higher prices in outlying areas.

6
  As in the model outlined in the previous section, increased population or increased incomes lead to
increased demand for housing within the AMM model.
7
  While the quantity of developable land is fixed, infrastructure can make more of this land available for
development by bridging barriers like harbours and hills.
8
  This figure presents the impact of a FAR limit, but other types of housing supply restrictions can also be
captured in the AMM model. For instance, Lees (2014) models the impact of an urban growth boundary,
while Kulish, Richards and Gillitzer (2012) consider the impact of regulations that raise the cost of
development without prohibiting it.

Te Waihanga Research Insights                                                                         Page: 15
`

Figure 10: Impact of urban planning restrictions and travel speeds on urban spatial structure

                                             Cumulative population                                                                                                                                    Housing prices
                            Baseline model              FAR limit                  Lower transport costs                                                                         Baseline model              FAR limit           Lower transport costs

                  250                                                                                                                                              9
                  200
    1000 people

                                                                                                                                         $/m2/year
                                                                                                                                                                   6
                  150
                  100
                                                                                                                                                                   3
                   50
                    0                                                                                                                                              0
                        0        2       4        6        8        10        12         14        16        18           20                                             0        2       4       6          8       10    12        14    16     18     20
                                                      Distance to centre (km)                                                                                                                             Distance to centre (km)

                                                 Population density                                                                                                                                   Floor area ratio
                            Baseline model              FAR limit                  Lower transport costs                                                                         Baseline model              FAR limit           Lower transport costs

                                                                                                              200                                                  10.0

                                                                                                                    People per hectare

                                                                                                                                         Building area/land area
                                                                                                              160                                                      8.0
                                                                                                              120                                                      6.0
                                                                                                              80                                                       4.0
                                                                                                              40                                                       2.0
                                                                                                              0                                                        0.0
    0               2        4       6       8        10       12        14         16        18        20                                                                   0        2       4       6          8    10    12       14     16     18    20
                                         Distance to centre (km)                                                                                                                                           Distance to centre (km)

Source: Te Waihanga analysis

The evolution of urban planning in New Zealand
In this section, we briefly review the historical evolution of the legislative framework for planning
in New Zealand. We then examine how the legislative framework has been translated into
planning rules in cities, using Auckland as a case study. Appendix 3 contains further information
on this analysis.

Planning legislation has evolved over the last century

The evolution of urban planning in New Zealand can be broadly grouped into four stages: growth
without planning (pre-1926), unsuccessful centrally coordinated planning (1926-1953), local
government led planning (1953-1977), and consultation-based planning (1977-today).9

During the growth without planning stage (pre-1926), growth occurred with little government
control on the spatial form and density of housing, or the separation of residential from other
land uses. The unsuccessful centrally coordinated planning stage (1926-1953) attempted to
introduce a system where local planning was centrally coordinated, but this system was almost
completely unsuccessful. During the local government led planning period (1953-1977), planning
was led by local governments under a system with limited consultation and appeal rights.

The consultation-based planning period (1977-today) is characterised by locally led planning
processes that are developed in consultation with the community and allow flexibility through
discretionary ordinances. The Town and Country Planning Act 1977 introduced a system with
more flexibility through discretionary ordinances, greater public participation, and expanded
opportunities for appeals.

The Resource Management Act of 1991 (RMA) introduced an effects-based planning regime,
where new development must avoid, remedy, or mitigate negative effects. The RMA also
mandates extensive public participation and consultation throughout the planning process. This
includes a requirement for councils to consult with specific people and groups, the ability of

9
  This typology is based on Productivity Commission (2015a) and Schrader (2016), as well as a review of key
features of legislation from 1953 onwards.

Te Waihanga Research Insights                                                                                                                                                                                                                    Page: 16
`
people and groups to make submissions on plans and proposed plan changes, be heard at Council
meetings, and to appeal planning decisions to the Environment Court (Productivity Commission,
2015b).
Urban planning stopped integrating infrastructure
Table 1 shows how different planning legislation addressed infrastructure planning to support
urban development. The Town and Country Planning Act 1953 required local governments to
jointly prepare regional plans for coordinating infrastructure improvements and write district
schemes that outlined how infrastructure would be upgraded over time. The Town and Country
Planning Act 1977 changed the wording a bit but retained the substantive requirements.
The Resource Management Act 1991, by contrast, removed specific requirements for
infrastructure planning. Infrastructure was now seen as one of many effects to manage, rather
than a foundation for urban development and community wellbeing that must be planned and
coordinated in advance.
Table 1: How planning legislation addressed infrastructure planning
Town and Country Planning Act 1953
Regional plans: “co-ordination of all such public improvements, utilities, services, and amenities
as are not limited by the boundaries of the district”.
District schemes: transport networks, sewerage, drainage, and sewage and rubbish disposal,
lighting, water
Town and Country Planning Act 1977
Regional plans to outline “regional needs for the provision and protection of” three waters
infrastructure, production and distribution of power and fuel, health and educational facilities,
transport facilities, and recreational facilities.
District schemes: “Provision for the safe, economic, and convenient movement of people and
goods”
Resource Management Act 1991
No specific requirements
Plans have become more complex over time
We measure the changing complexity of council plans over time based on the length of plans and
the number of zones included in the plan.
Length of plan provides an indication of the number of things that are being regulated and the
detail in which they are being regulated. Figure 11 shows the length of plans in Auckland,
Wellington, and Christchurch between 1960 and 2000. In all three councils, plan length was
gradually increasing prior to the introduction of the RMA, followed by a rapid increase in plan
length after the RMA. A review of the topics addressed by plans suggests that this is because the
RMA enabled councils to regulate for a wider range of outcomes than in the past.10
10
Other policy changes may also have affected plan complexity, such as local government amalgamation in
1989. If new councils chose to carry across predecessor councils’ zoning schemes instead of standardising
them, this would have increased plan length.
Te Waihanga Research Insights Page: 17`
Figure 11: Length of district schemes/plans over time
1600
1400
TCPA77 RMA91
1200
Number of pages
1000
800
600
400
200
0
1955 1960 1965 1970 1975 1980 1985 1990 1995 2000 2005
Christchurch City Wellington City Auckland City
Source: Te Waihanga analysis of sources described in Appendix 3. Plan length includes annexes but
excludes planning maps.
The total number of zones in the plans provides further evidence of increasing plan complexity.
While more zones do not necessarily increase the stringency of regulations, it makes plans harder
to understand and makes it more difficult for homebuilders to build similar homes in different
places. Figure 12 shows the number of zones in four District Schemes in Auckland from 1961 to
1991. The number of zones increased sharply in 1970, with gradual increases in subsequent plans.
Figure 12: Changing complexity of Auckland City Council’s zoning schemes over time
Residential zones Commercial zones Industrial zones Other zones Recreation zones
60
50
Number of zones
40
30
20
10
0
1961 1970 1981 1991
Source: Te Waihanga analysis of sources described in Appendix
Plans have become more restrictive over time
Auckland City Council’s first District Scheme was operative in 1961. Its stated purpose was “to
provide for the future development of the City of Auckland” (Auckland Council, 2018). The 1961
scheme provided capacity for up to 475,000 people, relative to a 1961 population of 141,900.
Te Waihanga Research Insights Page: 18` By 1970, the stated goal of the scheme had shifted to “guiding the efficient, economic and harmonious development” of the city. While accommodating population growth still a goal, this was balanced against preservation of areas at “existing intensity of use because of their pleasant spaciousness, high standard of development, extensive and mature planting, and generally established reputation.” The 1970 scheme halved the plan capacity to a maximum population of around 250,000, relative to a 1970 population of 152,200. Subsequent schemes continued to prioritise preserving existing natural and built environments rather than accommodating growth. The 1981 scheme did not identify accommodation of population growth as a main purpose, and instead identified goals related to “the protection and improvement of the environment”, “conservation of features which make a beneficial contribution”, and to “maintain the existing housing stock as a resource of considerable value” (Auckland Council, 2018). It stated an intention to provide capacity for 25,000 additional people over the next twenty years, and increased housing capacity by a small amount by increasing opportunities for cross-lease subdivision. Auckland City Council was amalgamated with eight neighbouring councils in 1989, doubling its total land area.11 During the 1990s, Auckland changed its district plan to allow apartment development in the city centre and other commercial zones, but did not significantly change capacity in residential zones. In 2010, Auckland City Council was amalgamated with other councils to create a region-wide Auckland Council. Following recommendations from an independent hearing panel, the 2016 Auckland Unitary Plan significantly increased zoning capacity throughout the city, including in residential zones. Planning capacity assessments undertaken between 2006 and 2021 provide data on the additional number of dwellings that can be built in residential and business zones (Auckland Regional Council, 2010; Auckland Council, 2013; Fernandez et al, 2021). We have summarised this data, converted dwelling capacity to population capacity, and compared capacity against current population. Figure 13 shows the ratio of estimated zoning capacity to current population in the pre-1989 Auckland City Council and its closest successor entities. In 1961, Auckland City had capacity to grow to more than three times its current population.12 After downzonings in the 1970s and 1980s, it only had capacity to increase its population by 70%.13 Post-RMA plans increased capacity by permitting apartment development in the city centre but did not reverse downzonings in residential zones. The 2016 Auckland Unitary Plan restored significant housing capacity in residential zones, which would allow central Auckland to grow to up to 2.5 times its current population. 11 Data from the NZ Official Yearbook suggests that Auckland City Council’s pre-amalgamation area was 7472 hectares, while its post-amalgamation area increased to around 14,700 hectares (SNZ, 2021). For a map of pre-1989 councils see McClure (2016). 12 These calculations of maximum zoning capacity assume that all sites are redeveloped to their full potential. In many cases, density-maximising redevelopment will not be financially viable for developers or desirable for landowners, meaning that the realisable zoning capacity offered by these plans is lower. 13 Some multi-story apartment buildings were built in suburban areas in the 1960s, 70s, and 80s. The 1970 and 1981 District Schemes set aside a small amount of residential land, mostly along arterial roads, for targeted intensification. We spot-checked several examples, such as the apartment blocks in St Mary’s Bay, finding that they were often, but not always, built in these zones. Te Waihanga Research Insights Page: 19
`

Figure 13: Room for growth: Ratio of zoning capacity to current population in central Auckland

                                              4.0
    Ratio of capacity to current population

                                              3.0

                                              2.0       1961 District
                                                          Scheme
                                                                                                                                       2016 Auckland
                                                                                                                                        Unitary Plan
                                                         1970 District   1981 District      1991 District   1999 District     2005
                                                           Scheme          Scheme              Plan            Plan          update
                                              1.0
                                                 1950          1960      1970        1980          1990       2000          2010      2020      2030

Source: Te Waihanga analysis of sources described in Appendix. Data for 1961-1981 refers to pre-
1989 Auckland City Council (covering roughly half of the Auckland isthmus), data for 1996-2006
refers to the expanded post-1989 council (covering the Auckland isthmus), and data for 2012 and
2021 refers to the Auckland Council local boards most closely corresponding to the pre-2010
Auckland City area. Capacity of pre-1989 plans was estimated based on data in district schemes,
while capacity of post-1989 plans was estimated based on data from Auckland Council’s 2006 and
2012 Capacity for Growth Studies and its 2021 Housing Assessment.

Tighter limits on housing supply pre-date the RMA

This data shows that council planning practices were largely carried over from pre-RMA plans to
post-RMA plans. Starting in the 1970s, council plans were developed locally in consultation with
the community. These plans reduced residential development capacity by downzoning residential
areas. The ‘great downzoning’ of the 1970s and 80s was not reversed after the RMA (Hook, 1994).
Instead, councils responded to the RMA by writing longer, more complex plans that regulate a
wider range of issues while retaining previous restrictions on housing development.

In other countries like the United States and United Kingdom, planning restrictions were
becoming more restrictive at around the same time. In the US, land use regulations started to
become more restrictive in the 1960s and 1970s, especially in coastal states (Ganong and Shoag,
2017; Hsieh and Moretti, 2019). For instance, New York City reduced its zoning capacity by 79% in
1961 and Los Angeles reduced its capacity by 60% between 1960 and 1980 (Phillips, 2022). Fischel
(2015) links increasing restrictions on housing development to legislative changes that made it
easier for more parties to object to development. In the UK, strict green belt policies enacted in
the 1950s significantly reduced housing supply responsiveness (Malpezzi and Maclennan, 2001;
Cheshire and Sheppard, 2002; Barker, 2008). Increasing sensitivity to environmental amenities
and rising community opposition to housing development (‘NIMBYism’) is a common factor
behind these changes.

The evolution of urban travel speeds
Urban travel speeds have increased significantly over the last two centuries due to technological
changes and infrastructure improvements (Litman, 2022). In 1800, people might travel at a speed
of around 5km/h (if walking) or up to 8km/h (if using a horse and carriage). In 1900, they might
travel at a speed of around 20km/h (on an electric tram or bicycle) or better than 50km/h (over

Te Waihanga Research Insights                                                                                                                 Page: 20
`
longer distances by train). By 1950, people could travel at speeds of up to 100km/h (by car).
Average urban travel speeds have increased as people adopt new transport technologies.
Infrastructure improvements have also bolstered these trends. This has significantly expanded
opportunities for housing development (Baum-Snow, 2007; Duranton and Turner, 2012; Garcia-
López, 2012; Newman, Kosonen, and Kenworthy, 2016; Gonzalez-Navarro and Turner, 2018).
However, in recent decades, rising congestion on urban roads has eroded gains in travel speed,
and faster or higher-capacity alternatives have not been delivered.
Figure 14 shows how average travel speeds have changed in Auckland since 1920. The Appendix
explains how we compiled these estimates from various historical sources.14 We find that:
• Average travel speeds increased significantly between 1950 and 1970 as cars became
widespread and as roads were improved. The share of urban roads that were sealed,
rather than metalled, rose from 20% in 1930 to almost 90% in 1970.
• Improvements in average travel speeds slowed, but did not stop, between 1970 and
1990. This reflects car use reaching saturation levels and more limited opportunities to
make fundamental improvements to urban roads.
• Since the early 1990s, average travel speeds have declined due to rising traffic congestion
and the lack of high-quality alternatives. Vallyon (2013) finds that travel speeds on nine
arterial roads and motorways declined by an average of around 30% between 1986 and
2012 despite significant road widening.
We estimate that rising traffic congestion has eroded around one-third of the gains in average
travel speeds experienced since 1950. Current transport modelling suggests that this trend will
continue, even with significant investment in transport infrastructure (Minister of Transport,
2021).
Figure 14: Urban travel speeds increased from the 1940s to the early 1990s and then declined
35
Estimated average travel speed, km/h
30
25
20
15
10
5
0
1920 1930 1940 1950 1960 1970 1980 1990 2000 2010
Source: Te Waihanga analysis of sources described in Appendix 3
14
There is likely to be some error in the estimated level of average speed and short-term fluctuations in
speeds, but this analysis captures the timing and direction of key changes. A similar pattern is seen in UK
data for the 1970-period (Thunder Said Energy, 2020).
Te Waihanga Research Insights Page: 21` Planning policies and travel speeds explain changes in urban housing markets We now use the AMM model to analyse how Auckland’s urban housing market accommodated growth in different periods. We calibrate the model to Auckland conditions, input observed or estimated changes in city population, incomes, agricultural land prices, planning policies, and travel speeds between the 1930s and 2010s, and simulate impacts on housing prices and urban form.15 Appendix 2 provides further detail on our modelling assumptions, and also presents charts showing urban spatial structure (Figure 20). The first column in Table 2 shows model predictions for the 1937-1977 period. During this time, New Zealand’s population doubled and Auckland’s population more than tripled. Household incomes also increased significantly. Average urban travel speeds rose by 50%, meaning that the cost of commuting fell by roughly one-third.16 District schemes were comparatively permissive during this period, although they did set limits on housing density and building height. Data from the 1961 District Scheme suggests an average floor area ratio limits of 1.28 in residential zones. On average across all zones, it was possible to build almost 1.3 square metres of floor space per square metre of land. The AMM model predicts that this will result in house price growth of 96% and an 189% increase in built-up area. This closely replicates the observed (national) house price increase of 113% and observed 230% increase in Auckland’s built-up area. The second column in Table 2 shows model predictions for the 1978-2018 period. During this time, New Zealand’s population increased by more than 50% and Auckland’s grew by almost 80%. Household incomes continued to increase. Average urban travel speeds declined by 11%, meaning that the cost of commuting rose by around 7%. Downzonings in the early 1970s increased restrictions on housing development. The 1970 District Scheme set an average FAR limit of around 0.8, while the 1981 District Scheme raised the FAR limit to around 0.96 but increased the amount of land required per dwelling. We use an average FAR limit of 0.88 as an estimate of restrictions on development throughout the period. On average across all zones, it was now possible to build only 0.9 square metres of floor space per square metre of land. The AMM model predicts that this will result in house price growth of 262% and a 22% increase in built-up area. This closely replicates the observed (national) house price increase of 251% and observed 42% increase in Auckland’s built-up area. 15 City population and income levels are treated as fixed, exogenous inputs to the model, and we solve for the housing prices and urban form that this would generate in each period. 16 This assumes that changes in the overall cost of commuting are (inversely) proportional to changes in travel speeds. Ideally, we would also have accounted for changing financial costs, such as costs of public transport fares, vehicle ownership, and fuel. To a degree, these costs will be proportional to travel speeds – for instance, higher travel speeds mean that the fixed costs of owning a car can be spread over more annual vehicle kilometres. We chose not to adjust financial cost components of travel costs using price index data because price indices adjust for changing quality of transport goods and services over time, and thus may provide a misleading indication of how actual financial costs changed over time (Gordon, 2016). Te Waihanga Research Insights Page: 22
You can also read