The City of Largo 2019 Inventory of Government Operations Greenhouse Gas Emissions
←
→
Page content transcription
If your browser does not render page correctly, please read the page content below

The City of
Largo
2019 Inventory
of Government
Operations
Greenhouse
Gas Emissions
COMPLETED APRIL 2022

Produced by the City of Largo
with Assistance from ICLEI –
Local Governments for
Sustainability USA and the Patel
College of Global Sustainability at
the University of Southern
Florida

ICLEI-Local Governments for
Sustainability USA
This template was updated by ICLEI in 2022

Created by Julia Barnitz

Table of Contents
ICLEI-Local Governments for Sustainability USA ............................................................................... 1
Credits and Acknowledgements ................................................................................................ 3
Tables and Figures .................................................................................................................... 4
   List of Tables ................................................................................................................................................. 4
   List of Figures ................................................................................................................................................ 4
Executive Summary ...................................................................................................................5
Key Findings .............................................................................................................................. 7
Introduction to Climate Change ............................................................................................... 8
   Greenhouse Gas Inventory as a Step Toward Carbon Neutrality ..............................................10
   ICLEI Climate Mitigation Milestones ...............................................................................................11
Inventory Methodology ........................................................................................................... 12
   Understanding a Greenhouse Gas Emissions Inventory ..............................................................12
   Local Government Operations (LGO) Protocol ..............................................................................13
   Quantifying Greenhouse Gas Emissions ..........................................................................................13
       Sources and Activities .........................................................................................................................13
       Base Year ................................................................................................................................................14
       Quantification Methods .....................................................................................................................14
Government Operations Emissions Inventory Results .......................................................... 15
   Next Steps: .................................................................................................................................................18
Conclusion ............................................................................................................................... 19
Appendix: Methodology Details ............................................................................................. 20
   Energy ..........................................................................................................................................................20
   Transportation ...........................................................................................................................................20
   Wastewater .................................................................................................................................................22
   Potable Water.............................................................................................................................................22
   Solid Waste .................................................................................................................................................22
   Inventory Calculations ............................................................................................................................23

                City of Largo 2022 Inventory of Government Operations GHG Emissions                                                               2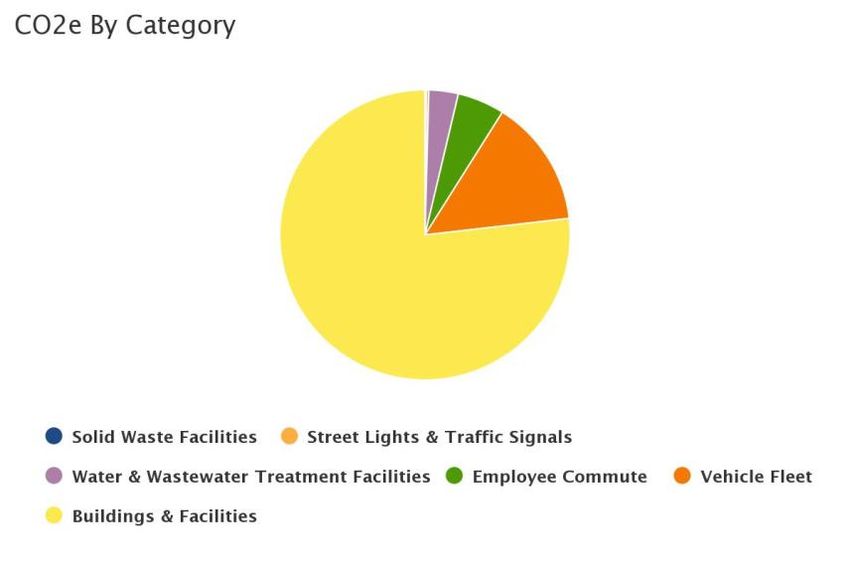
Credits and
Acknowledgements
Julia Barnitz, Climate Fellow Intern, University of South Florida

Laura Thomas, Sustainability Program Administrator, City of Largo, FL

Mathew Katz, Program Host, ICLEI – Local Governments for Sustainability

Halle Goldstein, Program Host, Audubon Florida

          City of Largo 2022 Inventory of Government Operations GHG Emissions   3
Tables and Figures
List of Tables
Table 1: Global Warming Potential Values (IPCC, 2014) ............................................................................. 12
Table 2: Local Government Operations Inventory...................................................................................... 16
Table 3: Energy Data Sources...................................................................................................................... 20
Table 4: Emissions Factors for Electricity Consumption ............................................................................. 20
Table 5: Transportation Data Sources......................................................................................................... 20
Table 6: MPG and Emissions Factors by Vehicle Type ................................................................................ 21
Table 7: Wastewater Data Sources ............................................................................................................. 22
Table 8: Potable Water Data Sources ......................................................................................................... 22
Table 9: Solid Waste Data Sources.............................................................................................................. 22
Table 10: Fugitive Emissions Data Sources .................................................... Error! Bookmark not defined.
List of Figures
Figure 1: Government Operations Emissions by Sector ............................................................................... 7
Figure 2: ICLEI Climate Mitigation Milestones ............................................................................................ 11
Figure 3: Relationship of Community and Government Operations Inventories ....................................... 12
Figure 4: Local Government Operations Emissions by Sector .................................................................... 17
This work is licensed under a Creative Commons Attribution-NonCommercial-NoDerivatives 4.0 International License. It may
not be used for any commercial purpose. Any non-commercial use of this material must provide attribution to ICLEI Local
Governments for Sustainability USA.
City of Largo 2022 Inventory of Government Operations GHG Emissions 4Executive Summary
The City of Largo recognizes that greenhouse gas (GHG) emissions from human activity are catalyzing
profound climate change, the consequences of which pose substantial risks to the future health,
wellbeing, and prosperity of our community.
As such, the City of Largo continues to make significant progress to reduce emissions within the
organization and the community. This includes the following goals and programs:
1. Ready for 100: The City of Largo became the 75th City in the nation, and 4th in Florida, to
commit to transition to 100 percent renewable energy, both for the organization and the
community, by 2035 and 2050 respectively
2. Building Energy Usage: The City of Largo has a goal to reduce building energy use by 20% by
2030 and is in the process of developing a city-wide internal facility Energy and Solar
Analysis; The City continues to explore ways to expand its energy tracking process and
address metering flaws and opportunities moving forward
3. Alternative-Fuel Fleet: The City has begun to transition to a 100% alternative-fuel, light duty
fleet by 2030. This includes expanding its charging station infrastructure and purchasing new
vehicles, such as the first all-electric Police Motorcycle to be revealed this Spring
4. Electric Vehicle Charging Stations: The City has committed to provide the community with
10 EVSE by 2025. Currently there is one Level 3 and six Level 2 charging stations that are
available free of charge
5. City Facilities: The City has made a strategic decision to maximize renewable energy
generation on all new City-owned facilities to the greatest extent possible as well as ensure
buildings are extremely energy efficient
6. Duke Clean Energy Connection Program: The City of Largo is excited to partner with Duke
Energy for the new program focused on dramatically expanding the City’s current use of
renewable energy. Once fully established, the City of Largo will source approximately 40% of
its total energy from renewable energy through this program
7. WWTF Operations Building- The newest City of Largo facility that is slated to open in June of
2021 is the 13,187 square foot wastewater treatment operations building with a
construction cost of $8,022,671. It will be the City's first category-five hurricane rated
building to and is elevated 23.5-feet above sea level to protect from storm surge
City of Largo 2022 Inventory of Government Operations GHG Emissions 5ii. External Programs-
1. EV and EVSE Resource Hub: A centralized resource to residents, workers, business owners,
and developers to learn more about EVs and EVSEs.
2. City EVSE Ordinance: The City has adopted minimum requirements to install EVSEs for new
developments within several of the City’s activity centers.
3. Housing Rehabilitation Program: The City of Largo supports energy efficiency for
homeowners through the Housing Rehabilitation Program, which offers income-eligible
homeowners with home repair financing and energy efficiency improvements.
4. Solar Co-ops: When possible, the City of Largo promotes solar cooperative groups to Largo
residents, to encourage the adoption of renewable energy within the community
5. Community Engagement: The City actively shares information with residents, workers, and
businesses via a number of channels (Social media, news articles, in-person events, etc) in
order to promote the adoption of renewable energy within the community. The City also
provides resources for local businesses to be more sustainable and resilient, such as the
Largo Sustainable Business Guide
This report provides estimates of greenhouse gas emissions resulting from activities within the City’s
government operations in order to assist with emission reduction planning that aligns with these goals
and programs.
City of Largo 2022 Inventory of Government Operations GHG Emissions 6Key Findings
Figure 1 shows local government operations emissions. The Buildings and Facilities sector accounts for a
vast majority (77%) of these emissions. It is important to note that this does include electricity
consumption related to the operations of the Waste Water Treatment Facility. The next largest
contributor is vehicle fleet (14%), followed by employee commute (5%). Actions to reduce emissions
from these sectors will be a key part of any future climate action plan developed by the City of Largo.
Water and Wastewater Facilities, Solid Waste Facilities, and Street Lights/Traffic Signals were
responsible for the remainder (less than 7%) of local government operations emissions.
The Inventory Results section of this report provides a detailed profile of emissions sources within the
City of Largo; information that is key to guiding local reduction efforts. These data will also provide a
baseline against which the city will be able to compare future performance and demonstrate progress in
reducing emissions.
Figure 1: Government Operations Emissions by Sector
City of Largo 2022 Inventory of Government Operations GHG Emissions 7Introduction to Climate
Change
Naturally occurring gases dispersed in the atmosphere determine the Earth’s climate by trapping solar
radiation. This phenomenon is known as the greenhouse effect. Overwhelming evidence shows that
human activities are increasing the concentration of greenhouse gases and changing the global climate.
The most significant contributor is the burning of fossil fuels for transportation, electricity generation and
other purposes, which introduces large amounts of carbon dioxide and other greenhouse gases into the
atmosphere. Collectively, these gases intensify the natural greenhouse effect, causing global average
surface and lower atmospheric temperatures to rise, threatening the safety, quality of life, and economic
prosperity of global communities. Although the natural greenhouse effect is needed to keep the earth
warm, a human enhanced greenhouse effect with the rapid accumulation of GHG in the atmosphere leads
to too much heat and radiation being trapped. The Intergovernmental Panel on Climate Change (IPCC)
Sixth Assessment Report confirms that human activities have unequivocally caused an increase in carbon
emissions1. Many regions are already experiencing the consequences of global climate change, and the
City of Largo is no exception.
Human activities are estimated to have caused approximately 1.0°C of global warming above pre-
industrial levels, with a likely range of 0.8°C to 1.2°C. Global warming is likely to reach 1.5°C between 2030
and 2052 if it continues to increase at the current rate. (high confidence) Warming from anthropogenic
emissions from the pre-industrial period to the present will persist for centuries to millennia and will
continue to cause further long-term changes in the climate system, such as sea level rise, with associated
impacts (high confidence), but these emissions alone are unlikely to cause global warming of 1.5°C
(medium confidence). Climate-related risks for natural and human systems are higher for global warming
of 1.5°C than at present, but lower than at 2°C (high confidence). These risks depend on the magnitude
and rate of warming, geographic location, levels of development and vulnerability, and on the choices and
implementation of adaptation and mitigation options (high confidence)2.
1
IPCC, 2021: Summary for Policymakers. In: Climate Change 2021: The Physical Science Basis. Contribution of
Working Group I to the Sixth Assessment Report of the Intergovernmental Panel on Climate Change
[MassonDelmotte, V., P. Zhai, A. Pirani, S. L. Connors, C. Péan, S. Berger, N. Caud, Y. Chen, L. Goldfarb, M. I. Gomis,
M. Huang, K. Leitzell, E. Lonnoy, J. B. R. Matthews, T. K. Maycock, T. Waterfield, O. Yelekçi, R. Yu and B. Zhou
(eds.)]. Cambridge University Press. In Press.
2
IPCC, 2018: Summary for Policymakers. In: Global Warming of 1.5°C. An IPCC Special Report on the impacts of
global warming of 1.5°C above pre-industrial levels and related global greenhouse gas emission pathways, in the
context of strengthening the global response to the threat of climate change, sustainable development, and efforts
to eradicate poverty [Masson-Delmotte, V., P. Zhai, H.-O. Pörtner, D. Roberts, J. Skea, P.R. Shukla, A. Pirani, W.
Moufouma-Okia, C. Péan, R. Pidcock, S. Connors, J.B.R. Matthews, Y. Chen, X. Zhou, M.I. Gomis, E. Lonnoy, T.
Maycock, M. Tignor, and T. Waterfield (eds.)]. World Meteorological Organization, Geneva, Switzerland, 32 pp.
City of Largo 2022 Inventory of Government Operations GHG Emissions 8According to the 2018 National Climate Assessment, the
southeast U.S. will experience potentially devastating
impacts from seasonal changes and hazards occurring
at unprecedented magnitudes. Southeast Florida,
including the City of Largo, is at particular risk for coastal
hazards, such as flooding, erosion, and hurricanes that
will continue to intensify with sea-level rise. So many
people visit and move to this region to enjoy the
beautiful coast, but its seaside location also puts it at
extreme risk. In addition, climate change will continue
to produce warmer seasons and extreme temperatures
that threaten many sectors within the City of Largo and
the greater region, most notably tourism, public health,
and agriculture3.
Many communities in the United States have started to
take responsibility for addressing climate change at the
local level. Reducing fossil fuel use in the community
can have many benefits in addition to reducing
greenhouse gas emissions. More efficient use of energy
decreases utility and transportation costs for residents
and businesses. Retrofitting homes and businesses to
be more efficient creates local jobs. In addition, when
residents save on energy costs, they are more likely to
be spend at local businesses and add to the local
economy. Reducing fossil fuel use improves air quality,
and increasing opportunities for walking and bicycling
improves residents’ health.
3
U.S. Global Change Research Program. 2018. National Climate Assessment – Ch 19: Southeast. Retrieved from
https://nca2018.globalchange.gov/chapter/19/
City of Largo 2022 Inventory of Government Operations GHG Emissions 9Greenhouse Gas Inventory as a Step Toward Carbon Neutrality
Facing the climate crisis requires the concerted efforts of local governments and their partners, those
that are close to the communities directly dealing with the impacts of climate change.
Cities, towns and counties are well placed to define coherent and inclusive plans that address integrated
climate action — climate change adaptation, resilience and mitigation. Existing targets and plans need to
be reviewed to bring in the necessary level of ambition and outline how to achieve net-zero emissions
by 2050 at the latest. Creating a roadmap for climate neutrality requires the City of Largo to identify
priority sectors for action, while considering climate justice, inclusiveness, local job creation and other
benefits of sustainable development.
To complete this inventory, the City of Largo utilized tools and guidelines from ICLEI - Local Governments
for Sustainability (ICLEI), which provides authoritative direction for greenhouse gas emissions accounting
and defines climate neutrality as follows:
The targeted reduction of greenhouse gas (GHG) emissions and GHG
avoidance in government operations and across the community in all
sectors to an absolute net-zero emission level at the latest by 2050. In
parallel to this, it is critical to adapt to climate change and enhance
climate resilience across all sectors, in all systems and processes.
To achieve ambitious emissions reduction, and move toward climate neutrality, the City of Largo will
need to set a clear goal and act rapidly following a holistic and integrated approach. Climate action is an
opportunity for our community to experience a wide range of co-benefits, such as creating socio-
economic opportunities, reducing poverty and inequality, and improving the health of people and
nature.
City of Largo 2022 Inventory of Government Operations GHG Emissions 10ICLEI Climate Mitigation Milestones
In response to the climate emergency, many communities in the United States are taking responsibility
for addressing emissions at the local level. Since many of the major sources of greenhouse gas emissions
are directly or indirectly controlled through local policies, local governments have a strong role to play in
reducing greenhouse gas emissions within their boundaries, as well as influencing regional emissions
through partnerships and advocacy. Through proactive measures around land use patterns,
transportation demand management, energy efficiency, green building, waste diversion, and more, local
governments can dramatically reduce emissions in their communities. In addition, local governments are
primarily responsible for the provision of emergency services and the mitigation of natural disaster
impacts.
ICLEI provides a framework and methodology for local governments to identify and reduce greenhouse
gas emissions, organized along Five Milestones, also shown in Figure 2:
1. Conduct an LGO inventory and forecast of local government greenhouse gas emissions;
2. Establish a greenhouse gas emissions target;
3. Develop an LGO climate action plan for achieving the emissions reduction target;
4. Implement the climate action plan; and,
5. Monitor and report on progress.
This report represents the completion of ICLEI’s Climate Mitigation Milestone One, and provides a
foundation for future work to reduce greenhouse gas emissions in the City of Largo.
Figure 2: ICLEI Climate Mitigation Milestones
City of Largo 2022 Inventory of Government Operations GHG Emissions 11Inventory Methodology
Understanding a Greenhouse Gas Emissions Inventory
The first step toward achieving tangible greenhouse gas emission
reductions requires identifying baseline emissions levels and
sources and activities generating emissions in the community.
This report presents emissions from operations of the City
of Largo government. The government operations
inventory is mostly a subset of the community inventory,
as shown in Figure 3. For example, data on commercial
energy use by the community includes energy consumed
by municipal buildings, and community vehicle-miles-
traveled estimates include miles driven by municipal fleet
vehicles.
As local governments continue to join the climate protection
movement, the need for a standardized approach to
quantify GHG emissions has proven essential. This Figure 3: Relationship of Community and
Government Operations Inventories
inventory uses the approach and methods provided by the
U.S. Community Protocol for Accounting and Reporting Greenhouse Gas Emissions (Community Protocol)
and the Local Government Operations Protocol for Accounting and Reporting Greenhouse Gas Emissions
(LGO Protocol), both of which are described below.
Three greenhouse gases are included in this inventory: carbon dioxide (CO2), methane (CH4) and nitrous
oxide (N2O). Many of the charts in this report represent emissions in “carbon dioxide equivalent” (CO2e)
values, calculated using the Global Warming Potentials (GWP) for methane and nitrous oxide from the
IPCC 5th Assessment Report:
Table 1: Global Warming Potential Values (IPCC, 2014)
Global Warming
Greenhouse Gas
Potential
Carbon Dioxide (CO2) 1
Methane (CH4) 28
Nitrous Oxide (N2O) 265
City of Largo 2022 Inventory of Government Operations GHG Emissions 12Local Government Operations (LGO) Protocol
In 2010, ICLEI, the California Air Resources Board (CARB), and the California Climate Action Registry (CCAR)
released Version 1.1 of the LGO Protocol.4 The LGO Protocol serves as the national standard for
quantifying and reporting greenhouse emissions from local government operations. The purpose of the
LGO Protocol is to provide the principles, approach, methodology, and procedures needed to develop a
local government operations greenhouse gas emissions inventory.
The following activities are included in the LGO inventory :
• Energy and natural gas consumption from buildings & facilities
• Energy and natural gas consumption from streetlights/traffic signals
• Wastewater treatment processes
• On-road transportation from employee commute and vehicle fleet
• Solid Waste treatment processes
Quantifying Greenhouse Gas Emissions
Sources and Activities
Communities contribute to greenhouse gas emissions in many ways. Two central categorizations of
emissions are used in the community inventory: 1) GHG emissions that are produced by “sources” located
within the community boundary, and 2) GHG emissions produced as a consequence of community
“activities”.
Source Activity
Any physical process inside the The use of energy, materials,
jurisdictional boundary that and/or services by members of the
releases GHG emissions into the community that result in the
atmosphere creation of GHG emissions.
By reporting on both GHG emissions sources and activities, local governments can develop and promote
a deeper understanding of GHG emissions associated with their communities. A purely source‐based
emissions inventory could be summed to estimate total emissions released within the community’s
jurisdictional boundary. In contrast, a purely activity‐based emissions inventory could provide perspective
4 ICLEI. 2008. Local Government Operations Protocol for Accounting and Reporting Greenhouse Gas Emissions.
Retrieved from http://www.icleiusa.org/programs/climate/ghg-protocol/ghg-protocol
City of Largo 2022 Inventory of Government Operations GHG Emissions 13on the efficiency of the community, even when the associated emissions occur outside the jurisdictional
boundary. The division of emissions into sources and activities replaces the scopes framework that is used
in government operations inventories, but that does not have a clear definition for application to
community inventories.
Base Year
The inventory process requires the selection of a base year with which to compare current emissions. the
City of Largo’s LGO greenhouse gas emissions inventory utilizes 2019 as its baseline year, for which the
necessary data are available.
Quantification Methods
Greenhouse gas emissions can be quantified in two ways:
• Measurement-based methodologies refer to the direct measurement of greenhouse gas
emissions (from a monitoring system) emitted from a flue of a power plant, wastewater treatment
plant, landfill, or industrial facility.
• Calculation-based methodologies calculate emissions using activity data and emission factors. To
calculate emissions accordingly, the basic equation below is used:
Activity Data x Emission Factor = Emissions
Most emissions sources in this inventory are quantified using calculation-based methodologies. Activity
data refer to the relevant measurement of energy use or other greenhouse gas-generating processes such
as fuel consumption by fuel type, metered annual electricity consumption, and annual vehicle miles
traveled. Please see appendices for a detailed listing of the activity data used in composing this
inventory.Known emission factors are used to convert energy usage or other activity data into associated
quantities of emissions. Emissions factors are usually expressed in terms of emissions per unit of activity
data (e.g. lbs CO2/kWh of electricity). For this inventory, calculations were made using ICLEI’s ClearPath
tool.
City of Largo 2022 Inventory of Government Operations GHG Emissions 14Government Operations Emissions Inventory Results City of Largo 2022 Inventory of Government Operations GHG Emissions 15
Government operations emissions for 2019 are shown in Table 3 and Figure 6.
    Table 2: Local Government Operations Inventory
                                                                                     Usage    2019 Emissions
        Sector                           Fuel or source             2019 Usage
                                                                                      unit      (MTCO2e)
Buildings & Facilities    Electricity                                  48783540     kWh            22501
                          Natural Gas                                     29640     Therms          158

Buildings & Facilities total                                                                       22659

Street Lights & Traffic   Electricity                                    178848     kWh             82
Signals
Street Lights & Traffic Signals total                                                                82
Vehicle Fleet             Gasoline (off-road)                                 212   Gallons        1.8767
                          Diesel (off-road)                                  256    Gallons        2.6517
                          Gasoline (on-road)                            202138.9    Gallons        1774.8
                          Diesel (on-road)                              233605.6    Gallons        2385.1
Vehicle Fleet total                                                                                4165
Transit Fleet             Diesel                                              N/A
                          Gasoline                                            N/A
Transit Fleet total
                          Diesel                                          183084 VMT               89.084
Employee Commute          Gasoline                                       3478596 VMT               1471.1
                          Biodiesel/Ethanol                                  N/A
                          Electric                                           N/A
                          Hybrid Gasoline                                    N/A
                          PHEVs                                              N/A
                                    Employee Commute Total                                          1560
Electric Power            Various Fuels for Power Generation                  N/A
Production
                                Electric Power Production Total
Solid Waste               Waste Generation                                   60.04 Tons            45.038
                          Compost
                                          Solid waste total                                        45.038
Water and wastewater Digester Gas Flared

                          Digester Gas Combusted (used for boiler
                          operations)
                          Nitrogen Discharge                             47.4/day Kg N/day         36.015
                                     Water and wastewater total                                    36.015
  Process & Fugitive      Fugitive Emissions from Natural Gas
                                                                       N/A
      Emissions           Distribution

                 City of Largo 2022 Inventory of Government Operations GHG Emissions          16
Process & Fugitive Emissions total
Total government emissions 28,547.053
Figure 4 shows the distribution of emissions among the four sectors included in the inventory. Buildings
and Facilities represents the majority of emissions, followed by Vehicle Fleet and Employee Commute.
Remaining Sectors account for a small portion of emissions.
Figure 4: Local Government Operations Emissions
by Sector
City of Largo 2022 Inventory of Government Operations GHG Emissions 17Next Steps:
The local government operations emissions inventory points to a need for the establishment of an
enterprise energy management program within the City of Largo to include:
1. Full inventory of all energy and utility meters and accounts
2. Establishment of a Science-Based Target to reduce GHG emissions
3. Manage and monitor GHG reporting
4. Coordinate and guide the implementation of renewable energy installations and energy
efficiency improvements across the organization, in efforts to achieve 100% renewable energy
use by 2035
5. Support the creation of projects and programs for the community’s transition to 100%
renewable energy by 2050
6. Proactively monitor and report on energy usage across utility types as well as electric vehicle
energy consumption
7. Coordinate with Departments, utilities, partner organizations, and the community to
collaboratively facilitation a renewable energy transition
City of Largo 2022 Inventory of Government Operations GHG Emissions 18Conclusion
This inventory marks the completion of Milestone One of the Five ICLEI Climate Mitigation Milestones.
The next steps are to forecast emissions, set an emissions-reduction target, and build upon the existing
Largo Environmental Action Plan with a more robust climate action plan that identifies specific quantified
strategies that can cumulatively meet that target, to be included in the updated Sustainability and
Resilience Action Plan (SRAP).
The Intergovernmental Panel on Climate Change (IPCC) states that to meet the Paris Agreement
commitment of keeping warming below 1.5°C we must reduce global emissions by 50% by 2030 and reach
climate neutrality by 2050. Equitably reducing global emissions by 50% requires that high-emitting,
wealthy nations reduce their emissions by more than 50%. More than ever, it is imperative that countries,
regions, and local governments set targets that are ambitious enough to slash carbon emissions between
now and mid-century.
Science-Based Targets (SBT) are calculated climate goals, in line with the latest climate science, that
represent a community’s fair share of the global ambition necessary to meet the Paris Agreement
commitment. To achieve a science-based target, community education, involvement, and partnerships
will be instrumental. A SBT will be identified and included in the updated SRAP.
In addition, the City of Largo will continue to track key energy use and emissions indicators on an on-going
basis. It is recommended that communities update their inventories on a regular basis, especially as plans
are implemented to ensure measurement and verification of impacts. Regular inventories also allow for
“rolling averages” to provide insight into sustained changes and can help reduce the change of an
anomalous year being incorrectly interpreted. This inventory shows that buildings and facilities as well as
communitywide transportation patterns will be particularly important to focus on. Through these efforts
and others, the City of Largo can achieve environmental, economic, and social benefits beyond reducing
emissions.
City of Largo 2022 Inventory of Government Operations GHG Emissions 19Appendix: Methodology
Details
Energy
The following tables shows each activity, related data sources, and notes on data gaps.
Table 3: Energy Data Sources
Activity Data Source Data Gaps/Assumptions
Local Government Operations
Electricity consumption Duke Assets are not
Energy inventoried by utility
Billing account, all electricity
data from all sources
(including Waste Water
Treatment Facility) and
are calculated
cumulatively, with the
exception of street
lights. Street lights
denoted by "Lite" on
data provided by Duke
Energy.
Natural gas consumption Clearwater
Natural Gas
Billing
Table 4: Emissions Factors for Electricity Consumption
Year CO2 (lbs./MWh) CH4 (lbs./GWh) N2O (lbs./GWh)
2019 0.13383 5.4490x10⁻⁶ 7.9742x10⁻⁷
Transportation
Table 5: Transportation Data Sources
City of Largo 2022 Inventory of Government Operations GHG Emissions 20Activity Data Source Data Gaps/Assumptions
Local Government Operations
Government vehicle fleet Annual vehicle mileage was not
City of Largo
available
Employee commute Miles averaged based on commute data
availability. Process of calculating
commute data occurred through ArcGIS
Pro. Employee addresses were
georeferenced onto a map, then using
"Summarize Nearby" tool addresses
were located in different intervals in
distance from city hall. Intervals of
distance chosen were
1,2,3,4,5,7,10,15,20,25,30,40,50, and
60 miles from city hall. No addresses
were repeated (ie addresses 3 miles
away did not include addresses 1 or 2
City of Largo
miles away).
Percent of passenger cars, heavy and
light trucks is based on US Department
of Transportation Diesel Fuel Statistics
data 2015. Heavy trucks omitted due to
commute being through private
vehicles which are typically not heavy
trucks.
Total records used for this is 679,
however total employees is 930. Due to
public safety those 251 records were
omitted. Total was averaged based on
the 679 employees accounted for.
For vehicle transportation, it is necessary to apply average miles per gallon and emissions factors for CH4
and N2O to each vehicle type. The factors used are shown in Table 6.
Table 6: MPG and Emissions Factors by Vehicle Type
Fuel Vehicle type MPG CH4 g/mile N2O g/mile
Gasoline Passenger car 24.1 0 0
Gasoline Light truck 17.6 0 0
Gasoline Heavy truck 5.3713 0 0
City of Largo 2022 Inventory of Government Operations GHG Emissions 21Gasoline Motorcycle 24.1 0 0
Diesel Passenger car 24.1 5x10⁻⁴ 0.001
Diesel Light truck 17.6 0.001 0.0015
Diesel Heavy truck 6.3925 0.0051 0.0048
Wastewater
Table 7: Wastewater Data Sources
Activity Data Source Data Gaps/Assumptions
Local Government Operations
Nitrogen Discharge Largo population is
Digester Gas Combustion/Flaring City of Largo 84,000 but service area is
105,000
Potable Water
Table 8: Potable Water Data Sources
Activity Data Source Data Gaps/Assumptions
Local Government Operations
Potable Water Usage City of Largo Data manually entered
Utility Billing based on paper bills.
Solid Waste
Table 9: Solid Waste Data Sources
Activity Data Source Data Gaps/Assumptions
Local Government Operations
Waste Generated Based on number of stops at municipal locations. Total
tons in Largo= 85,781. City stops represent 0.07% of all
City of Largo stops for trash. 0.07% of all tons of waste= 60.04 tons.
Types of waste averaged by Pinellas County 2014
Waste Characterization Study.
City of Largo 2022 Inventory of Government Operations GHG Emissions 22Inventory Calculations
The 2019 inventory was calculated following the US Community Protocol and ICLEI’s ClearPath software.
As discussed in Inventory Methodology, the IPCC 5th Assessment was used for global warming potential
(GWP) values to convert methane and nitrous oxide to CO2 equivalent units. ClearPath’s inventory
calculators allow for input of the sector activity (i.e. kWh or VMT) and emission factor to calculate the
final CO2e emissions.
This work is licensed under a Creative Commons Attribution-NonCommercial-NoDerivatives 4.0 International
License. It may not be used for any commercial purpose. Any non-commercial use of this material must provide
attribution to ICLEI Local Governments for Sustainability USA.
City of Largo 2022 Inventory of Government Operations GHG Emissions 23You can also read