The Application of 13C NMR and Untargeted Multivariate Analysis for Classifying Virgin Coconut Oil - MDPI
←
→
Page content transcription
If your browser does not render page correctly, please read the page content below

Proceedings

The Application of 13C NMR and Untargeted Multivariate
Analysis for Classifying Virgin Coconut Oil †
Lolita G. Lagurin, Mark Joseph M. Garrovillas and Fabian M. Dayrit *

                                          Department of Chemistry, School of Science and Engineering, Ateneo de Manila University,
                                          Quezon City 1108, Philippines; llagurin@gmail.com (L.G.L.); mark.garrovillas@obf.ateneo.edu (M.J.M.G.)
                                          * Correspondence: fdayrit@ateneo.edu
                                          † Presented at the 1st International Electronic Conference on Food Science and Functional Foods,
                                            10–25 November 2020; Available online: https://foods_2020.sciforum.net/.

                                          Abstract: Virgin coconut oil (VCO) is produced from fresh mature coconut meat without the use of
                                          chemicals or high heat. VCO can be made using three processes: fermentation, centrifuge, and ex-
                                          peller. To determine quality, it is important to be able to differentiate control VCO (fresh) from old
                                          VCO, refined bleached and deodorized coconut oil (RBDCO), and VCO which has been adulterated
                                          with RBDCO. Differentiating these types of samples has remained a challenge because of their
                                          chemical similarity. This study investigated the ability of 13C NMR and multivariate analysis to
                                          differentiate these different coconut oil samples. The methodology used the standard 13C NMR
                                          pulse sequence with broadband 1H decoupling with dioxane as the internal standard (IS). After pre-
                                          processing of the spectra (alignment, bucketing/binning, normalization with respect to dioxane IS
                                          peak), untargeted multivariate analyses, both unsupervised and supervised, were done on the bins
                                          of the 13C peaks. Principal components analysis (PCA), a linear unsupervised method, was able to
                                          differentiate control VCO (n = 57) from RBDCO (n = 21), adulterated VCO (n = 9), and old VCO (n =
                                          11). Partial least squares–discriminant analysis (PLS–DA) was used as the supervised linear binary
                                          classifier. Using overall accuracy and AUC-ROC curves (by 100 cross validation and single valida-
                                          tion using manual holdout), the supervised dataset with an optimized model gave performances
                                          that were 99%, 95%, and 80% improved in differentiating control VCO vs. RBDCO, old VCO, and
                                          adulterated VCO (one vs. one), respectively. Predictive ability (Q2 < 0.20) and overall accuracy
Citation: Lagurin, L.G.; Garrovillas,     (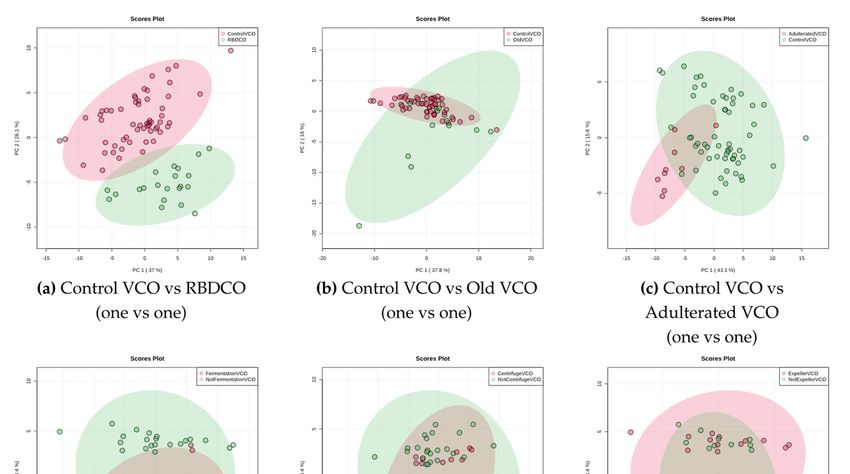
Proceedings 2021, 70, 54                                                                                                2 of 7

                           squeeze out the oil [2]. In contrast, coconut oil that is used for frying is produced from
                           copra and is refined, bleached, and deodorized and is referred to here as RBDCO.
                                 Because VCO and RBDCO have similar physio-chemical characteristics, it is difficult
                           to distinguish between them using classical techniques, and it is even more difficult to
                           detect the adulteration of VCO with RBDCO. The reported methods of detecting adulter-
                           ation using a different vegetable oil as an adulterant are inadequate for this purpose. Fou-
                           rier transform infrared (FTIR) spectroscopy and differential scanning calorimetry (DSC)
                           have been used to differentiate VCO from non-coconut oil samples, but these have not
                           been applied to the adulteration of VCO with RBDCO [3,4].
                                 NMR is a nondestructive, unbiased method of analyzing organic compounds. Com-
                           paring 1H and 13C NMR, the latter has a wider chemical shift range and gives singlets
                           resulting in simpler spectra with less problems related to overlapping peaks in compari-
                           son to spectra across different magnetic field strengths. 13C NMR is also less susceptible
                           to solvent and temperature effects. As 13C NMR is less sensitive than 1H NMR, it requires
                           a longer acquisition time. Although broadband 1H-decoupled 13C NMR cannot be inte-
                           grated, 13C NMR analysis is reproducible and can be used for the profiling of organic
                           samples. Quantitative 13C NMR analysis can be done using an inverse-gated decoupling
                           pulse sequence, but this requires long recycle delays. Although the use of relaxation
                           agents may shorten the repetition time when using quantitative 13C NMR, the 13C NMR
                           profile is suitable only for chemometric pattern recognition and untargeted multivariate
                           analysis, but not for targeted quantification [5].
                                 The statistical pipeline follows a typical multivariate method used in metabolomics
                           [6,7]. 13C NMR profiles were pre-processed, aligned, bucketed, normalized, and auto-
                           scaled. Linear methods were applied to the data. Exploratory unsupervised analysis, such
                           as principal component analysis (PCA), was used to infer patterns and clustering within
                           the dataset. Binary classifiers were developed for the better evaluation of model perfor-
                           mance compared to multi-class classifiers in supervised analysis. Partial least squares–
                           discriminant analysis (PLS–DA), a linear method, was then used for supervised analysis.
                           The suitability of using a PLS–DA model (as it tends to overfit) was evaluated by the over-
                           all accuracy and the R2 (linear fit of training data) and Q2 (linear fit of predicted data/pre-
                           diction performance on new data) parameters. The resulting models were then optimized
                           for number of PLS–DA variables and a number of features by being internally cross-vali-
                           dated by random class assignments, manually single-validated using a manual holdout,
                           and evaluated on ROC-based performance and predictive ability [8].
                                 Receiver operating characteristics (ROC) are a diagnostic tool used to discriminate
                           two samples based on a binary classifier system and a discrimination threshold for organ-
                           izing classifiers and visualizing their performance. An ROC graph is a plot used to visu-
                           alize the performance of the differentiation. The ROC curve plots the true positive rate
                           (sensitivity) on the y axis against the false-positive rate (1-specificity) on the x axis. The
                           area under the curve (AUC) of an ROC curve is used to quantify the performance of a
                           binary classifier, a normal or control versus an abnormal or not controlled characteristic.
                           Both the ROC curve and its corresponding AUC are functions of sensitivity and specificity
                           of a prediction model. A perfect test will have an AUC value of 1.0, whereas a random
                           chance will have a value of 0.5. In interpreting the AUC values we used the following: 1.0
                           is a perfect test, 0.9–0.99 is an excellent test, 0.8–0.89 is a good test, 0.7–0.79 is a fair test,
                           0.51–0.69 is a poor test, and 0.5 is of no value or is an unusable test [9].
                                 The predictive performance of a model can be measured by permutation testing to
                           determine whether it is statistically significant or not. A p-value < 0.05 means that given a
                           randomly permuted outcome variable, there is less than 5% chance that a model of similar
                           performance to the ‘‘true’’ non-permuted model will be produced.

                           2. Research Objectives
                                The goal of this research is to develop a 13C NMR method that can be used to differ-
                           entiate VCO from RBDCO, from VCO adulterated with RBDCO, and old VCO (VCO
Proceedings 2021, 70, 54                                                                                        3 of 7

                           which is beyond the shelf life of two years). Additionally, we also investigated whether
                           this method will be able to differentiate VCO according to the type of production process,
                           that is, fermentation, centrifuge, or expeller.

                           3. Materials and Methods
                           3.1. Oil Samples
                                Total VCO samples (n = 98) were divided into two groups: sample types—control
                           VCO (n = 57) and not control VCO (n = 41). The control VCO (n = 57) comprised of two
                           VCO oil types—the observed (n = 42), and the submitted (n = 15) samples. The observed
                           and the submitted samples were acquired from the VCO producers of the Philippines who
                           committed to participate in the study. Three to four manufacturers per process (fermen-
                           tation, centrifuge, and expeller) were enrolled. Each manufacturer provided two oil type
                           samples: observed and submitted. The observed samples were gathered by the research-
                           ers while observing the full VCO production process. The submitted samples were pro-
                           duced unobserved by the researchers. The observed samples constituted the training sam-
                           ples, while the submitted samples were the validation samples.
                                The sample type not control VCO (n = 41) consisted of the following oil types: old
                           VCO (n = 11), adulterated VCO (n = 9), and RBDCO (n = 21). The old/degraded VCO sam-
                           ples included samples which were subjected to accelerated degradation at 40 °C for 6
                           months and samples which were over 2 years old. The adulterated VCO samples were
                           composed of fermentation, centrifuge, and expeller samples that were adulterated with
                           an RBDCO sample by 25%, 50%, and 75%.

                           3.2. Chemicals, Reagents, and Sample Preparation
                                Deuterated chloroform (CDCl3) with 0.05% v/v trimethyl silane (TMS) was used as
                           the NMR solvent (cat# DLM-7TB-100S, Cambridge Isotope Laboratories, Inc.). 1,4-dioxane
                           (cat# 1.09671, Merck ACS, ISO grade) was used as the internal standard (IS).
                                Approximately 350 µL of the oil sample was transferred into a 5 mm Wilmad High
                           Throughput NMR tube (WG-1000-8-50) and about 230 µL of the CDCl3 solvent containing
                           2.9% w/w 1,4-dioxane was added. 1,4-dioxane was added as the IS for normalizing the
                           metabolite bucket integrations. The mixture was shaken to homogenize the sample.

                           3.3. Instrumentation and Experimental Parameters
                                An Avance Neo 400 nuclear magnetic resonance (NMR) spectrometer (Bruker Bio-
                           spin) was used operating at 100.097 MHz 13C. A standard Bruker 13C pulse sequence was
                           used (C13CPD/zgpg30) with 64k (65,536) acquisition points, 4k (4096) scans, 1.38 s acqui-
                           sition time, spectral width from −18.6 ppm to 219.3 ppm (23,809.523 Hz) with autogain
                           settings and run at VT = 300 Kelvin.

                           3.4. Data Processing
                                 Processed NMR spectra used standard automatic Bruker Topspin 4.0.7 13C post-pro-
                           cessing third party packages, and statistical frameworks of the R Statistical software were
                           used for the batch processing of spectra and in the unsupervised and supervised analyses.
                           NMRProcFlow [10] was used for batch processing of peak shifting, spectral alignment,
                           and variable bucketing. MetaboAnalyst 4.0 [11] was used for the data normalization and
                           statistical analyses (untargeted, multivariate; unsupervised and supervised).

                           4. Results
                           4.1. Unsupervised Analysis
                                 Preliminary exploratory unsupervised analyses were done in the context of the
                            research objectives. Using 13C NMR untargeted profiling and linear methods: can we
                            differentiate control VCO samples from RBDCO samples and other VCO samples not
                            considered control? Can we differentiate by VCO process?
Proceedings 2021, 70, 54                                                                                        4 of 7

                                 Binary classifiers were designed so that model performance can be easily evaluated
                           by ROC curves. These binary classifiers were then used in supervised analyses and on the
                           test samples: control vs. not control VCO (one vs. one); control VCO vs. RBDCO; control
                           VCO vs. old VCO; and control VCO vs. adulterated VCO. Control VCO samples were
                           used for the VCO process binary classifiers (one vs. rest): fermented VCO vs. not fer-
                           mented VCO; centrifuged VCO vs. not centrifuged VCO; and expeller VCO vs. not expel-
                           ler VCO.
                                 2D unsupervised exploratory PCA plots for the binary classifiers for control VCO vs.
                           not control VCO are shown in Figure 1, where control VCO vs. RBDCO is clearly sepa-
                           rated. Some overlap is seen for control VCO vs. old VCO. There is significant overlap and
                           no clear separation seen for the binary classifiers for the VCO processes.

                           Figure 1. 2D unsupervised exploratory PCA plots for the binary classifiers.

                           4.2. Supervised Analysis
                                  PLS–DA performance of control VCO vs. RBDCO indicates it is a perfect model and
                            statistically significant (Figure 2). The optimal Q2 is determined to be four PLS–DA com-
                            ponents with overall accuracy of about 1. Preliminary permutation tests indicate a p-value
                            < 0.001 (0/1000 permutations). Monte Carlo cross validation (MCCV) indicates the model
                            is a perfect classifier with most of the AUC for the ROC curves being 1. We get the same
                            performance for a model built with buckets with AUC > 0.99 for 100 CV and for holdout
                            data. There is good and clear separation between samples of the two classes. The predic-
                            tive accuracy of the assembled model using a permutation test with 1000 permutations is
                            statistically significant, p < 0.001.
                                  The PLS–DA classifiers for the control VCO processes (fermentation vs. not fermen-
                            tation, centrifuge vs. not centrifuge, and expeller vs. not expeller) indicated poor model
                            performance, with some having comparatively high p-values.
Proceedings 2021, 70, 54 5 of 7
Figure 2. PLS–DA performance of control virgin coconut oil (VCO) vs. refined bleached and deo-
dorized coconut oil (RBDCO) indicates it is a perfect model and statistically significant. The opti-
mal number of components or PLS latent variables is determined to be 4 denoted with a * in sub-
plot (a). ROC curves for 100 CV (blue trace) and Single Validation (violet trace) are both equal to 1
as shown in subplot (d). Solid circle markers indicate the RBDCO class, the outline is for Control
VCO class, holdout samples used in single validation are highlighted in red in subplot (e).
5. Discussion
Based on the unsupervised analyses, we expect that differentiating control VCO from
RBDCO, from VCO adulterated with RBDCO, and from old VCO samples is feasible, but
differentiating by VCO process is not feasible. The control VCO vs. RBDCO classifier is
essentially a perfect model and very highly statistically significant. The control VCO vs.
old VCO classifier may also be considered an excellent model, and marginally close to the
cutoff of p-value = 0.05. This may be improved with more old VCO samples.
The control VCO vs. adulterated VCO classifier is a mixed bag. Although the model
performance may be considered good from a practical application, it was not statistically
significant, meaning that there may be a significant number of models with random label-
ing assignments that will perform better than the optimized model. We hope to determine
in future studies if the statistical significance of the model can be improved with more
samples of adulterated VCO.
6. Summary and Conclusions
The use of 13C NMR and multivariate linear statistical methods were sufficient to
discriminate the following: control VCO from RBDCO; control VCO from old VCO; and
control VCO from VCO adulterated with RBDCO. The accuracy of discriminating VCO
samples produced by different processes proved to be inadequate. Figure 3 summarizes
the results and conclusions.Proceedings 2021, 70, 54 6 of 7
Figure 3. Graphical summary of the results and conclusions.
Supplementary Materials: The following are available online at https://www.mdpi.com/arti-
cle/10.3390/foods_2020-07718/s1.
Author Contributions: Conceptualization: F.M.D.; methodology: L.G.L. and M.J.M.G.; software
and formal analysis: M.J.M.G.; writing and editing: M.J.M.G., L.G.L. and F.M.D.; supervision and
project administration: F.M.D. All authors have read and agreed to the published version of the
manuscript.
Funding: This work was funded by the Philippine Council for Industry and Energy and Emerging
Technologies Research and Development, Department of Science and Technology (PCIEERD-
DOST).
Institutional Review Board Statement: Not Applicable.
Informed Consent Statement: Not Applicable.
Data Availability Statement: The data presented in this study are available on request from the
corresponding author.
Acknowledgments: We would like to thank the Virgin Coconut Oil Producers and Traders Associ-
ation of the Philippines, Inc. for assistance with the acquisition of the samples; our research collab-
orator, University of the Philippines, College of Home Economics; and Grace B. Tantengco and
Jerika Marie A. Arceo for assistance with sample preparation.
Conflicts of Interest: The authors declare no conflicts of interest.
References
1. PNS/BAFPS-22:2007. Philippine National Standard for Virgin Coconut Oil. 2007. Available online:
http://www.bafs.da.gov.ph/bafs_admin/admin_page/pns_file/PNS-BAFS22-2007VCOrevised.pdf (accessed on 24 March 2021).
2. Dia, V.P.; Garcia, V.V.; Mabesa, R.C.; Tecson-Mendoza, E.M. Comparative physicochemical characteristics of virgin coconut oil
produced by different methods. Philipp. Agric. Sci. 2005, 88, 462–475.
3. Marikkar, J.M.N. Differential Scanning Calorimetric Analysis of Virgin Coconut Oil, Palm Olein, and their Adulterated Blends.
CORD 2019, 35, 9.
4. Rohman, A.; Che Man, Y.B. The use of Fourier transform mid infrared (FT-MIR) spectroscopy for detection and quantification
of adulteration in virgin coconut oil. Food Chem. 2011, 129, 583–588.
5. Dayrit, F.M.; de Dios, A.C. 1H and 13C NMR for the Profiling of Natural Product Extracts: Theory and Applications. In
Spectroscopic Analyses-Developments and Applications; Sharmin, E., Zafar, F., Eds.; IntechOpen: Rijeka, Croatia, 2017.
6. Liland, K.H. Multivariate methods in metabolomics—From pre-processing to dimension reduction and statistical analysis.
TrAC Trends Anal. Chem. 2011, 30, 827–841.
7. Worley, B.; Powers, R. Multivariate Analysis in Metabolomics. Curr. Metab. 2012, 1, 92–107.
8. Westerhuis, J.A.; Hoefsloot, H.C.J.; Smit, S.; Vis, D.J.; Smilde, A.K.; van Velzen, E.J.J.; van Duijnhoven, J.P.M.; van Dorsten, F.A.
Assessment of PLS–DA cross validation. Metabolomics 2008, 4, 81–89.
9. Carter, J.V.; Pan, J.; Rai, S.N.; Galandiuk, S. ROC-ing along: Evaluation and interpretation of receiver operating characteristic
curves. Surgery 2016, 159, 1638–1645.Proceedings 2021, 70, 54 7 of 7
10. Jacob, D.; Deborde, C.; Lefebvre, M.; Maucourt, M.; Moing, A. NMRProcFlow: A graphical and interactive tool dedicated to 1D
spectra processing for NMR-based metabolomics. Metabolomics 2017, 13, 36.
11. Chong, J.; Wishart, D.S.; Xia, J. Using MetaboAnalyst 4.0 for Comprehensive and Integrative Metabolomics Data Analysis. Curr.
Protoc. Bioinform. 2019, 68, e86.You can also read