Synergism of imipenem with fosfomycin associated with the active cell wall recycling and heteroresistance in Acinetobacter calcoaceticus baumannii ...
←
→
Page content transcription
If your browser does not render page correctly, please read the page content below
www.nature.com/scientificreports
OPEN Synergism of imipenem
with fosfomycin associated
with the active cell wall
recycling and heteroresistance
in Acinetobacter
calcoaceticus‑baumannii complex
Uthaibhorn Singkham‑in1 & Tanittha Chatsuwan1,2*
The carbapenem-resistant Acinetobacter calcoaceticus-baumannii (ACB) complex has become an
urgent threat worldwide. Here, we determined antibiotic combinations and the feasible synergistic
mechanisms against three couples of ACB (A. baumannii (AB250 and A10), A. pittii (AP1 and AP23),
and A. nosocomialis (AN4 and AN12)). Imipenem with fosfomycin, the most effective in the time-
killing assay, exhibited synergism to all strains except AB250. MurA, a fosfomycin target encoding the
first enzyme in the de novo cell wall synthesis, was observed with the wild-type form in all isolates.
Fosfomycin did not upregulate murA, indicating the MurA-independent pathway (cell wall recycling)
presenting in all strains. Fosfomycin more upregulated the recycling route in synergistic strain (A10)
than non-synergistic strain (AB250). Imipenem in the combination dramatically downregulated
the recycling route in A10 but not in AB250, demonstrating the additional effect of imipenem
on the recycling route, possibly resulting in synergism by the agitation of cell wall metabolism.
Moreover, heteroresistance to imipenem was observed in only AB250. Our results indicate that
unexpected activity of imipenem on the active cell wall recycling concurrently with the presence of
heteroresistance subpopulation to imipenem may lead to the synergism of imipenem and fosfomycin
against the ACB isolates.
Acinetobacter calcoaceticus-baumannii (ACB) complex (particularly A. baumannii, A. pittii, and A. nosocomialis)
has globally emerged as one of the most important nosocomial pathogens in healthcare settings1. A critical obsta-
cle to the treatment of ACB infections is antibiotic resistance, especially carbapenem resistance2. Carbapenems
are β-lactam antibiotics, which inhibit bacterial cell wall synthesis via covalent binding to penicillin-binding
proteins (PBPs). The PBPs are enzymes (such as transpeptidase and transglycosylase) catalyzing peptidoglycan
crosslinking3. The most dominant mechanism of carbapenem resistance in ACB is carbapenemase production,
including Imipenemase (IMP), New Delhi Metallo-β-lactamases (NDM), Oxacillinase (OXA)-23, OXA-58, and
OXA-244. The secondary ones are the overexpression of efflux pumps (such as AdeB, AdeE, and AdeY) and
the reduction of porins (including CarO, 33–36 kDa OMP, and OprD)5,6. Although colistin is effective against
carbapenem-resistant ACB, unfortunately, colistin monotherapy is limited due to its toxicity. Therefore, anti-
biotic combinations, which are colistin-based or imipenem-based combinations, are inevitably used to combat
carbapenem-resistant ACB7,8.
Fosfomycin inhibits the first step of the de novo cell wall (peptidoglycan) biosynthesis that converts uridine
diphosphate N-acetylglucosamine (UDP-GlcNAc) to enolpyruvyl-UDP-GlcNAc by UDP-N-acetylglucosamine
enolpyruvyl transferase (MurA). Subsequently, enolpyruvyl-UDP-GlcNAc catalyzed by MurA is converted to
UDP N-acetylmuramic acid (UDP-MurNAc) by UDP-N-acetylenolpyruvoylglucosamine reductase (MurB).
The UDP-MurNAc is a precursor in cell wall synthesis. Fosfomycin covalently binds to M urA9, resulting in the
1
Department of Microbiology, Faculty of Medicine, Chulalongkorn University, Rama VI Road, Bangkok 10330,
Thailand. 2Antimicrobial Resistance and Stewardship Research Unit, Faculty of Medicine, Chulalongkorn
University, Rama VI Road, Bangkok 10330, Thailand. *email: Tanittha.C@chula.ac.th
Scientific Reports | (2022) 12:230 | https://doi.org/10.1038/s41598-021-04303-7 1
Vol.:(0123456789)www.nature.com/scientificreports/
MIC (mg/L) Allelic number
Carbapenemase Sequence type
ACB species Isolate IPM MEM FOF AMK CT gene gltA gyrB gdhB recA cpn60 gpi rpoD (ST)
A. baumannii AB250 16 (R) 16 (R) 128 (I) 4 (S) 1 (I) blaOXA-51, blaOXA-24 1 12 56 1 1 177 26 1416
A. baumannii A10 128 (R) 256 (R) 256 (R) 2 (S) 2 (I) blaOXA-51, blaOXA-24 1 15 13 12 4 163 5 1426
A. pittii AP1 32 (R) 32 (R) 256 (R) 0.5 (S) 2 (I) blaOXA-58, blaIMP 56 104 137 7 25 153 74 1419
A. pittii AP23 16 (R) 32 (R) 128 (I) 2 (S) 1 (I) blaOXA-23 56 104 137 7 51 153 74 1420
A. nosocomialis AN4 16 (R) 32 (R) 256 (R) 2 (S) 2 (I) blaOXA-23 39 65 142 30 25 114 28 958
A. nosocomialis AN12 32 (R) 64 (R) 128 (I) 2 (S) 2 (I) blaOXA-23 39 65 142 30 25 114 28 958
Table 1. The minimum inhibitory concentrations (MICs) of six ACB isolates to imipenem (IPM), meropenem
(MEM), fosfomycin (FOF), amikacin (AMK), and colistin (CT) were determined by agar dilution method.
The results were interpreted as susceptible (S), intermediate resistant (I), or resistant (R). The presence of
carbapenemase genes was performed by PCR. The clonality was performed by MLST Oxford scheme as seven
allelic numbers and a sequence type number.
inactivation of cell wall synthesis9. Fosfomycin is recommended not only for uncomplicated urinary tract infec-
tions (UTIs) by Escherichia coli but also for the complicated UTIs caused by extended-spectrum beta-lactamase
(ESBL)-producing Enterobacteriaceae10. The potent activity of fosfomycin has been announced in combination
with antibiotics against non-fermentative bacteria, including Pseudomonas aeruginosa and A. baumannii11,12.
Many mechanisms of fosfomycin resistance have been characterized, including mutation at the active site of
MurA and overexpression of fosfomycin-specific efflux pump, named A baF9,13. Moreover, P. aeruginosa and A.
baumannii are intrinsically resistant to fosfomycin by cell wall recycling pathway14,15. This bypath is a MurA-
independent pathway, leading to fosfomycin resistance. Besides the de novo pathway, UDP-MurNAc is also
synthesized through cell wall recycling. Briefly, the recycling route begins with the inner membrane transporter,
AmpG, uptakes shedding cell wall, a nhydromuropeptides14,15. The anhydromuropeptides (GlcNAc-AnhMur-
NAc-Ala-Gln-DAP-Ala) are converted to GlcNAc and AnhMurNAc by β-N-acetylglucosaminidase (NagZ) and
AnhMurNAc-l-alanine amidase (AmpD), respectively. The AnhMurNAc is phosphorylated by AnhMurNAc
kinase (AnmK), generating MurNAc-6P. The MurNAc-6P is dephosphorylated to yield MurNAc by MurNAc-
6P phosphatase (MupP). The C1 hydroxyl group of MurNAc is phosphorylated by MurNAc kinase (AmgK),
yielding MurNAc-α-1P that is converted to cell wall precursor, UDP-MurNAc, by N-acetylmuramate α-1-P
uridylyltransferase (MurU). We previously reported that imipenem in combination with fosfomycin was effec-
tive against carbapenem-resistant A. baumannii16. However, the synergism was not associated with carbapenem
resistance mechanisms. Here, we investigated the in vitro activity of antibiotic combinations against carbapenem-
resistant ACB complex, including A. pittii and A. nosocomialis17. To clarify the plausible synergistic mechanisms
of imipenem and fosfomycin combination, the difference in the resistance mechanisms of both imipenem and
fosfomycin were investigated among synergistic and non-synergistic strains. For carbapenem resistance, pro-
duction of carbapenemases, overexpression of efflux pumps, and reduction of OMPs were characterized. For
fosfomycin resistance, mutation and expression of MurA, overexpression of efflux pump, and expression of
cell wall recycling enzymes were evaluated. In addition, the presence of heteroresistance to either imipenem or
fosfomycin was performed among the ACB isolates. The heteroresistance is defined as a heterogeneous bacterial
population, which has diverse antibiotic resistance potency linking to antibiotic treatment f ailure16. We hypoth-
esized that the heteroresistance phenotype may be related to a failure of imipenem and fosfomycin combination
(no synergism). In this study, the heteroresistance characteristics were identified by using a population analysis
profile (PAP) assay.
Results
Antibiotic susceptibility and carbapenemase genes in ACB isolates. The two couples of A. bau-
mannii (AB250 and A10) and A. pittii (AP1 and AP23), unique clones emerging in our hospital, and a pair of A.
nosocomialis (AN4 and AN12) were included in this study. Among all six carbapenem-resistant ACB isolates,
both A. baumannii AB250 and A10 carried blaOXA-24, both A. nosocomialis AN4 and AN12 carried blaOXA-23,
and A. pittii AP1 and AP23 carried blaOXA-58 with blaIMP and blaOXA-23, respectively (Table 1). The antibiotic sus-
ceptibilities were interpreted following the Clinical and Laboratory Standards Institute (CLSI) guidelines (Sup-
plementary Table S1). All ACB isolates were susceptible to amikacin but no intermediate resistant or resistant
to fosfomycin (Table 1). All isolates were intermediate to colistin with the MICs below the resistant breakpoint
(4 mg/L) (Table 1).
Clonal of six ACB isolates. The clonality of all six ACB isolates was studied by the multi-locus sequence
typing (MLST) Oxford scheme (Table 1). A. baumannii and A. pittii isolates belonged to different clones (ST
types). Both A. baumannii AB250 and A10 carrying blaOXA-24 belonged to ST1416 and ST1426, respectively. A.
pittii AP1 and AP23 carrying different carbapenemase genes belonged to different clones as ST1419 and ST1420,
respectively, which differed only in an allelic number of cpn60. A. nosocomialis AN4 and AN12 belonged to the
same ST, ST958.
Scientific Reports | (2022) 12:230 | https://doi.org/10.1038/s41598-021-04303-7 2
Vol:.(1234567890)www.nature.com/scientificreports/
Figure 1. OMP profiles, OMP expression, and efflux pump gene expression among six ACB isolates. (A–C)
OMP extracts were studied by SDS-PAGE. (D–F) The relative density of OMP expression was calculated and
normalized to OmpA. All experiments were performed in triplicate. Mean values of the relative density were
plotted with error bars representing the standard error of the mean (n = 3). The p-values were calculated using
unpaired two-tailed t-test (*p-value ˂0.05; **p-value < 0.01; ***p-value < 0.001 and ns, non-significant). (G) The
relative mRNA expression of adeB among A. baumannii was evaluated by RT-PCR and normalized to 16S rRNA
expression. The relative mRNA expression of adeE (H) and adeY (I) was evaluated by RT-PCR and normalized
to 16S rRNA expression. All experiments were performed in triplicate. Mean values of the relative mRNA
expression were plotted with error bars representing the standard error of the mean (n = 3). The p-values were
calculated using unpaired two-tailed t-test (*p-value ˂0.05; **p-value < 0.01; ***p-value < 0.001 and ns, non-
significant).
OMP profiles. Three OMPs act as porins for carbapenem entry, including CarO (29 kDa OMP), 33–36 kDa
OMP, and OprD (43 kDa OMP). These OMPs were found in all OMP profiles of six ACB isolates (Fig. 1A–C,
Supplementary Fig. S1A–C). The relative density of each OMP was calculated and normalized to that of major
OMP (OmpA) as internal control, representing OMP expression (Fig. 1D–F). OMP expressions were com-
pared within the species. The reduction of 33–36 kDa OMP and CarO expression was observed in A. bauman-
nii AB250, but the reduction of OprD was observed in A10 (Fig. 1A,D). In A. pittii, the reduction of OprD,
33–36 kDa OMP, and CarO was observed in AP23 (Fig. 1B,E). Among A. nosocomialis isolates, the reductions of
OprD and 33–36 kDa OMP were observed in AN12 (Fig. 1C,F).
Overexpression of efflux pumps. Multidrug efflux pumps play one of the essential roles in the antibiotic
resistance of ACB isolates. The overexpression of efflux pump phenotype for carbapenems was characterized
by using CCCP. No ACB isolate showed the positive phenotype of efflux pump overexpression to carbapenems
(Table 2). Therefore, we determined the expression level of efflux pump genes. In this study, A. baumannii car-
ried adeB gene, whereas A. pittii carried adeE and adeY genes (Table 2). Neither of these genes was found in A.
nosocomialis isolates (Table 2). Overexpression of adeB was observed in A. baumannii A10, which had a high
level of carbapenem MICs (128–256 mg/L) (Fig. 1G and Table 1). A. pittii AP1 showed slightly overexpressed
adeE (Fig. 1H) with twofold carbapenem MICs above these of AP23 (Table 1). A. pittii AP1 and AP23 equally
displayed the adeY expression (Fig. 1I).
Scientific Reports | (2022) 12:230 | https://doi.org/10.1038/s41598-021-04303-7 3
Vol.:(0123456789)www.nature.com/scientificreports/
MIC (mg/L) Efflux pump gene
ACB species Isolate IPM IPM + CCCP MEM MEM + CCCP FOF FOF + CCCP adeB adeE adeY abaF
A. baumannii AB250 16 16 16 16 128 64 + − − +
A. baumannii A10 128 128 256 256 256 128 + − − +
A. pittii AP1 32 32 32 32 256 256 − + + ND
A. pittii AP23 16 16 32 32 128 128 − + + ND
A. nosocomialis AN4 16 16 32 32 256 128 − − − ND
A. nosocomialis AN12 32 32 64 32 128 128 − − − ND
Table 2. MICs of imipenem (IPM), meropenem (MEM), and fosfomycin (FOF) in either with or without
CCCP and the presence of efflux pump gene of six ACB isolates. The positive result for efflux overexpression
was defined as the decreased MICs at least fourfold at the presence of CCCP. The presence of efflux pump
genes was determined by PCR. (+) presence of gene, (−) absence of gene, ND not determined.
FIC index (interpretation)
ACB species Isolate IPM + AMK IPM + CT IPM + FOF MEM + AMK MEM + CT MEM + FOF
A. baumannii AB250 0.75 (N) 2.00 (N) 0.5 (S) 1.00 (N) 0.63 (N) 1.00 (N)
A. baumannii A10 0.75 (N) 0.75 (N) 0.5 (S) 1.00 (N) 1.00 (N) 0.75 (N)
A. pittii AP1 0.5 (S) 1.00 (N) 0.38 (S) 1.00 (N) 0.56 (N) 0.5 (S)
A. pittii AP23 0.75 (N) 1.00 (N) 0.5 (S) 0.63 (N) 1.00 (N) 1.00 (N)
A. nosocomialis AN4 0.63 (N) 2.00 (N) 0.5 (S) 0.75 (N) 0.75 (N) 0.5 (S)
A. nosocomialis AN12 0.38 (S) 1.00 (N) 0.5 (S) 0.75 (N) 2.00 (N) 0.5 (S)
Table 3. The activity of carbapenems, imipenem (IPM) and meropenem (MEM), in combination with
amikacin (AMK), colistin (CT), or fosfomycin (FOF) performed by checkerboard assay. The FIC index was
calculated and interpreted as synergism (S) and no interaction (N).
In conclusion of carbapenem resistance mechanisms, the major mechanism found in all isolates was car-
bapenemase production. OXA-23 production was present in AP23, AN4, and AN12. OXA-24 production was
present in AB250 and A10. The production of OXA-58 with IMP was found in AP1. For the reduction of porins,
reduced OprD was present in A10, AP23, and AN12. Reduced 33–36 kDa porin was present in AB250, AP23
and AN12. Reduced CarO was present in AB250 and AP23. For efflux pumps, overexpression of adeB and adeE
was present in A10 and AP1, respectively.
Activity of antibiotic combinations against six ACB isolates. The in vitro activities of imipenem or
meropenem in combination with either amikacin, colistin, or fosfomycin against A. baumannii, A. pittii, and A.
nosocomialis isolates were determined by checkerboard assay. The MICs of antibiotic combinations that used for
the fractional inhibitory concentration (FIC) index calculation in Eq. (1), are present in Supplementary Table S2.
The most effective combination was imipenem with fosfomycin that exhibited synergism (FICI ≤ 0.5) against all
six ACB isolates (Table 3). Secondly, meropenem plus fosfomycin and imipenem plus amikacin were potential
combinations against A. nosocomialis and A. pittii (Table 3). No synergism was observed in imipenem plus
colistin, meropenem plus amikacin, and meropenem plus colistin. From the results of fosfomycin susceptibility,
fosfomycin alone had inadequate potency against all ACB isolates (Table 1). The combination results differed in
that fosfomycin had a synergistic activity with carbapenems, especially imipenem.
Time‑killing curves of imipenem with fosfomycin against six ACB isolates. As a result of the
checkerboard assay, we, therefore, verified the synergism of imipenem with fosfomycin against six ACB isolates
by time-killing assay. In every ACB isolate, the growth control curves were normal S-curves, which reached the
log phase (exponential phase) at 2 to 4 h of incubation (Fig. 2). Both 0.5× and 1× imipenem MICs were unable to
kill A. baumannii AB250 (Fig. 2A) and A10 (Fig. 2D). In the presence of 0.5× fosfomycin MIC, AB250 was able
to grow (Fig. 2B), but it was killed by 1× fosfomycin MIC for 4 h and regrew subsequently (Fig. 2B). Both fosfo-
mycin concentrations (0.5× and 1× MICs) killed A10 for 6 h before the regrowth (Fig. 2E). No combination was
able to achieve the synergistic activity with AB250 (Fig. 2C). AB250 was not killed by either 0.5× or 1× imipenem
MIC combined with 0.5× fosfomycin MIC (Fig. 2C). Although imipenem in combination with 1× fosfomycin
MIC eliminated AB250, the regrowth occurred after 4 h, resulting in no synergism. In contrast, most combina-
tions were able to eradicate A10 leading to synergism, except 0.5× combination that achieved regrowth and no
synergism (Fig. 2F).
In A. pittii, both concentrations of single imipenem killed AP1 for 4 h before regrowth occurring (Fig. 2G).
Although 0.5× imipenem MIC did not kill AP23, 1× MIC was able to eradicate for 12 h before regrowth (Fig. 2J).
All fosfomycin concentrations alone could kill AP1 for 6 h, then regrowth occurred (Fig. 2H). Whereas 0.5× and
1× fosfomycin MICs showed inhibitory activity and bactericidal activity, respectively, to AP23 for 6 h ahead of
Scientific Reports | (2022) 12:230 | https://doi.org/10.1038/s41598-021-04303-7 4
Vol:.(1234567890)www.nature.com/scientificreports/
Figure 2. Time-killing curves of imipenem with fosfomycin against six ACB isolates. There were three
conditions, including 0.5× MIC and 1× MIC of imipenem alone (A,D,G,J,M,P), 0.5× MIC and 1× MIC of
fosfomycin alone (B,E,H,K,N,Q), and the combinations (C,F,I,L,O,R) Mean values of viable cells were plotted
with error bars representing the standard error of the mean (n = 3). All experiments were performed in triplicate
and the detection limit of the viable cells is 1 02 CFU/mL (dash lines).
Scientific Reports | (2022) 12:230 | https://doi.org/10.1038/s41598-021-04303-7 5
Vol.:(0123456789)www.nature.com/scientificreports/
regrowth (Fig. 2K). All combinations eradicated AP1 that reached an undetectable limit, resulting in synergism
(Fig. 2I). In AP23, no synergism was observed in 0.5× imipenem and 0.5× fosfomycin MIC combination that
regrowth appeared after 6 h (Fig. 2L). Apart from this combination, others killed AP23, achieving undetectable
points and synergistic activity (Fig. 2L).
In A. nosocomialis, both concentrations of imipenem alone killed AN4 for 12 h ahead of regrowth occur-
ring in the 0.5× imipenem MIC (Fig. 2M). In contrast to AN12, 0.5× imipenem MIC could not kill, whereas the
regrowth after 12 h was observed in the 1× imipenem MIC (Fig. 2P). All fosfomycin concentrations alone were
able to kill AN4 before regrowth appeared at 4 h (Fig. 2N). Killing and inhibition of AN12 were observed by
1× and 0.5× fosfomycin MIC, respectively, before regrowth (Fig. 2Q). AN4 and AN12 were killed by all combina-
tions, resulting in synergistic activity (Fig. 2O,R), except 0.5× imipenem with 0.5× fosfomycin MIC that regrowth
appeared in AN12 after 6 h (Fig. 2R).
MurA amino acid sequences among six ACB isolates. To understand fosfomycin resistance mecha-
nisms in ACB isolates, the amino acid sequences of the fosfomycin target, MurA, were determined and analyzed.
Amino acid sequences of the MurA among six ACB isolates are shown in Supplementary Fig. S2. All MurA
sequences were wild-type (WT) that displayed no mutation associated with fosfomycin resistance, including
Cys116, Lys22, Arg121, Arg398, Asp370, and Leu371 (arrows in Supplementary Fig. S2).
Expression of murA gene in six ACB isolates. Interestingly, no MurA mutation was found in all ACB
isolates that intermediate or resistant to fosfomycin. To determine whether MurA was associated with fosfomy-
cin resistance in ACB isolates, murA expression was evaluated in the presence of fosfomycin for 2 h. Fosfomycin
did not affect murA expression in most isolates, including A. baumannii AB250 (Fig. 3A), A10 (Fig. 3B), A. pitti
AP1 (Fig. 3C), and AP23 (Fig. 3D). Additionally, fosfomycin (0.5× MIC) had no impact on murA expression in
these isolates at 6 and 12 h after exposure (Supplementary Fig. S3A–D). However, 1× fosfomycin MIC upregu-
lated murA expression in A10 (Fig. 3B). In contrast, fosfomycin significantly downregulated murA expression
in A. nosocomialis AN2 (Fig. 3E) and AN14 (Fig. 3F). In addition, 0.5× MIC fosfomycin downregulated murA
expression after exposure for 6 and 12 h in A. nosocomialis (Supplementary Fig. S3E,F). These results indicate
that fosfomycin does not affect the de novo cell wall synthesis via MurA in A. baumannii and A. pittii isolates
but in A. nosocomialis isolates.
Overexpression of efflux pump induced by fosfomycin. Another mechanism of fosfomycin resist-
ance reported in A. baumannii is the overexpression of the efflux pump, AbaF. Firstly, the phenotype of efflux
pump overexpression was performed using CCCP. Unfortunately, all isolates showed negative phenotypes of
efflux pump overexpression (Table 2). Therefore, the level of abaF expression was determined by RT-PCR. Fos-
fomycin exhibited the downregulation of abaF in A. baumannii AB250 (Fig. 3G). Overexpression of abaF was
observed when using a low concentration of fosfomycin against A. baumannii A10 (Fig. 3H). These results
indicate that overexpression of abaF may involve fosfomycin susceptibility in a strain-specific manner in A.
baumannii.
Cell wall recycling pathway in six ACB isolates. Our results suggest other mechanisms that bypass the
MurA-dependent cell wall synthesis pathway. We screened several enzyme genes that play a role in the cell wall
recycling pathway. All A. baumannii and A. nosocomialis carried all tested genes, including ampG, nagZ, anmK,
amgK, and murU, whereas amgK did not detect in both A. pittii isolates (Table 4).
The initial step of cell wall recycling is the uptake of shedding peptidoglycan into the cytoplasm through the
AmpG transporter. Therefore, the expression level of ampG was determined in the presence of fosfomycin for
2 h. Fosfomycin dose-dependently downregulated ampG expression in A. baumannii AB250 (Fig. 4A), AP23
(Fig. 4D), A. nosocomialis AN4 (Fig. 4E), and AN12 (Fig. 4F). In contrast, fosfomycin less than the MICs signifi-
cantly upregulated ampG expression in A. baumannii A10 (Fig. 4B) and A. pittii AP1 (Fig. 4C).
Another essential protein in cell wall recycling is MurU, the last enzyme producing the cell wall precursor
that bypasses the MurA-dependent pathway. Downregulation of murU by fosfomycin was found in most ACB
isolates (Fig. 4G,I–L) except A. baumannii A10, which overexpressed murU by a low level of fosfomycin (Fig. 4H).
In summary, according to ampG and murU expression, fosfomycin did not upregulate cell wall recycling at 2 h
of exposure in ACB isolates (Fig. 4). This is in accordance with the time-kill results, which demonstrated that
no increase of bacterial cells in 2 h of fosfomycin exposure (Fig. 2). Except for AP1, fosfomycin induced ampG
expression (Fig. 4C), but downregulated murU expression (Fig. 4I). Subsequently, we focused on A. baumannii
AB250 and A10, which were non-synergistic and synergistic strains, respectively, by the combination of fosfo-
mycin and imipenem. To evaluate the difference between these isolates, the expression of the additional genes in
the cell wall recycling, including nagZ, murU, and anmK, was conducted at 4 and 12 h of exposure to fosfomycin,
the rebound in growth (regrowth) occurred (Fig. 2B,E). The different expression patterns were significantly
observed at 4 h (Fig. 5). The downward trend of expression was found in AB250, in which fosfomycin slightly
downregulated nagZ (Fig. 5A) and anmK (Fig. 5E) but remarkably reduced murU expression (Fig. 5C). Unlikely,
the upward trend of expression was present in A10, in which fosfomycin underneath the MICs significantly
increased nagZ (Fig. 5B), murU (Fig. 5D), and anmK (Fig. 5F) expression. These results suggest that the active
cell wall recycling of A10 is superior to that of AB250 in the presence of fosfomycin.
Both isolates exhibited disparate expression between 4 and 12 h. AB250 showed significant upregulation of
nagZ (Fig. 5A), murU (Fig. 5C), and anmK (Fig. 5E) in the presence of fosfomycin beneath the MICs at 12 h.
This pattern was similar to that of A10, which increased nagZ (Fig. 5B), murU (Fig. 5D), and anmK (Fig. 5F)
expression. These results indicate the elevation of cell wall recycling activity at 12 h in both isolates. Notably,
Scientific Reports | (2022) 12:230 | https://doi.org/10.1038/s41598-021-04303-7 6
Vol:.(1234567890)www.nature.com/scientificreports/
Figure 3. Relative mRNA expression of murA in six ACB isolates. RT-PCR assay of murA expression after
2 h of exposure to fosfomycin was determined in A. baumannii AB250 (A) and A10 (B), A. pittii AP1 (C) and
AP23 (D), and A. nosocomialis AN4 (E) and AN12 (F). The relative mRNA expressions at each condition (in
the presence of 0.25× MIC, 0.5× MIC, or 1× MIC of fosfomycin) were normalized to 16S rRNA expression
and compared to the mRNA expression level of each isolate in the absence of fosfomycin. The relative mRNA
expressions of abaF in A. baumannii AB250 (G) and A10 (H) at each condition (in the presence of 0.25× MIC,
0.5× MIC, or 1× MIC of fosfomycin) were normalized to 16S rRNA expression and compared to the mRNA
expression level of each isolate in the absence of fosfomycin. All experiments were performed in triplicate. Mean
values of the relative mRNA expression were plotted with error bars representing the standard error of the mean
(n = 3). The p-values were calculated using one-way ANOVA, Dunnett’s multiple comparison test (*p-value
˂0.05; **p-value < 0.01; ***p-value < 0.001 and ns, non-significant).
murU (Fig. 5C,D) and anmK (Fig. 5E,F) had either little or no expression in the presence of fosfomycin MIC,
although viable cells of both isolates were above 106 CFU/mL at 12 h (Fig. 2B,E).
To evaluate the role of imipenem combination on cell wall recycling, the expression of cell wall recycling was
determined after 12 h exposure to 0.5× fosfomycin MIC with 1× imipenem MIC, which had synergistic activity
in A10 (Fig. 2F) but not in AB250 (Fig. 2C), compare to either fosfomycin or imipenem alone. Imipenem in
the combination did not affect murA expression in AB250 (Fig. 6A) but downregulated in A10 (Fig. 6B). The
transporter gene, ampG, was upregulated in the imipenem combination in AB250 (Fig. 6C) but had no effect
in A10 (Fig. 6D). In AB250, although imipenem combination induced murU expression, its expression level
was slightly lower than that in the absence of imipenem (Fig. 6E). In contrast, the combination reduced murU
expression in A10 nearly to that in the absence of any antibiotic (Fig. 6F). Interestingly, imipenem combination
Scientific Reports | (2022) 12:230 | https://doi.org/10.1038/s41598-021-04303-7 7
Vol.:(0123456789)www.nature.com/scientificreports/
Cell wall recycling gene
ACB species Isolate murA ampG nagZ anmK amgK murU
A. baumannii AB250 + + + + + +
A. baumannii A10 + + + + + +
A. pittii AP1 + + + + − +
A. pittii AP23 + + + + − +
A. nosocomialis AN4 + + + + + +
A. nosocomialis AN12 + + + + + +
Table 4. The presence of cell wall recycling enzyme genes in six ACB isolates. (+) presence of gene, (−)
absence of gene.
significantly downregulated nagZ (Fig. 6H), anmK (Fig. 6J), and amgK (Fig. 6L) in A10 compared to control and
either single fosfomycin or imipenem. However, the combination showed a few effects on these gene expres-
sions in A250 (Fig. 6G,I,K). These results indicate that imipenem may affect at least in part of cell wall recycling
resulting in synergism with fosfomycin.
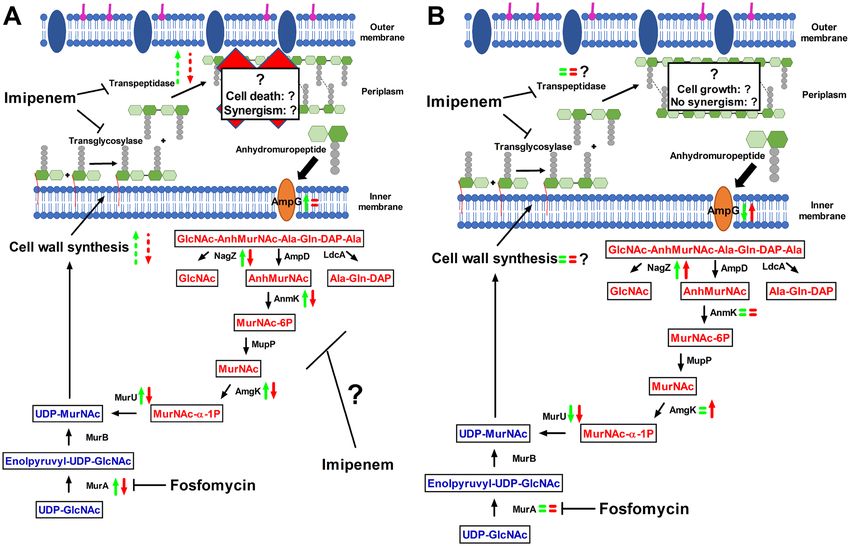
The summary of cell wall recycling and the proposed synergistic mechanism of fosfomycin and imipenem in
AB250 and A10 are present in Fig. 7. Imipenem synergistically reduced the expression of cell wall recycling in
A10 (red symbols in Fig. 7A), indicating dwindling cell wall synthesis that may result in cell death. Differently,
imipenem showed a minor effect on the alteration of cell wall recycling (red symbols in Fig. 7B), indicating a
sluggish but functional and adequate cell wall synthesis that may result in cell growth.
PAP assay. In addition to antibiotic resistance mechanisms, the population phenotypes of all ACB isolates
were evaluated. The phenotypes of populations were determined by using the PAP study, which displayed the
frequency of bacteria growing on agar supplemented with various concentrations of tested antibiotics, which
calculated by using Eq. (2). The positive of heteroresistant subpopulation was defined as the presence of bacterial
frequency that grows above 10–7 on the agar supplemented with eightfold above the antibiotic concentration of
the main population. For imipenem, AB250 exhibited the heteroresistant subpopulation in which the frequency
of bacteria was above 1 0–7 at eightfold above the antibiotic concentration of the main population (32 mg/L)
(Fig. 8A). This phenotype was called resistant with heteroresistant subpopulation to imipenem (Fig. 8A). In
the case of A10, the frequency of the growth at eightfold above the resistance level of the main population to
imipenem (512 mg/L) was less than 10–7, indicating no heteroresistant subpopulation (Fig. 8B). Therefore, A10
was resistant without heteroresistant subpopulation to imipenem (Fig. 8B). No heteroresistant subpopulation
to imipenem was also observed in A. pittii AP1 (Supplementary Fig. S4A), AP23 (Supplementary Fig. S4B), A.
nosocomialis AN4 (Supplementary Fig. S4C), and AN12 (Supplementary Fig. S4D).
For fosfomycin, all isolates exhibited the resistant frequency upper the cut-off point ( 10–7) at eightfold above
the antibiotic concentration of the main population of each isolate (Fig. 8C,D, Supplementary Fig. S4E–H).
Therefore, all ACB isolates were resistant with heteroresistant subpopulations to fosfomycin. In summary, among
all isolates, A. baumannii AB250 was the only isolate that imipenem and fosfomycin combination had no syn-
ergistic activity and was resistant with heteroresistant subpopulation to imipenem. These results may indicate
the feasible association between synergism and the heteroresistant subpopulation. However, further study is
required to understand the impact of heteroresistance in antibiotic synergism.
Discussion
ACB complex, generally considered saprophytes, has been regarded as a critical multidrug-resistant nosocomial
pathogen in clinical settings within the last two decades18. Although A. pittii and A. nosocomialis are lower grade
pathogens than A. baumannii, their abilities to resistant to antibiotics, particularly carbapenems, have been
reported17,19,20. Moreover, the emergence of colistin-resistant ACB is rising worldwide21; fortunately, no colistin-
resistant isolate was observed in our study. A couple of A. baumannii and A. pittii in our study belonged to new
STs submitted to the PubMLST22, indicating unique clones emerging in our hospital. Carbapenem-resistant A.
nosocomialis belonged to ST958 which is similar to carbapenem-resistant A. baumannii isolated from a patient in
Uruguay, indicating a close relation among the ACB c omplex23. The vast majority of ACB complex produce class
D carbapenemases, including OXA-23, OXA-24, OXA-58, and OXA-51. The latter is an intrinsic carbapenemase
in A. baumannii; however, OXA-51-type carbapenemase is transferred to non-baumannii Acinetobacter via hori-
lasmid24. Reduction of 33–36 kDa OMP and CarO was found in A. pittii AP23 and
zontal transfers particularly, p
A. nosocomialis AN4, respectively, whereas the loss of OprD is reported in A. nosocomialis isolated from Taiwan,
and no reduction of OMP is found in non-baumannii Acinetobacter isolated from South K orea25,26. Interestingly,
not only involved in antibiotic resistance, but these porins also act as virulence f actors27. Moreover, we found
overexpression of adeB and adeE in A. baumannii and A. pittii, respectively. A report from Taiwan revealed that
carbapenem-resistant A. nosocomialis exhibited overexpression of adeB, leading to tigecycline resistance28. A.
baumannii may act as the coach supporting antibiotic resistance determinants and virulence machines to other
species in the ACB complex. Not surprisingly, non-baumannii Acinetobacter is turning into a potential pathogen.
Due to the limitation of antibiotic usage for carbapenem-resistant ACB, many studies focused on antibiotic
combinations, most of which were colistin-based combinations such as imipenem or meropenem plus colistin
Scientific Reports | (2022) 12:230 | https://doi.org/10.1038/s41598-021-04303-7 8
Vol:.(1234567890)www.nature.com/scientificreports/
Figure 4. Relative mRNA expression of ampG in the presence of fosfomycin was determined by RT-PCR assay in A. baumannii
AB250 (A) and A10 (B), A. pittii AP1 (C) and AP23 (D), and A. nosocomialis AN4 (E) and AN12 (F). Relative mRNA expression of
murU in the presence of fosfomycin was determined by RT-PCR assay in A. baumannii AB250 (G) and A10 (H), A. pittii AP1 (I) and
AP23 (J), and A. nosocomialis AN4 (K) and AN12 (L). The relative mRNA expressions at each condition (in the presence of 0.25× MIC,
0.5× MIC, or 1× MIC of fosfomycin) were normalized to 16S rRNA expression and compared to the mRNA expression level of each
isolate in the absence of fosfomycin. All experiments were performed in triplicate. Mean values of the relative mRNA expression were
plotted with error bars representing the standard error of the mean (n = 3). The p-values were calculated using one-way ANOVA,
Dunnett’s multiple comparison test (*p-value ˂0.05; **p-value < 0.01; ***p-value < 0.001 and ns, non-significant).
Scientific Reports | (2022) 12:230 | https://doi.org/10.1038/s41598-021-04303-7 9
Vol.:(0123456789)www.nature.com/scientificreports/
Figure 5. Relative mRNA expression of nagZ, murU, and anmK in the presence of fosfomycin for 4 and 12 h
determined by RT-PCR assay in A. baumannii AB250 (A,C,E) and A10 (B,D,F). The relative mRNA expressions
at each condition (in the presence of 0.25× MIC, 0.5× MIC, or 1× MIC of fosfomycin) were normalized to 16S
rRNA expression and compared to the mRNA expression level of each isolate in the absence of fosfomycin. All
experiments were performed in triplicate. Mean values of the relative mRNA expression were plotted with error
bars representing the standard error of the mean (n = 3). The p-values were calculated using one-way ANOVA,
Dunnett’s multiple comparison test (*p-value ˂0.05; **p-value < 0.01; ***p-value < 0.001 and ns, non-significant).
Scientific Reports | (2022) 12:230 | https://doi.org/10.1038/s41598-021-04303-7 10
Vol:.(1234567890)www.nature.com/scientificreports/
Figure 6. Relative mRNA expression of murA (A,B), ampG (C,D), murU (E,F), nagZ (G,H), anmK (I,J),
and amgK (K,L) in the absence of antibiotic, the presence of 0.5× fosfomycin MIC, and the combination of
0.5× fosfomycin MIC with 1× imipenem MIC for 12 h determined by RT-PCR assay. The relative mRNA
expressions at each condition were normalized to 16S rRNA expression and compared to the mRNA expression
level of each isolate in the absence of antibiotic. All experiments were performed in triplicate. Mean values of
the relative mRNA expression were plotted with error bars representing the standard error of the mean (n = 3).
The p-values were calculated using one-way ANOVA, Dunnett’s multiple comparison test (*p-value ˂0.05;
**p-value < 0.01; ***p-value < 0.001 and ns, non-significant).
and sulbactam plus colistin29–31. Interestingly, sulbactam is a beta-lactamase inhibitor, not an antibiotic, showed
synergism with colistin against carbapenem-resistant ACB29. A report revealed that sulbactam inhibits penicillin-
binding proteins (PBPs), including PBP1 and PBP332. Another non-traditional antibiotic being effective in the
combinations is fosfomycin. Fosfomycin displayed synergism with sulbactam and colistin against carbapenem-
resistant A. baumannii33,34. Moreover, the synergy of fosfomycin in the combination with imipenem was revealed
in our previous s tudy16. Therefore, we determined the in vitro activity of fosfomycin plus imipenem and other
combinations and characterized the resistance mechanisms to unveil the plausible synergistic mechanism. Apart
from A. baumannii, the synergistic activity was also found against A. pittii and A. nosocomialis. This study dem-
onstrates that imipenem with fosfomycin could be used for combating carbapenem-resistant ACB complex.
However, the effectiveness of the combination should be clinically evaluated further.
Fosfomycin inhibits peptidoglycan synthesis by covalently binding to MurA (Fig. 7). Generally, fosfomycin
is recommended for UTIs caused by certain Enterobacteriaceae, notably E. coli10. Nevertheless, E. coli is resist-
ant to fosfomycin by various mechanisms. Firstly, the alteration of drug target, MurA, generally occurs at the
active site, Cys115, and the ligand-binding site, including Lys22, Arg120, and Arg397 (Supplementary Fig. S2)35.
This mechanism has never been found in A. baumannii, so MurA has been inspired to be a new t arget36. Unfor-
tunately, A. baumannii normally has a high level of fosfomycin susceptibility with WT MurA, suggesting the
intrinsic resistance by the MurA-independent p athway37. The second mechanism is the mutations of fosfomycin
transporters (GlpT and UhpT), leading to decreased uptake of fosfomycin, but this mechanism has not been
revealed in A. baumannii37. Thirdly, the production of fosfomycin-modifying enzymes (such as FosA, FosB,
FosC, and FosX) is the most frequently found mechanism in both Gram-negative and Gram-positive bacteria37.
fosA has been deposited on 2% and 7.8% of the A. baumannii and A. pittii genomes, respectively, demonstrating
that FosA production is not an intrinsic resistance mechanism in A CB38. Another mechanism reported in A.
Scientific Reports | (2022) 12:230 | https://doi.org/10.1038/s41598-021-04303-7 11
Vol.:(0123456789)www.nature.com/scientificreports/
Figure 7. Summary of cell wall recycling gene expression and proposed mechanism of synergistic mechanism
of imipenem and fosfomycin combination in A. baumannii A10 (A) and AB250 (B). The cell wall recycling
expressions in Fig. 6 were summarized in this scheme. Green and red symbols are represented the gene
expression in the presence of 0.5× fosfomycin MIC and in the combination of 0.5× fosfomycin MIC and
1× imipenem MIC, respectively. Upward arrows, downward arrows, and equal arrows are represented
upregulation, downregulation, and not change of expression compared to without antibiotic, respectively.
Question marks and dash arrows are represented the proposed results that did not determined. Red words in
the boxes are represented metabolites in the cell wall recycling pathway. Blue words in the boxes are represented
metabolites in the de novo cell wall synthesis.
baumannii, is the efflux transporter, AbaF13. The deletion of abaF confers the reduction of eightfold fosfomycin
MIC in A. baumannii13. In our study, both A. baumannii had nearly equal fosfomycin MICs, but overexpression
of abaF was found in one isolate, indicating a minor role of the AbaF. An additional mechanism being debate is
the cell wall recycling pathway that bypasses the de novo synthesis via MurA (Fig. 7)14. The cell wall recycling
pathway has been well characterized in E. coli, but it differs from that of other Gram-negative bacteria, including
A. baumannii that is the MurA-bypass pathway15,39,40.
Although fosfomycin induces overexpression of murA in E. coli41, most ACB isolates, whose MurA exhibited
wild-type enzymes that susceptible to fosfomycin, were not induced murA expression by fosfomycin except at a
high concentration (1× MIC) in A10 (Fig. 3B). These results with the presence of genes encoding cell wall recy-
cling enzymes strongly suggest the cell wall recycling pathway that is a MurA-independent pathway in the ACB
complex. In spite the fact that AmpG transporter upregulates at a high level of substrates, indicating an active
turnover of the cell wall42, most ACB isolates were no change or downregulation of ampG together with murU
after 2 h treated by fosfomycin, except the low fosfomycin concentration in A10 (Fig. 4B) and AP1 (Fig. 4C).
Downregulations of these genes indicate the downward trend of cell wall syntheses that are related to inhibition
of cell growth in the time-kill curves (Fig. 2).
According to the time-kill curves with fosfomycin, the log phase of growth shifted to 4–12 h instead of 2–4 h.
Therefore, the cell wall expression in A. baumannii AB250 (no synergistic strain) and A10 (synergistic strain)
were focused at 4 and 12 h. Downward expression of the recycling was found in non-synergistic strain, whereas
the upward trend was observed in synergistic strain, indicating the more active recycling in the synergistic strain.
However, both strains exhibited upregulation of the recycling in 12 h compared to that of 4 h. Unexpectedly
in both isolates, fosfomycin equal to the MICs barely induced murU expression (Fig. 5C,D), but the viability
of growth did not affect (Fig. 5B,E), possibly due to achieving the steady-state of the recycling at that time. In
addition to being the last enzyme in the cell wall recycling, MurU is believed that plays an important role in the
preservation of a steady-state of a MurNAc pool and the suppression of an anhMurNAc pool43. According to
these hypotheses, the bacterial growth with shutting down of murU at 12 h exposure to fosfomycin is probably
Scientific Reports | (2022) 12:230 | https://doi.org/10.1038/s41598-021-04303-7 12
Vol:.(1234567890)www.nature.com/scientificreports/
Figure 8. PAP of imipenem and fosfomycin in A. baumannii AB250 (A,C) and A10 (B,D). The frequency of
antibiotic-resistant bacteria was the relative of viable cells at each antibiotic concentration normalized to those
at the absence of antibiotic. All experiments were performed in triplicate. Mean values of the frequency of
antibiotic-resistant bacteria were plotted with error bars representing the standard error of the mean (n = 3). The
“resistant with heteroresistant subpopulation” was defined as that the frequency of antibiotic-resistant bacteria
at eightfold above the resistance level of the main population (dash lines) was higher than 1 0–7. *: antibiotic
concentration (the resistance level) of the main population, **: eightfold above antibiotic concentration (the
resistance level) of the main population.
caused by the excess of cell wall materials. It is the limitation of our study that the bacterial metabolites were
not determined.
In combination of 0.5× fosfomycin with 1× imipenem that did not affect bacterial growth (Fig. 2A–F), imi-
penem showed a tiny role on the recycling expression in non-synergistic strain, indicating an inert response of
AB250. In contrast, the significant downregulation of the recycling was observed in synergistic strain, suggesting
enhance effect of imipenem in perturbation of the recycling of A10. Therefore, imipenem may be synergistic
with fosfomycin at least in part downregulation of the cell wall recycling.
The targets of imipenem are PBPs, not the cell wall recycling, thus imipenem indirectly plays a role on the
recycling. The cell wall synthesis is composed of the precursor production (the de novo or recycling bypath)
and peptidoglycan crosslinking (by the PBPs). Both processes are inevitably related and sophisticated. Many
studies are supporting the hypothesis that imipenem not only inhibits PBPs, but also interrupts other cellular
metabolisms44,45. For instance, mecillinam, whose targets are PBPs, simultaneously blocks the PBPs and enhances
a cycle of cell wall synthesis and turnover via the Rod system, resulting in depleting PG precursor pools in E.
coli. Similar to a report in A. baumannii46, imipenem affects not only PBP2 and PBP1a, but also perturbs the Rod
Scientific Reports | (2022) 12:230 | https://doi.org/10.1038/s41598-021-04303-7 13
Vol.:(0123456789)www.nature.com/scientificreports/
system. Therefore, imipenem in combination with fosfomycin may complicatedly disturb cell wall metabolism,
at least in some parts, resulting in decreasing of cell wall recycling.
An additional factor that may additionally affect the activity of antibiotic combination, is heteroresistance.
The heteroresistance is a phenotype of a subpopulation that displays a greater potency of antibiotic resistance
than that in the main population. The higher-level resistance in the heteroresistance is caused by the mutation
of antibiotic resistance d eterminants47. Therefore, the ACB isolates may differently express the cell wall recycling
to generate the fosfomycin heteroresistance. Furthermore, the bacterial regrowth in the time-kill curves may
be the growth of fosfomycin and imipenem heteroresistance subpopulations. However, regrowth may be due to
loss of antibiotic stability. Imipenem has a half-life of 0.7 h in serum in vitro48, whereas fosfomycin has a half-life
of 5.7 h in p lasma9. There are various methods for the detection of the heteroresistant subpopulation. The gold
standard method is the PAP a ssay49. In this study, the PAP assay was used with the addition of the frequency
of heteroresistant subpopulations as recommended by Andersson et al.47. Among six ACB isolates, only A.
baumannii AB250, non-synergistic strain, exhibited heteroresistant to imipenem (Fig. 8A), whereas all isolates
had heteroresistant subpopulations to fosfomycin (Fig. 8C,D, Supplementary Fig. S3E–H). Notably, all isolates
resistant with heteroresistant subpopulations to fosfomycin showed similar patterns of the time-kill curves that
regrowth occurred after 4 h, possibly due to subpopulation change. However, all ACB isolates exhibited unstable
heteroresistance phenotypes in which subcultures with antibiotic-free media (> 50 generations)47,50 showed the
loss of heteroresistance (Supplementary Table S3). Therefore, the unstable heteroresistance may lead to failure
treatment by combination therapy and is difficult to detect by the routine method.
In summary, although, most ACB isolates possessed cell wall recycling pathway, their response to fosfomycin
were quite difference, indicating strain-specific responses. The synergistic strain (A10) exhibited more active of
the cell wall recycling than no synergistic strain (AB250). Imipenem, in the combination, significantly down-
regulated the cell wall recycling in the synergistic strain, indicating the additional action apart from inhibition
of PBPs. Therefore, the feasible synergistic mechanism of imipenem and fosfomycin was an unexpected function
of imipenem that affects at least in part of cell wall recycling resulting in synergism via downregulation of cell
wall recycling concurrently without heteroresistance subpopulation. Nevertheless, the role of heteroresistance in
the synergism of imipenem and fosfomycin is still unclear and needs further investigation. Moreover, both cell
wall metabolism and bacterial response to antibiotics are dynamic and sophisticated. Therefore, the comparative
metabolic perturbations of these strains should be further investigated to unveil the synergistic mechanism of
imipenem and fosfomycin. This study demonstrates the in vitro synergism of imipenem with fosfomycin against
carbapenem-resistant ACB complex.
Methods
Bacterial strains and antibiotic susceptibility testing. Two A. baumannii isolates (AB250 and A10),
two A. pittii isolates (AP1 and AP23), and two A. nosocomialis isolates (AN4 and AN12) from our previous
study were clinical strains that were isolated from an individual patient at the King Chulalongkorn Memo-
rial Hospital, Bangkok, Thailand16,17. All strains were routinely tested for antibiotic susceptibility according to
CLSI recommendation51. Susceptibility of imipenem (Apollo Scientific), meropenem (Sigma-Aldrich), amikacin
(Sigma-Aldrich), and colistin (Sigma-Aldrich) was performed by broth microdilution method using cation-
adjust Mueller–Hinton broth (CAMHB) (Becton Dickenson BBL) whereas that of fosfomycin was performed by
agar dilution method using Mueller–Hinton agar (MHA) (Becton Dickenson BBL) supplemented with 25 mg/L
of glucose-6-phosphate (G6P) (Sigma-Aldrich). Bacterial reference strains were E. coli ATCC 25922 and P. aer-
uginosa ATCC 27853. The antibiotic susceptibility was interpreted according to the CLSI g uideline51 (Supple-
mentary Table S1).
Moreover, phenotype of overexpression of efflux pump against imipenem, meropenem, and fosfomycin was
performed by agar dilution method compared with the addition of carbonyl cyanide m-chlorophenyl hydra-
zone (CCCP) (Sigma-Aldrich), a proton coupler interrupting efflux pump function. The positive phenotype of
overexpression of efflux pump was defined as at least fourfold decreased of antibiotic MIC (minimum inhibitory
concentration) observed in the presence of CCCP.
MLST. The clonal relationship among all six ACB isolates was studied by MLST as recommendation of
the PubMLST22. Briefly, the partial fragments of seven housekeeping genes, including gltA, gyrB, gdhB, recA,
cpn60, gpi, and rpoD, were amplified from extracted genomic DNA by PCR using primer recommended by the
PubMLST22. The PCR products were sequenced. We performed and analyzed the MLST profiles according to
the MLST Oxford scheme. The allelic numbers of each gene and the sequence type (ST) numbers were obtained
from the PubMLST.
OMP study. OMPs of all isolates were separated by using ultracentrifugation method as our previous study16.
Briefly, the mid-log phase bacterial cells were broken by sonication and the membrane fractions were collected
by ultracentrifugation at 100,000g for 1 h at 4 °C (Beckman-Coulter). OMPs were extracted by using 2% sodium
N-lauryl sarconate (Merck Millipore) and collected by ultracentrifugation again at 100,000g for 1 h at 4 °C. The
OMPs were resuspended with phosphate buffer saline (Sigma Aldrich) and were quantified the concentration
by using Bio-Rad protein assay (Bio-Rad). The OMP profiles were studied by SDS-PAGE. The concentration of
OMPs loaded in each well was 10 µg. The gels were stained with coomassie brilliant blue, dried on cellophane
sheets, and captured by using an image scanner. The density of each protein band was determined by using
ImageJ. The relative density of each protein was calculated and compared to that of control protein, OmpA, in
the same bacterial isolate.
Scientific Reports | (2022) 12:230 | https://doi.org/10.1038/s41598-021-04303-7 14
Vol:.(1234567890)www.nature.com/scientificreports/
Detection of antibiotic resistance genes, efflux pump genes, and cell wall recycling
genes. Antibiotic resistance genes (including blaOXA-51, blaOXA-24, blaOXA-23, and blaIMP), efflux pump genes
(including adeB, adeE, adeY, and abaF) and cell wall recycling genes (including murA, ampG, nagZ, anmK,
amgK, and murU) were detected by PCR. The primers used in this study are shown in Supplementary Table S4.
Expression level of efflux pump genes and cell wall recycling genes. The expression level of
efflux pump genes (including adeB, adeE, adeY and abaF) and cell wall recycling genes (including murA, ampG,
nagZ, anmK, amgK, and murU) was performed by RT-PCR. The total RNA of the ACB isolates was extracted
by using Trizol reagent (Invitrogen) and converted to cDNA by using RevertAid First Strand cDNA Synthesis
Kit (Thermo Scientific). The relative expression of each gene was normalized with 16S rRNA expression. This
experiment was performed in triplicate. The primers used in this study are shown in Supplementary Table S4.
Checkerboard assay. In vitro activity of carbapenem (imipenem and meropenem) in combination with
either amikacin, fosfomycin, or colistin against all six ACB isolates was performed by checkerboard assay as our
previous study16. Briefly, the checkerboard assay was conducted in 96-well microtiter plates in which the rows
contained CAMHB supplemented with serial dilution of one antibiotic and the columns contained CAMHB
supplemented with serial dilution of another antibiotic. The plates were inoculated with the ACB isolates and
incubated at 37 °C for 18–24 h. The MICs of each antibiotic in alone and the combination were read by naked
eyes. The FIC (fractional inhibitory concentration) index was calculated using the following equation:
MIC of drug A in combination MIC of drug B in combination
FICI = + (1)
MIC of drug A alone MIC of drug B alone
The results were interpreted as following: synergism as FICI ≤ 0.5, no interaction as 0.5 < FICI ≤ 4, and antago-
nism as FICI > 4.
Time‑killing assay. Synergism of the most effective combination, imipenem with fosfomycin, was con-
firmed by time-killing assay as our previous study16. The concentrations of 1× MIC and 0.5× MIC of imipenem
and fosfomycin were tested as a single agent and in combination. The flask contained CAMHB supplemented
with each concentration of single imipenem or fosfomycin or the combinations was inoculated with 106 CFU/
mL of ACB isolates. Nine conditions of antibiotic were tested, including growth control (no antibiotic), 0.5× imi-
penem MIC, 1× imipenem MIC, 0.5× fosfomycin MIC, 1× fosfomycin MIC, 0.5× imipenem + 0.5× fosfomycin
MIC, 0.5× imipenem MIC + 1× fosfomycin MIC, 1× imipenem MIC + 0.5× fosfomycin MIC, and 1× imipenem
MIC + 1× fosfomycin MIC. The flasks contained fosfomycin were supplemented with 25 mg/L of G6P. All flasks
were incubated at 37 °C for 24 h with shaking at 120 rpm. The viable cells at 0, 2, 4, 6, 12, and 24 h after incuba-
tion were counted and plotted. The synergism was defined as at least 2log decreased of viable cells compared
to the most active single agent after 24 h of incubation. The bactericidal activity was defined as at least 3log
decreased of viable cells compared to the viable cells of initial inoculation. This experiment was performed in
triplicate.
Population analysis profile (PAP) assay. The characteristics of ACB population that composed of either
homogeneous or heterogeneous populations were determined by PAP a ssay47. Briefly, overnight culture of bacte-
rial strains was serially diluted and plated on MHA agar containing different antibiotic concentrations (at 0, 4,
8, 16, 32, 64, 128, 256, 512, and 1024 mg/L of imipenem and at 0, 16, 32, 64, 128, 256, 512, 1024, and 2048 mg/L
of fosfomycin supplemented with 25 mg/L of G6P). After 24 h of incubation, the viable cells on each plate were
counted. The frequency of resistant cells was calculated using the following equation:
Viable cells on MHA with each antibiotic (CFU/mL)
Frequency of resistant cells = (2)
Viable cells on MHA without antibiotic (CFU/mL)
The PAP assay was performed in triplicate. Mean values of the frequency of resistant cell were plotted with
the standard errors of the means represented by error bars. The heteroresistant subpopulation was defined as
the frequency of resistant cells ≥ 10–7 at eightfold above the antibiotic concentration of the main population. The
resistant phenotype without subpopulation was defined as the frequency of resistant cellswww.nature.com/scientificreports/
**, p-value < 0.01; ***, p-value < 0.001 and ns, non-significant). The mRNA expression of cell wall recycling genes
and abaF after treatment with fosfomycin were performed in triplicated. Mean values of the relative expression
were plotted with error bars representing the standard error of the mean (n = 3). The expressions after fosfomy-
cin treatment were compared to these of no treatment. The expressions after fosfomycin treatment for 4 h were
compared to these of the treatment for 12 h. The p-values were calculated using the one-way ANOVA, Dunnett’s
multiple comparison test (*, p-value ˂0.05; **, p-value < 0.01; ***, p-value < 0.001 and ns, non-significant).
Data availability
All data generated or analyzed during this study are included in this published article and its supplementary
information files.
Received: 14 July 2021; Accepted: 10 December 2021
References
1. Harding, C. M., Hennon, S. W. & Feldman, M. F. Uncovering the mechanisms of Acinetobacter baumannii virulence. Nat. Rev.
Microbiol. 16, 91–102. https://doi.org/10.1038/nrmicro.2017.148 (2018).
2. Ayoub Moubareck, C. & Hammoudi Halat, D. Insights into Acinetobacter baumannii: A review of microbiological, virulence, and
resistance traits in a threatening nosocomial pathogen. Antibiotics 9, 119. https://doi.org/10.3390/antibiotics9030119 (2020).
3. Papp-Wallace, K. M., Endimiani, A., Taracila, M. A. & Bonomo, R. A. Carbapenems: Past, present, and future. Antimicrob. Agents
Chemother. 55, 4943–4960. https://doi.org/10.1128/AAC.00296-11 (2011).
4. Hammoudi Halat, D. & Ayoub Moubareck, C. The current burden of carbapenemases: Review of significant properties and dis-
semination among gram-negative bacteria. Antibiotics 9, 186. https://doi.org/10.3390/antibiotics9040186 (2020).
5. Coyne, S., Courvalin, P. & Perichon, B. Efflux-mediated antibiotic resistance in Acinetobacter spp. Antimicrob. Agents Chemother.
55, 947–953. https://doi.org/10.1128/AAC.01388-10 (2011).
6. Vila, J., Marti, S. & Sanchez-Cespedes, J. Porins, efflux pumps and multidrug resistance in Acinetobacter baumannii. J. Antimicrob.
Chemother. 59, 1210–1215. https://doi.org/10.1093/jac/dkl509 (2007).
7. Viehman, J. A., Nguyen, M. H. & Doi, Y. Treatment options for carbapenem-resistant and extensively drug-resistant Acinetobacter
baumannii infections. Drugs 74, 1315–1333. https://doi.org/10.1007/s40265-014-0267-8 (2014).
8. Doi, Y. Treatment options for carbapenem-resistant gram-negative bacterial infections. Clin. Infect. Dis. 69, S565–S575. https://
doi.org/10.1093/cid/ciz830 (2019).
9. Falagas, M. E., Vouloumanoua, E. K., Samonisd, G. & Vardakas, K. Z. Fosfomycin. Clin. Microbiol. Rev. 29, 321–347. https://doi.
org/10.1128/CMR.00068-15 (2016).
10. Derington, C. G., Benavides, N., Delate, T. & Fish, D. N. Multiple-dose oral fosfomycin for treatment of complicated urinary tract
infections in the outpatient setting. Open Forum Infect. Dis. 7, ofaa034. https://doi.org/10.1093/ofid/ofaa034 (2020).
11. Sirijatuphat, R. & Thamlikitkul, V. Preliminary study of colistin versus colistin plus fosfomycin for treatment of carbapenem-
resistant Acinetobacter baumannii infections. Antimicrob. Agents Chemother. 58, 5598–5601. https://d oi.o
rg/1 0.1 128/A AC.0 2435-1 3
(2014).
12. Albiero, J. et al. Pharmacodynamic attainment of the synergism of meropenem and fosfomycin combination against Pseudomonas
aeruginosa producing metallo-beta-lactamase. Antimicrob Agents Chemother. 63, e00126-19. https://doi.org/10.1128/AAC.00126-
19 (2019).
13. Sharma, A., Sharma, R., Bhattacharyya, T., Bhando, T. & Pathania, R. Fosfomycin resistance in Acinetobacter baumannii is medi-
ated by efflux through a major facilitator superfamily (MFS) transporter-AbaF. J. Antimicrob. Chemother. 72, 68–74. https://doi.
org/10.1093/jac/dkw382 (2017).
14. Gil-Marques, M. L. et al. Peptidoglycan recycling contributes to intrinsic resistance to fosfomycin in Acinetobacter baumannii. J.
Antimicrob. Chemother. 73, 2960–2968. https://doi.org/10.1093/jac/dky289 (2018).
15. Borisova, M., Gisin, J. & Mayer, C. Blocking peptidoglycan recycling in Pseudomonas aeruginosa attenuates intrinsic resistance to
fosfomycin. Microb. Drug Resist. 20, 231–237. https://doi.org/10.1089/mdr.2014.0036 (2014).
16. Singkham-In, U. & Chatsuwan, T. In vitro activities of carbapenems in combination with amikacin, colistin, or fosfomycin against
carbapenem-resistant Acinetobacter baumannii clinical isolates. Diagn. Microbiol. Infect. Dis. 91, 169–174. https://d oi.o rg/1 0.1 016/j.
diagmicrobio.2018.01.008 (2018).
17. Singkham-In, U. & Chatsuwan, T. Mechanisms of carbapenem resistance in Acinetobacter pittii and Acinetobacter nosocomialis
isolates from Thailand. J. Med. Microbiol. 67, 1667–1672. https://doi.org/10.1099/jmm.0.000845 (2018).
18. Camp, C. & Tatum, O. A review of Acinetobacter baumannii as a highly successful pathogen in times of war. Lab. Med. 41, 649–657.
https://doi.org/10.1309/LM90IJNDDDWRI3RE (2010).
19. Chusri, S. et al. Clinical outcomes of hospital-acquired infection with Acinetobacter nosocomialis and Acinetobacter pittii. Antimi-
crob. Agents Chemother. 58, 4172–4179. https://doi.org/10.1128/AAC.02992-14 (2014).
20. Chen, F. J. et al. Molecular epidemiology of emerging carbapenem resistance in Acinetobacter nosocomialis and Acinetobacter pittii
in Taiwan, 2010 to 2014. Antimicrob. Agents Chemother. 63, e02007-18. https://doi.org/10.1128/AAC.02007-18 (2019).
21. Qureshi, Z. A. et al. Colistin-resistant Acinetobacter baumannii: Beyond carbapenem resistance. Clin. Infect. Dis. 60, 1295–1303.
https://doi.org/10.1093/cid/civ048 (2015).
22. Jolley, K. A., Bray, J. E. & Maiden, M. C. J. Open-access bacterial population genomics: BIGSdb software, the PubMLST.org website
and their applications. Wellcome Open Res. 3, 124. https://doi.org/10.12688/wellcomeopenres.14826.1 (2018).
23. Bado, I. et al. Molecular characterization of carbapenem-resistant Acinetobacter baumannii in the Intensive Care Unit of Uruguay’s
University Hospital Identifies the first rmtC gene in the species. Microb. Drug Resist 24, 1012–1019. https://doi.org/10.1089/mdr.
2017.0300 (2018).
24. Lee, Y. T. et al. Emergence of carbapenem-resistant non-baumannii species of Acinetobacter harboring a blaOXA-51-like gene that
is intrinsic to A. baumannii. Antimicrob. Agents Chemother. 56, 1124–1127. https://doi.org/10.1128/AAC.00622-11 (2012).
25. Lin, Y. C. et al. Differences in carbapenem resistance genes among Acinetobacter baumannii, Acinetobacter genospecies 3 and
Acinetobacter genospecies 13TU in Taiwan. Int. J. Antimicrob. Agents 35, 439–443. https://doi.org/10.1016/j.ijantimicag.2009.11.
020 (2010).
26. Park, Y. K., Jung, S. I., Park, K. H., Kim, S. H. & Ko, K. S. Characteristics of carbapenem-resistant Acinetobacter spp. other than
Acinetobacter baumannii in South Korea. Int. J. Antimicrob. Agents 39, 81–85. https://doi.org/10.1016/j.ijantimicag.2011.08.006
(2012).
27. Uppalapati, S. R., Sett, A. & Pathania, R. The outer membrane proteins OmpA, CarO, and OprD of Acinetobacter baumannii confer
a two-pronged defense in facilitating its success as a potent human pathogen. Front. Microbiol. 11, 589234. https://d oi.o rg/1 0.3 389/
fmicb.2020.589234 (2020).
Scientific Reports | (2022) 12:230 | https://doi.org/10.1038/s41598-021-04303-7 16
Vol:.(1234567890)You can also read