Sydney Airport Half Year Results 2014 - 21 August 2014 - Contentful
←
→
Page content transcription
If your browser does not render page correctly, please read the page content below
Sydney Airport
Half Year Results 2014

21 August 2014
Disclaimer

This presentation has been prepared by Sydney Airport Limited (ACN 165 056 360) (“SAL”) in respect of ASX-listed Sydney Airport (“SYD”).
SYD is comprised of the stapled entities SAL and Sydney Airport Trust 1 (ARSN 099 597 921) (“SAT1”). The Trust Company (Sydney Airport)
Limited (ACN 115 967 087/ASFL 301162) (“TTCSAL”) is the responsible entity of SAT1.

This presentation is not an offer or invitation for subscription or purchase of or a recommendation of securities. It does not take into account the
investment objectives, financial situation and particular needs of the investor. Before making an investment in SYD, the investor or prospective
investor should consider whether such an investment is appropriate to their particular investment needs, objectives and financial circumstances
and consult an investment adviser if necessary.

Information, including forecast financial information, in this presentation should not be considered as a recommendation in relation to holding,
purchasing or selling shares, securities or other instruments in SYD or any other entity. Due care and attention has been used in the preparation
of forecast information. However, actual results may vary from forecasts and any variation may be materially positive or negative. Forecasts by
their very nature are subject to uncertainty and contingencies, many of which are outside the control of SAL and TTCSAL. Past performance is
not a reliable indication of future performance.

Sydney Airport advises that on 6 August 2014 its foreign ownership was 35.7%.

                                                                                                                                                   2
Agenda

01. Highlights and performance

02. Financial results

03. Traffic and capacity development

04. Commercial business update

05. Improving the passenger experience

      Second Sydney airport update and
06.
      outlook

07. Questions
Half year 2014 highlights

Half year 2014, continued growth and momentum, delivering yield expansion and revenue
growth

Highlights

•   Continued strong revenue growth across all businesses

•   6.1% EBITDA growth on 2.3% total passenger growth and 4.7% international passenger growth,
    above long term trend

•   $95.5 million of capital invested in capacity expansions and business improvements to
    accommodate ongoing growth

•   New international low cost carrier, Cebu Pacific, announcement of debut services to Sydney
    commencing in September

•   Landmark refinancing completed, diversifying funding sources, pushing out average maturity and
    refinancing all bank facilities maturing over 2014 - 2017

•   Duty free retender progressing well, three operators now short listed

•   Distribution guidance of 23.5 cents per stapled security reaffirmed; interim distribution paid of 11.5
    cents fully covered by net operating receipts. Strong support for the distribution reinvestment plan.

                                                                                                             4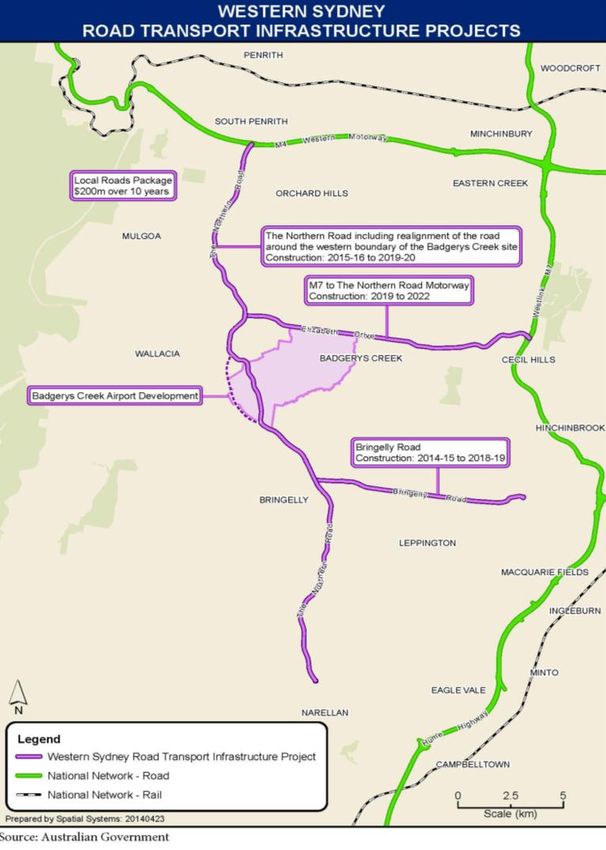
A great start to 2014

Half year 2014 highlights

International

     4.7%
           Total            5.7%         6.1% 11.5c
          2.3%
        Passenger growth     Revenue growth   EBITDA growth   HY14 distribution

                                                                          5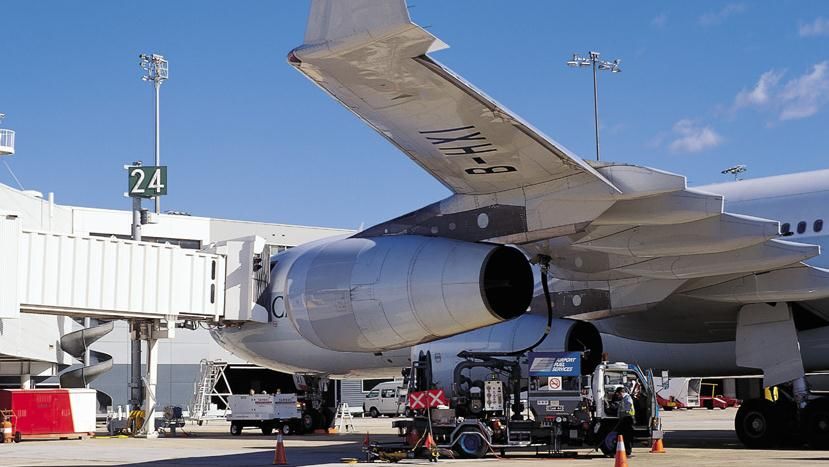
Distribution growth

Distribution stable and growing in line with cash flows, 100% covered by net operating receipts

                             25                                                   23.5c
                                                               22.5c
                             23
                                  21c
                             21
 Distribution per security

                             19

                             17

                             15

                             13
                                                               11c                11.5c
                                  10c
                             11

                             9

                             7

                             5
                                  2012                          2013               2014
                                         First Half   Second half      Guidance

                                                                                              6
Operational performance snapshot

Strong operational performance across all businesses

Business               First half 2014 highlights                           Revenue   Revenue        Revenue growth
Unit                                                                        ($m)      contribution
                       •      Strong international passenger growth from
Aeronautical                  Asian nationalities and mature markets          277.6   49%             5.7%1
                       •      Secured new low cost airline, Cebu Pacific

                       •      Passenger spend rates increased by 12.7%
Retail                 •      New stores opened in 2013 trading at or         125.0   22%             7.4%
                              above expectations

                       •      Improved car park utilisation and customer
Car Parking                   experience                                      66.4    12%             5.7%
                       •      Further targeted products developed
                       •      Online now driving 28% of revenues

                       •      278 market rent reviews conducted across
Property                      portfolio                                       96.4    17%             6.8%
                       •      New leases represented nearly half of total
                              property revenue growth
                                                                                                                  7
    1    Growth percentage, excluding aeronautical security recovery
Consistent track record of growth

Passenger                           EBITDA          Cash flow
                                                                                                       Investor returns
 growth                             growth          outcomes
Total passengers                                                Total revenue
                19
                                                                                     550
               18.5
                                                                                     500

                                                                Millions ($)
                18
Millions

               17.5
                                                                                     450
                17
                                                                                     400
               16.5

                16                                                                   350
                      1H10   1H11    1H12    1H13   1H14                                        1H10       1H11    1H12   1H13   1H14

EBITDA                                                      Distribution
               500                                                                         24

                                                                                           23
               450                                                    Cents per security
Millions ($)

                                                                                           22
               400
                                                                                           21

               350
                                                                                           20

               300                                                                         19
                      1H10   1H11    1H12    1H13   1H14                                        2010       2011    2012   2013   2014

                                                                                                                                        8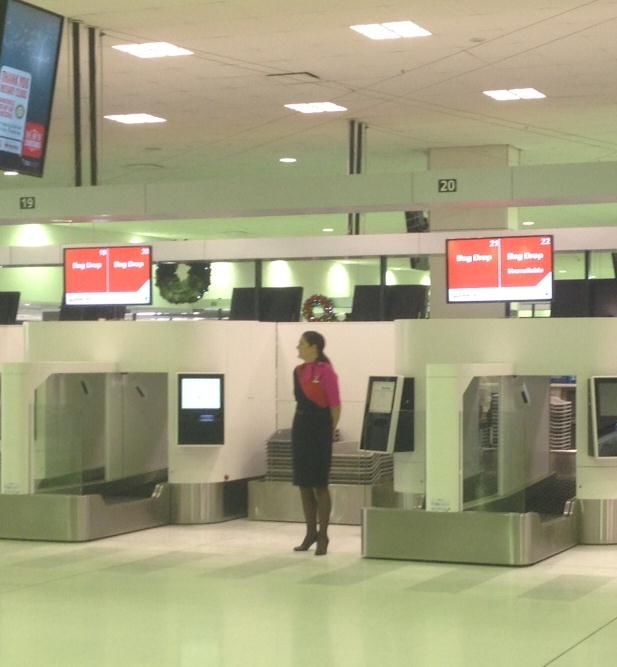
Financial Results 1H 2014
Stephen Mentzines
Chief Financial Officer
Sydney Airport statutory income statement

Strong total revenue and EBITDA growth of ~6%

$ million                                                                        HY 2014   HY 2013   % change

Aeronautical revenue                                                              236.3     223.6      5.7%

Aeronautical security recovery                                                    41.3      42.0      -1.6%

Retail revenue                                                                    125.0     116.4      7.4%

Property and car rental revenue                                                   96.4      90.3       6.8%

Car parking and ground transport revenue                                          66.4      62.9       5.7%

Other                                                                              3.0       2.7      11.1%

Total Revenue                                                                     568.4     537.9      5.7%

Expenses (pre specifics)                                                         (108.9)   (105.0)     3.7%
Profit before depreciation, amortisation, finance cost and income tax (EBITDA
                                                                                  459.5     432.9      6.1%
pre specifics)
Specifics                                                                         (0.5)      4.1

Profit before depreciation, amortisation, finance cost and income tax (EBITDA)    459.0     438.6      4.7%

Depreciation and Amortisation                                                    (151.9)   (150.0)

Profit before finance costs and income tax (EBIT)                                 307.1     288.6
Interest income                                                                    6.0       7.2
Finance costs                                                                    (292.2)   (242.8)

Profit before income tax (expense)/benefit                                        20.9      53.0
Income tax (expense)/benefit                                                      31.8      (39.7)
Profit after income tax                                                           52.7      13.3
Profit Attributable to Non Controlling Interests                                   1.2      10.7

Net Profit Attributable to Investors                                              53.9      24.0
                                                                                                                10
Sydney Airport distribution reconciliation
Sydney Airport distribution 100% covered by net operating receipts
$ millions HY 2014
Profit before income tax benefit/(expense) 20.9
Add back: depreciation and amortisation 151.9
Profit before tax, depreciation and amortisation 172.8
Add / (subtract) non-cash financial expenses
- Fair value adjustment to swaps 51.4
- Amortisation of debt establishment costs 15.4
- Capital Indexed Bonds capitalised 17.9
- Borrowing costs capitalised (3.2)
Total non-cash financial expenses 81.5
Add / (subtract) other cash movements
-Movement in cash reserved for specific purposes 1.0
-Other (0.1)
Total other cash movements 0.9
Net operating receipts 255.2
Stapled securities on issue (m) 2,216.2
Net operating receipts per stapled security 11.5c
Distributions declared per stapled security 11.5c
11Capital management
Significant liquidity and strengthened credit metrics 30 June 2014 Metrics
Net debt $6.5bn
• $1.2bn of undrawn facilities available to cover current liabilities
Net debt/EBITDA 6.9x
and fund growth capex into 2016
CFCR 2.3x
• CFCR 2.3x; Net Debt to EBITDA 6.9x; continued natural deleveraging
Credit rating BBB / Baa2
• Next unfunded maturity in 2H 2015; 2014 maturities addressed
Next unfunded maturity 2H 2015
• Average debt maturity late 2022; opportunities to lengthen further
Average maturity Late 20221
• Stable cost of debt at 6.2%; short term interest rate exposure highly
hedged and all currency exposure fully hedged Average cash interest rate 6.2%2
New Bond
Debt Maturity Profile1 Issuances
1,500
Significant Average
1,250 Undrawn Debt Maturity
1033
Opportunity Opportunity
1,000 802
736 702 719 750
750 659
545
475 217 445
500 380 369
158 100 519
175
250 86 292 318
300 387
127 127 200
0
2014 2015 2016 2017 2018 2019 2020 2021 2022 2023 2024 2025 2026 2027 2028 2029 2030
Drawn Bank Undrawn Bank Domestic Wrapped Bonds Domestic Unwrapped Bonds Offshore Bonds
1 As at 30 June 2014 adjusted for redemption of $700m Nov-14 bond maturity using committed sources of undrawn bank and capital market debt (A$380m US private placement)
2 Cash interest paid / average gross debt, excludes up-front fees, commitment fees and capitalised interest 12Capital Management - Refinancing
Landmark refinancing was consistent with all debt portfolio targets
Minimise Pricing Maintain Capacity for Future Raisings
New EMTN platform established
Pricing inside current portfolio average
Significant bank and bond oversubscription
Spread & Lengthen Maturity Profile Minimise Execution Risk
Maturity lengthened by 2 years 2014 maturities addressed well in advance
Profile spread with gaps filled in 2024 & 2028 All 2014-2017 bank debt facilities refreshed
Diversify Funding Sources Maintain BBB/Baa2 Credit Rating
Bond issuances into two debut markets
BBB/Baa2 credit rating maintained
targeting 10+ year tenor
Total Interest Coverage1 Net Debt : EBITDA
2.5x 8.0x
2.4x 7.8x 7.6x
2.26x
2.3x 7.6x
2.19x 7.4x 7.4x
2.2x 2.13x 7.4x
2.08x 2.06x 7.1x
2.1x 7.2x
6.9x
2.0x 7.0x
1.9x 6.8x
1.8x 6.6x
1H10 1H11 1H12 1H13 1H14 1H10 1H11 1H12 1H13 1H14
1
Calculated as cash flow available for debt service dividend by total interest paid
13Top four capex projects over the half
Capital expenditure for first half 2014 of $95.5m, guidance of $1.2b reaffirmed over 2014 - 2018
Baggage Taxiway T2 Aprons T1 HIAL
• Additional A380 • Widening and • Enhance apron • Additional High
capable baggage improvement of capabilities Intensity Approach
reclaims belt, taxiways B and C to Lighting on Northern
• Improve terminal
facilitating additional the south of T2 runways (300m)
facilities
capacity
• Improving efficiency • Part of the broader
• Dual door boarding
• New early bag store of the T2 aprons low visibility strategy
aerobridges, more
and additional
• Project completed efficient US • Project completed
sorting and make-up
screening, additional
facilities
gate lounge seating
• Expected staged
• Project completed
completion from
June 2014
March 2015
14Traffic and capacity development Kerrie Mather Chief Executive Officer
Diversity and positive market dynamics

A strong catchment and diverse mix of airlines, destinations and nationalities, underpins traffic
strength

     • The composition of visitor numbers to                                               Growth in visitor numbers
                                                                                           to Sydney Airport
                                                                                                                                     1H14 incremental
                                                                                                                                        passenger
                                                                                                                                                                     % Growth

       Australia and Sydney has changed over                                                                                             numbers
       the past 20 years                                                                   China                                               64,553                  +15.8%
                                                                                           USA                                                 19,228                  +6.0%
     • The shifting focus to Asia is                                                       India                                               17,359                  +15.4%
       complemented by the shift of airlines                                               Malaysia                                            16,933                  +22.5%
                                                                                           UK                                                  12,659                  +3.5%
       serving Sydney Airport                                                              Korea                                                9,374                  +6.2%
                                                                                           New Zealand                                          9,240                  +1.7%
     • Traditional markets such as the United                                              Hong Kong                                            8,604                  +17.0%
       States and Europe also demonstrated                                                 France                                               7,326                  +8.6%
                                                                                           Singapore                                            5,330                  +9.3%
       strong growth during first half 2014

                                                                                                      International Aircraft Seats by Region of Airlines*
                              Australia   New Zealand                              100%
             11%
                                                                                   90%
                              China       UK
                                                                                   80%
                                                        International Seat Share

                              USA         Korea                                    70%

                        46%   Japan       India                                    60%
2%                                                                                 50%
     5%
                              Germany     Canada
                                                                                   40%

                              France      Malaysia                                 30%
       6%
                                                                                   20%
                              Indonesia   Singapore
            7%                                                                     10%
                   8%         HK          other                                     0%
                                                                                          S90 S91 S92 S93 S94 S95 S96 S97 S98 S99 S00 S01 S02 S03 S04 S05 S06 S07 S08 S09 S10 S11 S12 S13
                                                                                          Australia     New ZealandPacific      Europe      N America      other    Asia     Middle East

                                                                                                                                                                                16
                                                                                           * International seats by origin market, 1990-2013
Aeronautical business and passenger
performance
Year to date international passenger growth of 4.7% is a strong result and above our long term
trend. Domestic passenger growth of 1.2%. Long term trend remains robust
• Strong passenger growth, above long term Long term total traffic growth
trends 45
40
• Aeronautical revenue up 5.7% driven by: 35
30
• Strong growth in international passengers, pax 25
(m) 20
due to Chinese New Year and Easter
15
periods, as well as the benefit of a number 10
of sporting, business and cultural events 5
held in Sydney 0
*
• Aeronautical investment, contributing 3.3%
of total aeronautical revenue growth
• The domestic market in the near term is likely
to continue seeing load factor improvement as
previous capacity growth is absorbed. Within
the market we expect to see a continuation of
the trend LCC growth trend.
* HY14 Traffic number has been annualised 17Low cost carriers driving growth
Sydney Airport welcomes the announcement by Cebu Pacific, operating services to Manila
from September
International LCCs have been a major Sydney Airport international low cost carriers
contributor to our recent growth
Sydney is well positioned to capture the Asian
LCC expansion
LCCs are efficient users of infrastructure
- 30-50% additional seats on the same
aircraft type relative to full service airlines
- Rapid turnarounds
The arrival of Cebu reinforces Sydney’s
position as Australia’s largest international low International LCC Seats (one-way per week)
cost carrier airport
Cebu Pacific Air, will provide an additional
226,800 seats per year on the Sydney-Manila
route
Total seats
In competitive response, Philippine Airlines
announced increased frequency on their
Manila – Sydney service from four weekly to
five services from October.
SYDNEY PERTH MELBOURNE GOLD COAST
2008 2011 2012 2013 18Commercial business update
Diversity of revenue
Commercial businesses

Balanced and diverse sources of revenue generation, underpins business strength

• Highly diversified portfolio                       Revenue split, aeronautical and commercial

• Balanced and diverse revenue base, from
  aeronautical, retail, car parking and property.
  Roughly 50% aeronautical and 50%                                               Aeronautical
  commercial                                                Commecial                49%
                                                              51%

• Across airport we have around 500 leases for
  both property and retail tenants as well as over
  16,000 car spaces, through the domestic and
  international precincts
                                                     Commercial revenue split
• Many natural hedges exist and the majority of                             1%

  revenues have contracted or implicit annual              3%
                                                                       5%                       Property
                                                                  6%
                                                                                                Duty Free
  escalations and down side protections                                               28%       Specialty retail
                                                                                                Food and Beverage
                                                            14%                                 Car parking - International
                                                                                                Car parking - Domestic
                                                                                                Advertising
                                                             9%                                 Currency Exchange
                                                                                                Car Rental
                                                                                    23%         Other
                                                                       7%
                                                             4%

                                                                                                                        20
Retail
Retail revenue grew strongly over the first half of 2014, driven by growing passenger spend
rates
Performance
• Revenue grew 7.4%, strong growth reflecting Retail
increasing penetration and passenger spend
Number of retail outlets 203
rate improvement
• Strong performance due to: Gross lettable area 25,438m 2
• Increased passenger spend rates of Occupancy 99.6%
12.7%
• Complete cycling of tobacco law changes
• Increase in Chinese passengers
• Tailoring of brands and products across
our retailers
New opportunities
• Three new tenancies in Terminal 1, to open
late in Q4 2014
• Tendering of advertising business, a
significant contract for the airport
• Review and repositioning of food courts
21
across both Terminals 1 and 2Retail
Duty free retender
Strong retail performance is driving a very competitive tender process
Highlights
• Duty Free contract 13% of total revenue
• Duty free retender on track and progressing
well; three operators have been shortlisted
• All submissions of very high calibre, a
strong field that included the world’s largest
operators, driving a competitive process
World’s largest operators
• An announcement of Sydney Airport’s Rank Operator Country of origin Sales in EUR
1 DFS United States 4.1
winning Duty free partner or partners will be 2 Dufry Switzerland 2.9
made this calendar year 3 LS travel retail France 2.9
4 Lotte Duty Free South Korea 2.4
5 Heinemann Germany 2.4
6 World Duty Free Italy 2.1
7 Nuance Switzerland 1.7
8 Shilla Duty Free South Korea 1.4
9 Dubai Duty Free UAE 1.3
10 Ever Rich Group Taiwan 1.2
Source: Moodie Report July 2014
The duty free landscape has changed, The Boston Consulting Group estimates
that the global duty-free goods market was worth $54.2 billion in 2013, up 5% 22
from 2012. It projects that this will reach about $60 billion in 2015Car parking
Car parking revenues continue to be driven by the success of the online offering
Performance Growth in online bookings
• Online revenue grew 41% over the six months, 30,000
compared to pcp 25,000
20,000
• Online revenue continues to be a large part of
15,000
public car parking revenue, now 28%
10,000
• Continuing to refine our discounted online 5,000
offers, after analysing customer needs
0
Sep-11
Mar-12
Sep-12
Mar-13
Sep-13
Mar-14
Nov-11
Jan-12
May-12
Nov-12
Jan-13
May-13
Nov-13
Jan-14
May-14
Jul-11
Jul-12
Jul-13
• Developed new integrated short stay online
capability, for 1, 2 and 3 hour slots, as well as New online offers
valet options
New opportunities
• Ground Transport initiatives progressing well.
Recovery expected via our normal aeronautical
and commercial mechanisms
• Continued marketing efforts on radio, billboard
and online, creating new markets and
increasing utilisation in the off peak
23Property
Continues to create new opportunities for growth within the portfolio
Performance
Revenue growth of 6.8%, driven by new Property metrics
leases and rental reviews Number of property leases Over 300
Continues to manage a large number of
Gross lettable area 944,745 m2
leases and tenants, maintaining minor
vacancies Occupancy 98%
278 rental reviews undertaken across the Ave. rental growth on pcp 4.2%
portfolio
New opportunities Etihad lounge opened in December 2013
Review options for development of two new
hotels, one 4-5 star and one 2-3 star,
following the success of Rydges
Car rental contract negotiation and
expressions of interest for new possible
operators
Construction of the bridge over Alexandra
Canal, opening up to 30 hectares of land for
future development north of the Airport
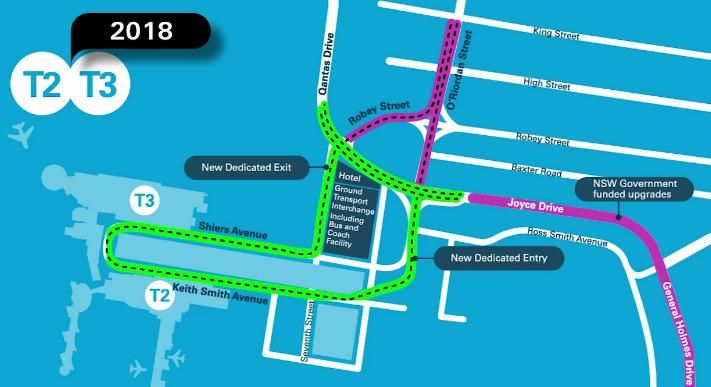
24Improving the passenger experience
2014 ground transport improvements
Together Sydney Airport and the NSW Government are investing over $500 million
Over the next five years Sydney Airport plans to invest The NSW Government has committed $282 million to
approximately $300 million to improve the ground access and improve the road network outside the airport boundary near
support facilities inside the airport boundary including: the T1 and T2/T3 precincts including:
- T1: Free flowing centre road, new flyovers and expanded - Widening Marsh Street westbound to three lanes
pick up area between the bridge and the M5
- T2/T3: New dedicated five lane exit road, ground transport - Reconfiguring Robey Street and O’Riordan Street to
interchange and parking/storage facility as well as four-five one way roads
star hotel - Widening Joyce Drive to three lanes in each direction
26Construction commenced
T1 Precinct
The road works proposed for the T1 precinct will improve access, particularly at peak periods
Estimated
Stage Description Completion Ref
Date
• Widening of kerbside lane on Departures Rd
• Reconfiguration of entry at Link Rd to provide greater
capacity for vehicles from Airport Drive
1 •
•
Extension of drop off area on Departures Rd by 120m
Dedicated bus drop off zone at south end of terminal to
Completed
Dec 2013
provide greater capacity for vehicles at northern end of
Departures Rd
• Reconfiguration of existing entries and exits, including
the construction of a new exit for city bound traffic
• Centre Road alignment & entry to taxi holding area
2 • Traffic management signals at Cooks River Drive exits Dec 2014 Green
• Enlargement of taxi holding and limousine pick up (Underway)
areas
• Configuration of re-circulation north of Customs
Building
• Widening Departures Road ramp approach to the
terminal
3 Dec 2015 Yellow
• Construction of Marsh Street to Centre Road ramp and
reconfiguration/relocation of substation
• New Airport Drive flyover, facilitating arrivals level
buses and provides for staff access to the northern car
4 park, removing the merge between Airport Drive (bus Jun 2016 Blue
arrivals and staff) with Marsh Street pax accessing the
Departures Ramp
• Construction of exit ramp from northern car park to
5 Dec 2016 Orange
Centre Road
27Technology improvements
Technology continues to assist in improving the passenger experience and providing more
efficient processing
• Technology roll out continues to be a focus in
improving the passenger experience
• Smart gates continue to gain patronage, with
six countries now eligible and the ongoing
rollout of ePassports
• Sydney Airport now has 28 smart gate kiosks
and 22 smart gate processing gates
• Self-service check in trials in the international
terminal have been a well received by
passengers and airlines, and this initiative
has now been rolled out to six airlines
• Self-service bag drop trials with Qantas
International are now underway, with initial
positive feedback
28Second Sydney Airport update and outlook
Western Sydney – Airport Update

Australian and NSW governments are progressing with infrastructure for western Sydney:
Roads, rail and the airport
•       The Australian Government has:

    •      established the Western Sydney Unit to develop a
           detailed airport proposal and to work with the
           NSW Government on the broader infrastructure
           package

    •      appointed Business Advisers Ernst & Young
           together with LEK, GHD and Landrum and Brown

•       The Australian and NSW Governments are working
        in partnership to deliver the Western Sydney
        Infrastructure Plan (WSIP) to develop and deliver
        critical road infrastructure in advance of the airport:

    •      Upgrade of Bringelly Road to a minimum of 4
           lanes between Camden Valley Way and The
           Northern Road, works commencing 2014/15

    •      Upgrade of The Northern Road to a minimum of 4
           lanes from Narellan Road to the M4 Motorway,
           works commencing 2015/16
    •      Construction of The Northern Road Motorway
           between the M7 Motorway and The Northern
           Road
•       The NSW Government is progressing consultation on
        the South West Rail Link Extension

                                                                                         30
Western Sydney – Airport Update
Sydney Airport evaluating the opportunity
• The Australian Government issued, and Sydney Airport accepted, the Notice to Consult on the development and
operation of a Western Sydney airport on 18 August 2014
• The nine month consultation period commences on 30 September 2014
• Sydney Airport has established a team of internal and external experts to examine the business case and evaluate
the opportunity:
• The work streams include but are not limited to - passenger forecasting, demographics, airport design and
operation, planning and commercial development, environmental analysis, funding and financial modelling
• Work streams mirror program established by Western Sydney Unit
• Following the end of the formal consultation, the Australian Government may enter a contractual phase which would
involve issuing Sydney Airport a Notice of Intention setting out the material terms for the development and operation
of the Western Sydney airport. The Government would then allow Sydney Airport between four and nine months to
consider the exercise of its option
• Sydney Airport anticipates that its business case analysis and evaluation of the opportunity would continue through
both the consultative and subsequent contractual phase; these are expected to take up to two years to complete
Indicative Timeline Only
Notice to Notice of
Preliminary Consult Government Intention
discussions consideration
9 months 4-9 months
31Outlook
2014 has started strongly with management initiatives translating into yield expansion and
strong revenue growth across all businesses, driving increased distributable cash for investors
• All major management initiatives on track and progressing well
• Refinance completed providing financial flexibility, liquidity and lengthened tenor
• 1H14 Capex of $95.5 million, focused on capacity expansion and passenger facilitation
• Reaffirm guidance:
• 23.5 cent distribution for 2014, reflecting confidence in the continuing growth in free cash flow.
• $1.2 billion capex over the next 5 years (2014-2018)
• Sydney Airport is well positioned to capture future traffic growth and commercial opportunities
32You can also read