Surveys of the Foveaux Strait oyster (Ostrea chilensis) population (OYU 5) and Bonamia exitiosa prevalence, intensity, and disease related oyster ...
←
→
Page content transcription
If your browser does not render page correctly, please read the page content below
Surveys of the Foveaux Strait oyster
(Ostrea chilensis) population (OYU 5)
and Bonamia exitiosa prevalence,
intensity, and disease related oyster
mortality in February 2020
New Zealand Fisheries Assessment Report 2021/06

 K.P. Michael,
 J. Bilewitch,
 J. Forman,
 D. Hulston,
 G. Moss

ISSN 1179-5352 (online)
ISBN 978-1-99-100301-0 (online)

February 2021
Requests for further copies should be directed to:

Publications Logistics Officer
Ministry for Primary Industries
PO Box 2526
WELLINGTON 6140

Email: brand@mpi.govt.nz
Telephone: 0800 00 83 33
Facsimile: 04-894 0300

This publication is also available on the Ministry for Primary Industries websites at:
http://www.mpi.govt.nz/news-and-resources/publications
http://fs.fish.govt.nz go to Document library/Research reports

© Crown Copyright – Fisheries New Zealand
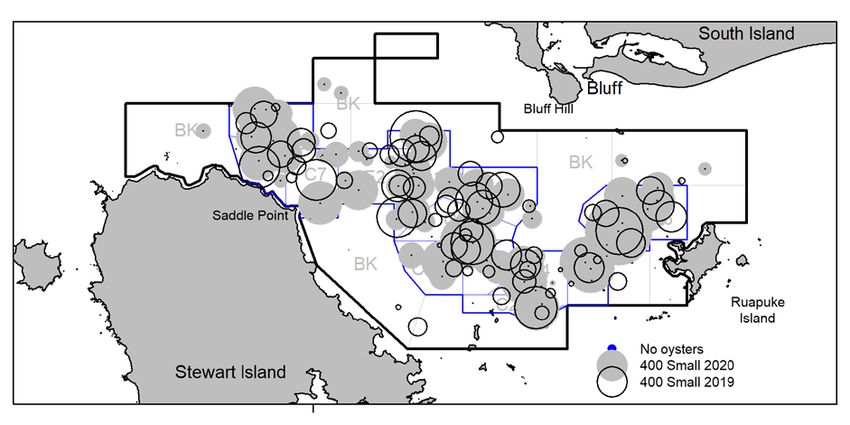
TABLE OF CONTENTS

EXECUTIVE SUMMARY 1

1. INTRODUCTION 3

2. OBJECTIVES 5
 2.1 Contracted Objectives (2018–2020) 5
 2.2 Specific Objectives for the February 2020 survey 5

3. METHODS 6
 3.1 Survey methods 6
 Catch sampling 8
 3.2 Estimates of oyster densities and population size 8
 3.3 Methods to estimate the annual mortality from Bonamia 9
 3.4 Methods to estimate the prevalence and intensity of Bonamia infection 10
 Estimating prevalence and intensity of Bonamia exitiosa infection 10
 Population estimates of non-fatal and fatal Bonamia infection 11
 3.5 Method to evaluate the best future stock projection from the 2017 OYU 5 assessment 11

4. RESULTS 12
 4.1 Survey operational detail 12
 4.2 Oyster abundance 13
 Changes in oyster densities between 2018 and 2020 13
 Survey estimates of population size 17
 Changes in the distribution of live oysters 26
 Recruitment 29
 4.3 Estimates of oyster mortality before and during the February 2020 survey 30
 4.4 The prevalence and intensity of Bonamia infection in core strata 36
 Sampling effectiveness for the prevalence and intensity of infection by Bonamia 36
 ddPCR detection of Bonamia in oyster heart tissues 36
 Prevalence and intensity of infection in oysters by Bonamia 37
 Changes in the distribution of prevalence and intensity of Bonamia infection 41
 The total numbers of recruit-sized oysters infected with Bonamia 45
 The distribution of recruit-sized oysters with non-fatal Bonamia infections 49
 4.5 Summer mortality from Bonamia in the commercial fishery area 50
 Projected short-term mortality from Bonamia infections 51
 4.6 Historical summary of the OYU 5 fishery 55
 4.7 The status of the OYU 5 fishery in 2020 and drivers of future trends 56
5. DISCUSSION 57
 5.1 Survey results 57
 5.2 Outlook for the 2020 oyster season 58

6. ACKNOWLEDGEMENTS 58

7. REFERENCES 59

APPENDIX 1: SURVEY STATION FORM 61

APPENDIX 2: BONAMIA SAMPLING FORM 62

APPENDIX 3: PROCESSING OF OYSTER TISSUES AND TESTING FOR BONAMIA
 EXITIOSA 63

APPENDIX 4: SURVEY CONDITIONS AND COMPARABILITY 67

APPENDIX 5: 2020 SURVEY CATCH AND INFECTION DETAILS 69

APPENDIX 6: REFERENCES FOR SURVEYS 2010–2019 71
EXECUTIVE SUMMARY

Michael, K.P.; Bilewitch, J.; Forman, J.; Hulston, D.; Moss, G. (2021). Surveys of the Foveaux
Strait oyster (Ostrea chilensis) population (OYU 5) and Bonamia exitiosa prevalence, intensity,
and disease related oyster mortality in February 2020.

New Zealand Fisheries Assessment Report 2021/06. 71 p.

Stock assessments of Foveaux Strait oysters (OYU 5) are undertaken five-yearly. The last stock
assessment survey was in 2017. Two-phase, random stratified stock assessment surveys have been
undertaken since 1990. Since 1999, these surveys have sampled the same survey area (1054 km2) using
the same methods and similar strata to ensure data from these surveys are comparable. An additional
stratum (16 km2) was introduced by oyster skippers in 2007 and since then, the size of survey area has
remained at 1070 km2. The 1999 stratum boundaries have also remained similar; however, some of the
original strata have been subdivided at various times to better define the areas with relatively high
(commercial), moderate, and low oyster densities. Since 2012, 26 survey strata have been sampled for
stock assessments. Annual, smaller surveys (Bonamia surveys) that focus sampling effort in the core
commercial fishery area are undertaken in the years between stock assessments. The Bonamia survey
area represents 14 of the 26 stock assessment survey strata (46% of the area), and 75% and 69% of the
recruit-sized oyster population in 2012 and 2017, respectively. To allow Bonamia survey data to be
incorporated into stock assessments, the remaining 12 stock assessment strata are combined into a single
background, 15th stratum, thereby sampling the whole stock assessment area. These February surveys
provide a “weather forecast” immediately before the oyster season begins in March. Bonamia surveys
update information on:
 • Oyster densities and population sizes of four size groups of oysters. Fishers high-grade their
 catches (return the smaller oysters that are above minimum legal size) to maximise the numbers
 of first grade oysters. “Commercial”-sized oysters were estimated for the first time in 2019 and
 represent the size group retained by fishers. “Commercial”-sized oysters are included in counts
 of recruit-sized oysters. Individual oysters were allocated to size groups based on their ability
 to pass through three standard rings with internal diameters of 65 mm, 58 mm, and 50 mm:
 o “Commercial”-sized oysters, ≥ 65 mm
 o Recruit-sized (minimum legal size) oysters, ≥ 58 mm
 o Pre-recruit oysters, ≥ 50 mm to 57 mm
 o Small oysters, 49 mm down to 10 mm in diameter.
 • the status of Bonamia exitiosa infection (prevalence and intensity)
 • estimates of disease mortality (from B. exitiosa) in the commercial fishery areas.
Together with estimates of recruitment from spat monitoring, catch sampling and survey estimates for
small oysters, these data are important to better predict the future status of the fishery.

Foveaux Strait oyster and Bonamia surveys are undertaken in collaboration with the Bluff Oyster
Management Company Ltd which provide a vessel, the survey dredge, and crews for the surveys. The
February 2020 survey continued this series of collaborative surveys. Dredge sampling was consistent
with previous surveys and survey data are comparable with others in the time series. Since 2013, testing
for B. exitiosa infection used two methods to allow the time series of infection data from heart imprints
recorded since 1986 to be adjusted for the higher levels of detection provided by polymerase chain
reaction (PCR) methods. A quantitative PCR (qPCR) method was used between 2013 and 2017. An
improved droplet digital PCR (ddPCR) method with a high level of precision and repeatability, superior
levels of sensitivity, detection, and cost-effectiveness was used for the first time in 2018.

Population estimates are presented by stratum, and by three fishery areas: the Bonamia survey area
(491.8 km2), the background stratum (578.4 km2), and the stock assessment survey area (1070.2 km2).
Only five stations were sampled in the background stratum; estimates for the background stratum and

Fisheries New Zealand Foveaux Strait oyster and Bonamia surveys February 2020 • 1
the stock assessment survey area should therefore be viewed with caution. The commercial-sized oyster
population in the Bonamia survey area was 316.1 million oysters (95% CI 198.8–492.5). Commercial-
sized oysters represented 59.6% of recruit-sized oysters in the Bonamia survey area and 57.3% in the
stock assessment survey area. Commercial-sized oysters declined by 0.8% between 2019 and 2020.
Recruit sized oysters in the Bonamia survey area decreased by 2.3% from 542.5 million oysters in 2019
to 529.9 million in 2020. Pre-recruit oysters further increased by 22.5% to 265.3 million oysters, and
small oysters further increased by 76.6% to 1052.4 million in 2020.

Bonamia infection levels have been low since 2016. In 2020, estimates of the mean prevalence of B.
exitiosa infection in recruit-sized oysters from the Bonamia survey area were 3.2% (1.4% in 2019) using
heart imprints and 5.1% (6.4% in 2019) using ddPCR. Bonamia mortality over the summer of 2019–20
in this area was low (3.0%), comprised of a pre-survey mortality of 0.7% and a post-survey mortality
of 2.3%. Non-fatal infections (from heart imprints) represented 0.9% of the recruit-sized population in
2020.

At relatively low levels of catch (less than 30 million oysters per year), the future trend in the abundance
of oysters in the Foveaux Strait fishery is likely to be driven by disease mortality from Bonamia and
the levels of recruitment. Disease mortality was low in 2020 and is expected to remain low in 2021.
Population sizes of commercial-sized and recruit-sized oysters remained similar between 2019 and
2020. Population sizes of pre-recruit and small oysters increased substantially between 2019 and 2020.
Spat monitoring, catch sampling, and the survey data show increased recruitment to the oyster
population, and increases in pre-recruit and small oysters will support future increases in recruit-sized
oysters. In the medium-term, all the key indicators for the future rebuilding of the OYU 5 fishery are
strongly positive.

2 • Foveaux Strait oyster and Bonamia surveys February 2020 Fisheries New Zealand
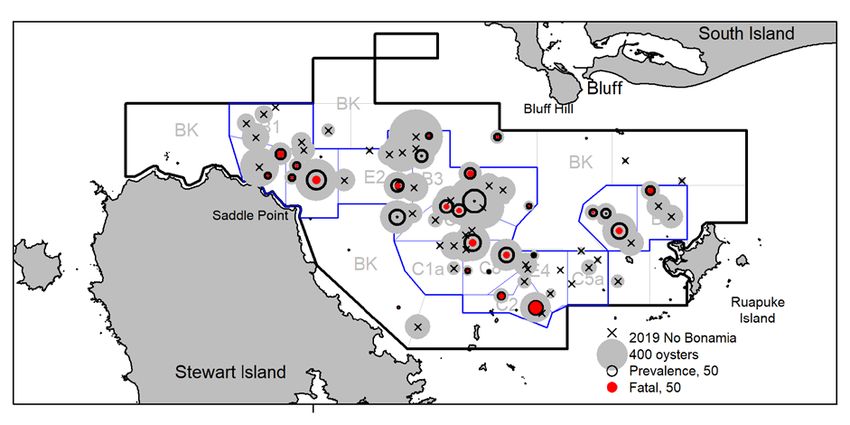
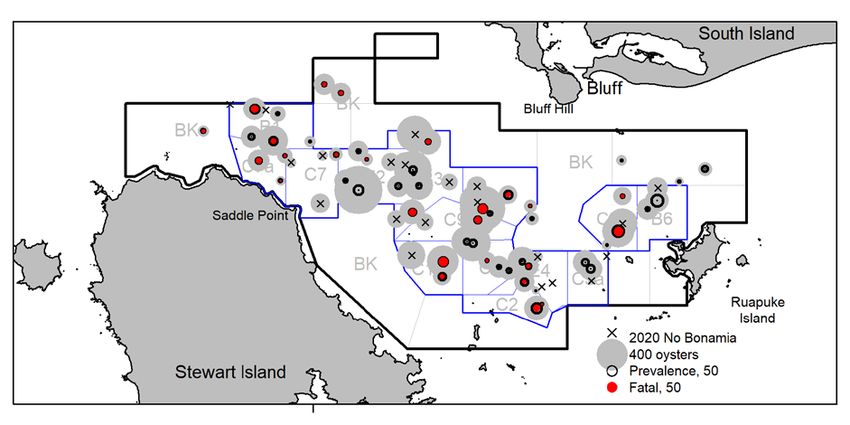
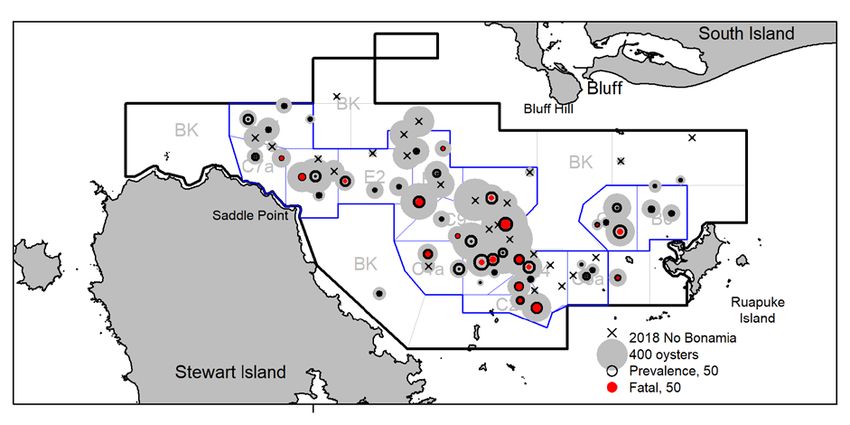
1. INTRODUCTION

The Foveaux Strait oyster fishery (OYU 5) is a high value, nationally important fishery that has been
fished for over 150 years. Oysters (Ostrea chilensis) are an important customary (taonga), recreational,
and commercial species, and are important to the socioeconomics of Bluff and Invercargill. The OYU 5
stock is part of the Group 1 stocks in the Fisheries New Zealand draft National Fisheries Plan for Inshore
Shellfish which recognises the relatively high biological vulnerability of Group 1 stocks (including
OYU 5) and prescribes a close monitoring approach. Achieving maximum value from Group 1 stocks
is best done through accurate and frequent monitoring to support responsive management. Additionally,
there is a collaborative fishery plan for the management of the fishery, the Foveaux Strait Oyster
Fisheries Plan (Ministry of Fisheries 2009). This plan was collaboratively developed by the Foveaux
Strait Oyster Fisheries Plan Management Committee (FSOFPMC) which included representatives from
the Bluff Oyster Management Company Ltd (BOMC), customary and recreational fishers, and the then
Ministry of Fisheries, now Fisheries New Zealand.

The haplosporidian parasite of flat oysters Bonamia exitiosa (Bonamia) was thought to be an endemic
disease of Foveaux Strait oysters. A recent study found B. exitiosa has a broad geographic distribution
and infects a number of oyster species (Hill-Spanik et al. 2015). Three Bonamia epizootics since 1985
(Doonan et al. 1994, Cranfield et al. 2005, Michael et al. 2019b) have shown that mortality from
Bonamia is oyster density dependent and a recurrent feature of the oyster population. This mortality is
the principal driver of oyster population abundance during epizootics and recurrent mortality events
suggest that Bonamia epizootics can be expected in the future. Management of the fishery recognises
that recruit-sized stock abundance and future benefits from the fishery (harvest levels) are mainly
determined by the levels of Bonamia mortality (assuming near long-term average recruitment).
Management of the fishery also recognises that the current harvest levels and any effects of fishing on
either oyster production or on exacerbating Bonamia mortality are not detectable. A summary of
Bonamia and its effects on the fishery is given by Michael et al. (2015a).

Since 2000, OYU 5 research has been directed by strategic research plans (Andrew et al. 2000, Michael
& Dunn 2005, Michael 2010). In 2010, a strategic research plan (SRP) was revised for five years from
2010 to 2015 (Michael 2010). This plan was collaboratively developed with the FSOFPMC and the
then Ministry of Fisheries. The 2010 SRP provides a broad range of research programmes aimed at
maximising production from the oyster fishery and meeting the Foveaux Strait Oyster Fisheries Plan
(Ministry of Fisheries 2009) goals and objectives (see Michael 2010 for details). Gaining a better
understanding of Bonamia and monitoring its effect in the fishery are rated as the highest priorities in
the Foveaux Strait Oyster Fisheries Plan and SRP.

Two-phase, random stratified stock assessment surveys have been undertaken since 1990 (Cranfield et
al. 1991, Fu et al. 2016). OYU 5 stock assessments, oyster surveys, and Bonamia surveys since 1999
are summarised by Michael et al. (2016). Since 1999, these surveys have sampled the same survey area
(1054 km2) using the same methods and similar strata to ensure data from these surveys are comparable.
An additional stratum (B1a, 16 km2, see Figure 1) was introduced by oyster skippers in 2007. Since
then, the size of the Foveaux Strait oyster survey area has remained at 1070 km2. Some of the original
1999 strata have been subdivided at various times to better define the areas with relatively high
(commercial), moderate, and low oyster densities. Since 2012, 26 survey strata have been consistently
sampled for stock assessments. Annual, smaller surveys (Bonamia surveys) that focus sampling effort
in the core commercial fishery area are undertaken in the years between stock assessments (Michael et
al. 2015b). The Bonamia survey area represents 14 of the 26 stock assessment survey strata (46% of the
area) and 75% and 69% of the recruit-sized oyster population in 2012 and 2017 respectively. To allow
Bonamia survey data to be incorporated into stock assessments, the remaining 12 stock assessment
strata are combined into a single background, 15th stratum, thereby sampling the whole stock assessment
area. The background stratum receives limited sampling effort.

The introduction of five-yearly stock assessments in 2012 has placed greater onus on the annual
Bonamia surveys to monitor changes in the oyster population in commercial fishery areas as well as the

Fisheries New Zealand Foveaux Strait oyster and Bonamia surveys February 2020 • 3
status of Bonamia. These surveys estimate oyster densities and population sizes of four size groups of
live oysters and recruit-sized and pre-recruit new and old clocks (Table 1). Clocks are the articulated
shells of recently dead oysters with the ligament attaching the two valves intact. In February surveys,
new clocks are assumed to be oysters that have died since summer mortality from Bonamia began, and
oysters that died up to three years before this are categorised as old clocks.

Table 1: In 2020, individual oysters were allocated to four size groups based on their ability to pass through
 three ring sizes with internal diameters of 65 mm, 58 mm, and 50 mm. Commercial-sized oysters
 were above the median size of oysters landed in the commercial catch. Small oysters were those
 that passed through a 50-mm ring, down to a size of about 10 mm in length estimated visually (*).

 Oyster Upper ring limit (mm) Lower ring limit (mm)
 size (pass through) (unable to pass)

 Commercial NA 65
 Recruit 65 58
 Pre-recruit 58 50
 Small 50 10*

Survey data provide a useful forecast for the following season because oyster density and meat quality
in localised high-density populations determine commercial catch rates. These surveys also estimate
the prevalence and intensity of Bonamia infection, and short-term (summer) mortality. This information
is used by fishers to assess prospects for the following oyster season. The first survey in this new time
series was undertaken in February 2014 (Michael et al. 2015b). These surveys incorporate a fully
randomised, two-phase sampling design aimed at better estimating oyster densities and population sizes
of oysters and new clocks. A standard Bonamia survey area was established to ensure that surveys are
comparable from year to year. This area was determined from fishery independent survey data and
fishers’ logbook data and thereby represents the core commercial fishery that has been consistent
through the fluctuations in relative oyster abundance driven by Bonamia mortality. This survey design
and sampling effort predicts a coefficient of variation (CV) for survey estimates of about 11%. The
2014 survey achieved a CV of 11.2% for recruit-sized oysters in the Bonamia survey area, and a CV of
11.7% for the stock assessment survey area from an additional 5 stations in the background stratum
(Michael et al. 2015b). Surveys since have achieved CVs of 8%, 9%, 11%, 11%, and 13% for recruit-
sized oysters in the Bonamia survey area in 2015, 2016, 2017, 2018, and 2019, respectively. In the stock
assessment survey area, CVs of 9%, 7%, 9%, 27%, and 17% were achieved in 2015, 2016, 2017, 2018,
and 2019, respectively (Michael et al. 2020). These low coefficients of variation for population
estimates are well below the 20% target set by Fisheries New Zealand for stock assessment surveys.

The current TACC for OYU 5 is 15 million oysters. At relatively low levels of catch (less than 30
million oysters per year), the trend in the abundance of recruit-sized oysters in the Foveaux Strait fishery
is driven by disease mortality from Bonamia and the levels of recruitment to the population (spat
settlement). Oyster spat settlement was low between the summers of 2009–10 and 2015–16 despite the
population size of spawning-sized oyster densities increasing until 2012. Consequently, the numbers of
small and pre-recruit oysters declined markedly and were unable to replace the large numbers of oysters
killed by Bonamia. Until 2012, Bonamia killed 8–12% of recruit-sized oysters, and fishing removed 1–
2% of the recruited population. The recruit-sized oyster population was increasing, albeit slowly,
despite the Bonamia mortality and low recruitment. The increased Bonamia mortality between 2013
and 2016 (200 million oysters between 2012 and 2014), and the continued low replenishment of spat to
the oyster population, and pre-recruit sized oysters to the fishery, resulted in a substantial decline in the
recruit-sized oyster population. All size groups of oysters declined between 2012 and 2017 and
increased between 2017 and 2019 (Table 2).

The use of droplet digital polymerase chain reaction (ddPCR) since 2018 has improved the detection of
low levels of Bonamia infection. Bonamia mortality has been low (less than 5.1%) since 2016, as has

4 • Foveaux Strait oyster and Bonamia surveys February 2020 Fisheries New Zealand
been the prevalence of fatal infections and non-fatal infections. The low oyster densities and low non-
fatal infections suggest reduced transmission of Bonamia infection.

This report provides a summary of information from the sixth of the new series of Foveaux Strait oyster
surveys in the Bonamia survey area undertaken in February 2020. This survey estimated oyster
population size and the status of Bonamia infection and outlines the implications for the future stock
status based on the 2017 OYU 5 stock assessment. This survey was undertaken as part of the research
for Ministry for Primary Industries programme OYS2017/01 (Objectives 1–4).

Table 2: Mean population estimates for commercial recruit-sized, pre-recruit, and small oysters in the
 Bonamia survey area and the stock assessment survey area in 2012, 2017, 2018, and 2019.
 Commercial-sized oyster populations were first estimated in 2019. The percentage decrease in
 mean population size between 2012 and 2017 (shaded tan) caused by Bonamia mortality, and the
 percentage increase in mean population size between 2017 and 2019 (shaded green) are also given.
 Estimates of mean population size from the stock assessment survey area in 2018 and 2019 should
 be viewed with caution because of the limited sampling in the large background stratum.

 Mean population size (millions) % decrease % increase
 2012 2017 2018 2019 2012–17 2017–19
 Oyster size: Bonamia survey area
 Commercial NA NA NA 318.7 NA NA
 Recruit 688.1 363.6 494.1 542.5 47.2 49.2
 Pre-recruit 297.4 123.1 178.4 216.5 58.6 75.9
 Small 451.3 261.9 401.8 595.8 42.0 127.5

 Oyster size: Stock assessment survey area
 Commercial NA NA NA 536.9 NA NA
 Recruit 918.4 527.4 883.3 868.0 42.6 64.6
 Pre-recruit 414.3 168.2 225.8 309.8 59.4 84.2
 Small 612.2 361.6 552.5 867.8 40.9 140.0

2. OBJECTIVES

1. To evaluate the current abundance and biomass of oysters in the OYU 5 fishery and to evaluate
 current and expected oyster mortality from Bonamia infection for the fishing years 2018, 2019,
 and 2020.
2. To evaluate the current status of the prevalence and intensity of Bonamia in the OYU 5 fishery for
 the 2018, 2019, and 2020 years.

2.1 Contracted Objectives (2018–2020)

1. Using a stratified random sampling design estimate the current recruited abundance and biomass
 of oysters within the area of the commercial Foveaux Strait oyster fishery with a target CV of
 ≤ 20%.
2. Using a stratified random sampling design estimate the annual mortality from Bonamia within the
 area of the commercial Foveaux Strait oyster fishery.
3. Using a stratified random sampling design estimate the prevalence and intensity of Bonamia within
 the area of the commercial Foveaux Strait oyster fishery.
4. Review all ddPCR procedures prior to undertaking any analysis of tissue samples at the beginning
 of each year’s fishing survey.

2.2 Specific Objectives for the February 2020 survey
• Estimate oyster density and population size for four size groups (commercial, recruit, pre-recruit
 and small size) in the Bonamia survey area, the background stratum and the stock assessment survey
 area.

Fisheries New Zealand Foveaux Strait oyster and Bonamia surveys February 2020 • 5
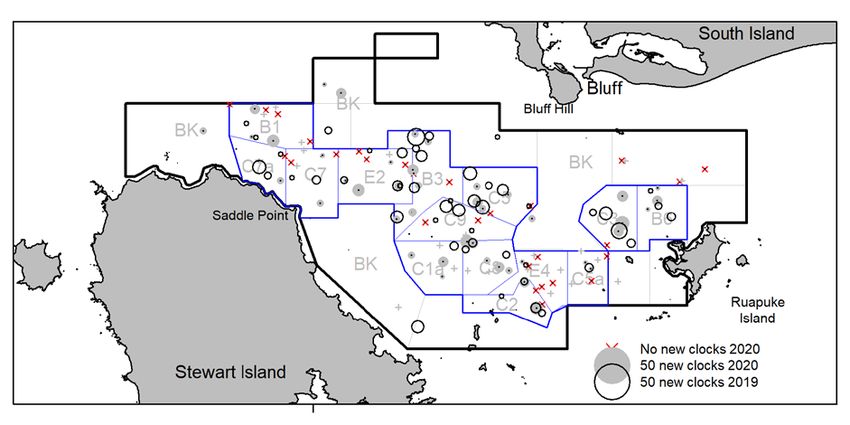
• Estimate the prevalence and intensity of Bonamia exitiosa (Bonamia) infection in recruit-sized
 oysters using droplet digital polymerase chain reaction (ddPCR) and heart imprints to maintain the
 long time series of infection data.
• Undertake pre-testing checks on all ddPCR procedures and reagents.
• Estimate summer mortality combining two different estimates of mortality:
 o Pre-survey mortality, the population size of recruit-sized new clocks and gapers
 o Projections of post-survey mortality from oysters with fatal infections (category 3–5
 infections).

3. METHODS

Detailed methods for annual oyster surveys are given by Michael et al. (2020). A brief summary and
any variation to these standard methods is given below.

3.1 Survey methods

Survey strata for the February 2020 survey were the same as for February Bonamia surveys since 2014
(Figure 1). The 2017 stock assessment survey sampled all the 26 strata (Michael et al. 2019b). The inclusion
of a single large background stratum (see Figure 1) for Bonamia surveys ensures that the entire stock
assessment survey area is sampled, and that data from these annual surveys can be included in future stock
assessments for OYU 5.

Figure 1: The 2020 survey area with the 2007 survey boundary shown as a heavy, black outer line, and the 2020
 survey strata representing the core commercial fishery area (Bonamia survey area) shown as blue
 lines. Strata are labelled with grey text. The remaining stock assessment survey strata which
 represent mainly background strata were merged into a single, large background stratum (BK).

Simulations were undertaken in 2014 to determine the optimal stratification and the numbers of stations
required to give a survey CV for the recruit-sized population estimate in the range of 8–12% (see Michael
et al. 2015a). Simulations predicted that 55 stations in the 14 Bonamia survey strata would produce a CV
of about 11%. ALLOCATE (Francis 2006) was used to allocate the numbers of stations to strata in 2020
(Table 3). Rand_Stn (Doonan & Rasmussen 2012) was used to generate the location of 50 random first-
phase stations and sufficient stations in each stratum to sample 5 second-phase stations in the Bonamia
survey strata (hereafter core strata), and 5 stations from the background stratum. Stations were generated
with an exclusion zone of 0.75 nautical miles to spread stations within strata to ensure good spatial coverage
and to prevent the overlap of sample tows.

6 • Foveaux Strait oyster and Bonamia surveys February 2020 Fisheries New Zealand
Since 2007, increasing numbers of fixed stations have been sampled annually across the stock assessment
survey area to provide a time series of data on changes in oyster density and Bonamia status in localised
areas. In 2015, Fisheries New Zealand (then MPI) Shellfish Working Group agreed data from the 12 fixed
stations add value to the information obtained from surveys. These 12 fixed stations were sampled in
February 2020 (Table 3 and Figure 2).

Table 3: The numbers of first-phase, second-phase, and fixed stations sampled, and the numbers of foul
 shots in each stratum during the February 2020 Bonamia survey, and the area of each stratum.
 A single, large background stratum (BK) represents the merged stock assessment survey strata
 outside the Bonamia survey area (see Figure 1).

 Stratum First-phase Second-phase Fixed Foul shots Area (km2)

 B1 3 3 1 78.2
 B3 7 44.7
 B6 3 30.1
 B6a 2 *
 BK 5 578.3
 C1a 3 31.3
 C2 3 1 1 21.9
 C3 3 1 32.7
 C5 4 1 1 37.7
 C5a 3 1 23.5
 C7 4 36.1
 C7a 3 1 23.6
 C8 3 1 26.8
 C9 3 2 34.5
 E2 5 1 2 42.8
 E4 3 2 28
 Totals 55 5 12 4 1 070.2
* The allocation of random stations in the background stratum (BK) included stratum B6a. Two of the fixed stations
 are located within BK.

Figure 2: The 2020 survey area with the 2007 survey boundary shown as a heavy, black outer line, the Bonamia
 survey area as a heavy blue line, and the 2020 Bonamia survey strata shown as blue lines. The
 remaining stock assessment survey strata (light grey lines) in the large background stratum were
 merged into a single stratum (BK). First-phase station numbers are in black text, second-phase in
 blue, and fixed stations in red text. Red crosses denote stations that couldn’t be towed because of foul
 ground (foul shots).

Fisheries New Zealand Foveaux Strait oyster and Bonamia surveys February 2020 • 7
Catch sampling
Except for minor variations, dredge sampling has followed standard procedures for stock assessment
and Bonamia surveys since October 2002: standard dredge sampling methods, standard methods for
sorting the catch and recording data (station data forms are shown in Appendix 1), and standard methods
for sampling oysters to determine the status of Bonamia. Details of the standard procedures are given
by Michael et al. (2015a). Two commercial oyster vessels have been used for surveys since 1999, F.V.
Golden Lea 1999–2010 and F.V. Golden Quest 2011–2020, except in 2016 when the F.V. Golden Lea
was used due to the unavailability of the F.V. Golden Quest. Stephen Hawke has skippered the survey
vessel since 2011, to maintain consistency in the time series. Survey stations were sampled with the
standard survey dredge (commercial dredge 3.35 m wide and weighing 430 kg) used since 1993 and
rebuilt in 2014 to the same specifications. A traditional friction winch used to deploy the dredge on F.V.
Golden Quest was replaced with a hydraulic winch system in 2014.

The catch from each tow (one per station) was sorted into live oysters, gapers (live, but moribund oysters
containing the whole oyster and valves remaining apart after the adductor muscle has lost its ability to
contract), and clocks (the articulated shells of recently dead oysters with the ligament attaching the two
valves intact) to estimate mortality. Until 2019, live oysters from the catch were sorted in three size
groups (see Table 1). In 2019 a fourth commercial size was recorded (see Table 1). Reference rings (65
mm, 58 mm, and 50 mm internal diameter) were used to ensure accurate allocation to each size group.
All four size groups were sampled in February 2020.

Clocks and gapers were recorded in two size groups: recruits and pre-recruits. Clocks were further
divided into two categories, new and old (see figures 8–10 of Michael et al. 2015a). In February surveys,
new clocks were defined as those with clean inner valves that had retained their lustre but may have
had some minor speckling from fouling organisms. The analysis assumes that new clocks were only
those oysters that had died since summer mortality from Bonamia began. Oysters that died before this
were categorised as old clocks and these oysters had shells that were fouled or in which the inner valves
had lost their lustre. Old clocks can be covered in fouling organisms on both external and internal
surfaces, and because the ligaments of oysters are thought to break down over about a three-year period,
old clocks represent oysters that had died between 1 and 3 years previously (Cranfield et al. 1991). The
classification of old clocks may vary depending on habitat. Old clocks from sand habitats may be older
because they may be filled with sand preventing the settlement of fouling organisms and they may be
exposed to lower physical forces on the hinge that prolong the time that both valves remain attached to
beyond three years. Gravel habitats are usually shallower with stronger tidal currents and higher swell
energy and the valves of old clocks in these habitats may be disconnected much more quickly than three
years, or the clocks (new and old) may be transported out of the fishery area by the strong tides.

The data recorded at each station included start and finish locations of the tow, depth, speed of tow;
numbers of oysters, new clocks, and gapers caught by size group; percentage fullness of the dredge;
wind force (Beaufort scale); stations where live bryozoans (Cinctipora elegans) were observed; and
sediment type (see Appendix 1). The presence/absence of bycatch species was also recorded directly
from the dredge contents. An example of the station data form is shown in Appendix 1 (see Michael et
al. 2015a for details).

3.2 Estimates of oyster densities and population size

Oyster densities and population sizes for the four size groups of live oysters were estimated for the
Bonamia survey area (14 core strata), the single background stratum (combining the 12 non-core strata),
and all 26 survey strata combined, which comprise the stock assessment survey area. Estimates are
presented by core strata where three or more randomly selected stations were sampled in February 2020
and these were compared with the estimates from strata sampled in 2016–2019 (Michael et al. 2016,
2019a, 2019b, 2020). Estimates for the four size groups of live oysters and recruit-sized new clocks are
presented separately. The absolute population size of each size group of oysters was estimated using

8 • Foveaux Strait oyster and Bonamia surveys February 2020 Fisheries New Zealand
the combined population sizes in each stratum. Estimates of the commercial population size (Michael
et al. 2015b) are given for comparison.

Estimates of absolute abundance and variance were calculated using standard stratified random
sampling theory (Francis 1984, Jolly & Hampton 1990). The estimate of dredge efficiency of 0.17 (95%
confidence intervals 0.13–0.22) from Dunn (2005) was used as a single scalar. The absolute population
size of recruit, pre-recruit, small oysters, and clocks was calculated by using the combined population
sizes in each stratum as

 x = ∑ Wi xi

where x is the estimated population size (numbers of oysters) for each size group, Wi is the area (m2),
and xi is the mean oyster density corrected for dredge efficiency in stratum i. Estimates of population
sizes are also presented by stratum separately.

The coefficient of variation (CV) for each stratum is calculated from the standard deviation and mean
oyster density alone, and the same calculation is used for the total survey area:

 s(x ) = (∑W i
 2
 s ( xi ) )
 2 1/ 2

where s ( x ) is the standard deviation for the estimated population size and s ( xi ) is the standard
deviation for the mean density in stratum i.

The 95% confidence intervals of the population means for each stratum and the total population are
estimated by bootstrapping, i.e., resampling with replacement of a normal distribution for which the
variance is based on a CV of the population estimate and the error of the estimated dredge efficiency.
The total error of the estimates of the population mean has two sources:
 - the sampling error from the survey, where the survey estimate of population size follows a
 normal distribution and is based on standard survey sampling theory; and,
 - the error associated with dredge efficiency, which is assumed to be normally distributed (there
 are only three data points).
If the two sources of error are independent, then the error can be estimated by simply adding the two
variance components.

Recruitment to the fishery was summarised using plots of changes in the population estimates of pre-
recruit and small oysters, and from changes in the patterns of distribution of small oyster densities,
between the February 2016 and February 2020 surveys.

3.3 Methods to estimate the annual mortality from Bonamia

Although substantial winter mortality from Bonamia has occurred previously (Hine 1991), most
mortality from B. exitiosa occurs in the summer. Summer mortality of recruit-sized oysters only is
estimated by Bonamia surveys. Summer mortality comprises the aggregate of two different estimates:
(1) Pre-survey mortality estimated from the population size of recruit-sized new clocks and gapers that
had died during the summer, and (2) projections of future (within about two months) disease mortality
from the proportion of oysters with categories three and higher (fatal) Bonamia infections scaled-up to
the size of the total recruit-sized oyster population. Although estimates of pre- and post-survey mortality
measure different variables and pre-survey mortality may include heightened natural (non-disease
related) mortality, the sum of pre- and post-survey totals gives the best estimate of summer mortality.

Pre-survey mortality, the absolute population size of recruit-sized new clocks and gapers, was estimated
using the same methods as for live oysters (see section 3.2). Post-survey mortality used the mean
proportion of oysters with fatal infections (category 3−5 infections, see Diggles et al. 2003) in each
stratum as a correction factor, i.e., 1 - mean proportion of category 3−5 infections. Population estimates

Fisheries New Zealand Foveaux Strait oyster and Bonamia surveys February 2020 • 9
for each stratum and the total survey area were recalculated to account for the projected mortality. Total
projected mortality is the difference between the total population size at the time of the survey and the
population corrected for projected Bonamia mortality (at the end of summer). A second estimate of
post-survey mortality uses the prevalence of oysters with fatal infections as a scalar to the prevalence
in the dredge catch. Estimates of fatally infected oysters by stratum and for the total population were
made using scaled-up numbers of fatally infected oysters at each station and the same method used to
estimate population size in section 3.2.

3.4 Methods to estimate the prevalence and intensity of Bonamia infection

Samples of up to 30 randomly selected recruit-sized oysters from each station were flown to the
National Institute of Water and Atmospheric Research (NIWA) Wellington for Bonamia exitiosa
testing. Oysters were generally processed the following day. A subsample of up to 25 recruit-sized
oysters from each station was taken for heart imprints and droplet digital polymerase chain reaction
(ddPCR) analysis to estimate the prevalence and intensity of Bonamia. For each sample, station and
sample data were recorded on Bonamia sampling forms (Appendix 2 and Appendix 3 give an example
and details). Data on size, general condition, and whether oysters were incubating larvae were recorded
(see Appendix 3). Histological samples were taken from the first five oysters processed for heart
imprints at each station.

Estimating prevalence and intensity of Bonamia exitiosa infection
Since 2013, testing for B. exitiosa infection used two methods to allow the time series of infection data
from heart imprints recorded since 1986 to be adjusted for the higher levels of detection provided by
polymerase chain reaction (PCR) methods. A quantitative PCR (qPCR) method was used between 2013
and 2017. An improved droplet digital PCR (ddPCR) method with a high level of precision and
repeatability, superior levels of sensitivity, detection, and cost-effectiveness was used for the first time
in 2018.

Prevalence of infection at each station is the proportion of the total sample number that tested positive
for Bonamia infection using heart imprints and ddPCR (Bilewitch et al. 2018). The intensity of B.
exitiosa infection was estimated using heart imprints and ddPCR. These estimates are not directly
comparable because heart imprints score the numbers of B. exitiosa parasites in haemocytes using the
methods of Diggles et al. (2003) and ddPCR estimates the numbers of B. exitiosa gene copies in the
sample (see Appendix 3 for details). However, there is a good relationship between the increasing
intensity of infection shown by heart imprints and an increase in the ratio of B. exitiosa DNA to Ostrea
chilensis DNA (relative infection levels) in ddPCR samples (see Figure A3.3, Appendix 3).

Review of ddPCR procedures prior to testing and repeat testing
Before the samples from the 2020 survey were analysed, quality control of reagents and methods was
undertaken (details in Appendix 3). Each 96-well plate tested included positive and negative controls.
Reactions with less than 103 total droplets were repeated. Samples displaying a minimum of five
positive droplets were classed as positive for either target (Bonamia or oyster β-actin). Any sample with
fewer than five positive droplets for the β-actin internal control was repeated. Each oyster sample
determined: (1) whether Bonamia was present (within the limit of detection for ddPCR) and (2) the
relative level of infection — this being directly comparable with heart imprint scores determined via
histology. Quantification of Bonamia levels in infected oysters used the concentration of β-actin as a
normalisation factor, to account for variations in the amount of starting DNA template added to each
ddPCR reaction (see Appendix 3 for details).

ddPCR testing
The numbers of infected recruit-sized oysters were estimated using a droplet digital polymerase chain
reaction (ddPCR) assay (Bilewitch et al. 2018). A subsample of heart imprints from oysters that tested
positive by ddPCR were also examined to estimate prevalence. Oysters that tested negative for Bonamia
using ddPCR analysis was assumed to also be negative for heart imprints. A randomly selected

10 • Foveaux Strait oyster and Bonamia surveys February 2020 Fisheries New Zealand
subsample of samples that tested negative by ddPCR was also examined. The numbers of non-fatally
and fatally infected oysters were estimated from Bonamia intensity of infection scores derived from
heart imprints using the categorical scale of Diggles et al. (2003) and scaled-up to the size of the recruit-
sized oyster population by strata, and for the Bonamia and stock assessment survey areas.

A detailed account of the ddPCR method and testing is given by Bilewitch et al. (2018). This method
adapts a previous qPCR assay for the duplex amplification of the Bonamia target (ITS region of the
ribosomal genes) plus the Ostrea chilensis β-actin gene (as an internal control) (Maas et al. 2013). The
ddPCR method uses a high-throughput format that is capable of Bonamia detection and quantification
through a validated modification of the prior qPCR assay.
Heart imprints
The categorical score from heart imprints (see Table A3.1, Appendix 3) assumes that category 0 oysters
are not infected. The previous study by Diggles et al. (2003) suggested that stages 1 and 2 Bonamia
infections are relatively light and do not appear to adversely affect the host; i.e., they are non-fatal.
Stage 3 infections are much more elevated and systemic and are associated with minor tissue damage
throughout the host. It is likely that stage 3 infections will almost always progress to stage 4 (Diggles
et al. 2003). Stage 4 infections are systemic, and all tissues are congested with infected haemocytes;
death appears inevitable. Stage 5 infections differ from those of stage 4 in that tissue damage is extreme
throughout the animal, tissues have lost their integrity, and the oyster is near death. Stages 3–5 Bonamia
infections represent fatal infections.

Relative infection levels from ddPCR increase slowly at heart imprint scores 1 and 2. At intensifying
levels of infection (heart imprint score 3) and fatal infections (scores 4 & 5), the relative level of
infection from ddPCR increases rapidly (see Figure A3.3, Appendix 3).

Mean intensity estimated from heart imprints is the mean frequency of stages 1–5 oysters (i.e., the mean
stage of all oysters examined that had at least one Bonamia cell observed). Exact 95% confidence
intervals are given for prevalence, determined from the F-distribution; i.e., for a proportion π, where
π = r/n (where r is the number of oysters infected with Bonamia and n the number of oysters in the
sample), the 95% confidence interval is determined by:

from heart imprint samples only

 0.025 =
 + ( − + 1) 0.025,2 −2 +2,2
 + 1
 0.975 =
 + 1 + ( − ) 1−0.975,2 +2,2 −2

Population estimates of non-fatal and fatal Bonamia infection
Two methods were used to scale fatal and non-fatal infections to population estimates for recruit-sized
oysters only, following the procedures in section 2.2. These estimates are presented by stratum, for the
Bonamia survey area and stock assessment survey area. Method 1 used a correction factor from strata
with three or more randomly selected stations only, i.e., target stations were not included. Method 2
used the total numbers of oysters in each Bonamia infection category (1–5) based on the estimated
proportion of oysters in each infection category in the sample, and scaled to the total catch for each
station. The overall intensity was calculated as the average Bonamia level in the population. Variance
for prevalence and intensity were estimated using standard methods as for population estimates.

3.5 Method to evaluate the best future stock projection from the 2017 OYU 5
 assessment

Under the new management plan for OYU 5, stock assessments are carried out five-yearly, with annual
population and Bonamia surveys between assessments. The last assessment was completed in 2017
(Large et al. 2018) updating the stock assessment models with data on recruitment, harvest, catch rates,

Fisheries New Zealand Foveaux Strait oyster and Bonamia surveys February 2020 • 11
population size, and mortality (mostly mortality from Bonamia during epizootics). Three projections of
future stock status were based on 0%, 10%, and 20% disease mortality.

Projections from the 2009 stock assessment based on a TACC of 15 million oysters, and with no
mortality of oysters from Bonamia, predicted an increase in recruit-sized stock abundance of 29% by
2012; however, with a Bonamia mortality of 10%, the population size was expected to increase by only
11% over the same period (Fu & Dunn 2009; Fu 2013). Bonamia mortality was about 10% between
2009 and 2012; and the estimated mortality of recruit-sized oysters between the 2009 survey and the
2012 survey was about 198 million oysters. The population size of recruit-sized oysters increased by
21% between the 2009 and 2012 surveys. If the estimated post-survey mortality in 2012 (81 million
oysters) is taken into account, the population size of recruit-sized oysters increased by 13.5%, consistent
with the 2009 stock assessment. The 2012 stock assessment based on a TACC of 15 million oysters
predicted the population size to remain similar or decline by 23% with 10% and 20% mortality,
respectively. The recruit-sized population decreased by 44.5% in 2015 (509.9 million oysters), more
than expected because recruitment had been very low since 2010.

It is proposed that selecting the most appropriate projection for future stock status is determined by
expert opinion based on the level of summer mortality from Bonamia and trends in the population sizes
of small and pre-recruit oysters. When these simplistic indicators were previously used to select the
most appropriate projection, the predicted population estimates were similar to the estimates of
population size from subsequent surveys.

4. RESULTS

Sea conditions were unseasonably rough over the February 2020 survey period. The survey started a
week later than normal; however, was completed in the usual time of six survey days. The weather was
good during sampling and tides were mostly swift, spring tides. Observations from the survey suggest
little pre-survey mortality (few new clocks), including the eastern fishery areas where mortality has
historically been high. The distribution of oysters was widespread. Fewer survey tows recorded counts
of 500 or more recruit-sized oysters,10% of stations in 2020, a little less than in 2019 and 2018. Only
one of the 72 tows recorded no recruit-sized oysters. There was good growth in some areas, facilitating
an increase in recruit-sized oysters. Many of these oysters were legal-sized, but not yet commercial-
sized. Large numbers of spat and 1–3 year-old oysters were observed on oysters in many areas in 2020.

Dredge efficiency is thought to be greatly reduced in areas densely populated with käeo (Pyura
pachydermatina) because the dredge skims above the seabed with little or no contact. Large numbers
of käeo and very few oysters were caught in stratum E4 (stations 53 and 55) and stratum C5a (stations
33 and 34). Oyster density was most likely underestimated at these stations.

The efficiency of dredge sampling during the 2020 survey was consistent with previous surveys. Dredge
tow lengths were almost all about 0.2 nautical miles (371 m) in length. Wind speeds were less than 10
knots, and sea conditions and dredge saturation were similar to previous surveys (Appendix 4, Figures
A4.1–A4.3).

4.1 Survey operational detail

NIWA and the BOMC staff began the survey on the 13th of February 2020 and finished on the 20th of
February, sampling on six days during this period. The oyster vessel F.V. Golden Quest successfully
sampled all 72 stations. The locations of survey tows are shown in Figure 2, and the numbers of stations
sampled in each stratum are given in Table 3. A few allocated stations couldn’t be sampled because of
rough ground; first-phase stations 24, 39, 46, and 129 (was to replace station 46), were replaced by
stations 88, 116, and 130, respectively. All five second-phase stations were sampled at their allocated
stations.

12 • Foveaux Strait oyster and Bonamia surveys February 2020 Fisheries New Zealand
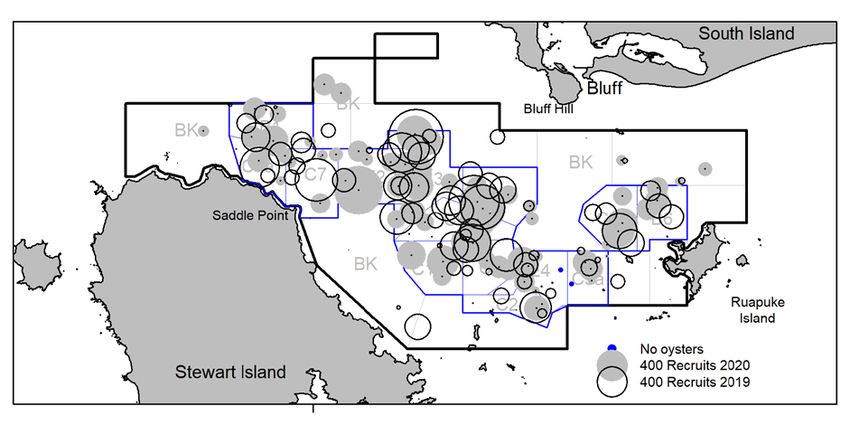
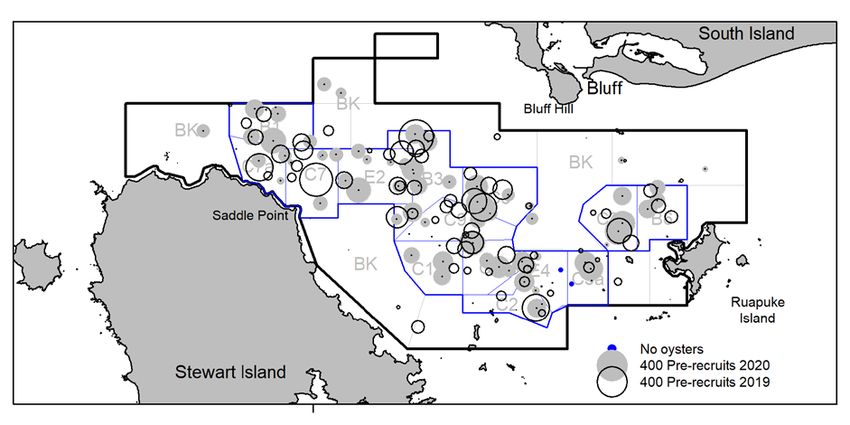
Twenty-five recruit-sized oysters were randomly sampled from each station, to provide tissue samples
for ddPCR and heart imprints (n=25) and histology (n=5). Target sample size was achieved from 66 of
the 72 stations. For samples with fewer than 25 recruit-sized oysters, samples included pre-recruit and
small oysters: station 53 (n=16, mostly small), 55 (n=19, mostly small), 34 (n=22, mostly small), 1
(n=25, mostly small), and 33 (n=25, mostly recruit size). No oysters were sampled at station 3. Oyster
samples were couriered to NIWA Wellington where they were processed for heart imprints and ddPCR.
Oyster tissues were also taken for histology and these were archived for future research.

4.2 Oyster abundance

Changes in oyster densities between 2018 and 2020
Plots of catches adjusted to the standard tow length (0.2 nautical miles) from the 2018, 2019, and 2020
surveys for recruit-sized, pre-recruit, and small oysters, and their means and 95% confidence intervals
by stratum are shown in Figures 3–5 respectively. Strata are arranged west to east with northern strata
at similar longitudes shown before those to the south. Catches of all size classes were spatially patchy.
Low catches of all three size groups of oysters in stratum C5a may be due to reduced dredge efficiency
caused by dense stands of käeo. Catches of these size groups in the background stratum (BK) were
similar or lower.

At stratum level, catches of recruit-sized oysters generally varied by region across the fishery area
(Figure 3). Strata east of a line between Saddle Point (Stewart Island) and North Head (Ruapuke Island)
(E2, B3, C9, C1a, C5, C8, C3, and B6) had similar or higher catches in 2020 compared with those in
2018 and 2019. Some strata in the western fishery area (C7and B3) had lower catches in 2020
(Figure 3).

Catches of pre-recruit-sized oysters in 2020 were generally more variable than in 2018 and 2019
(Figure 4). Generally higher catches were from strata B1, E2, B3, C1a, C5, C8, C5a, C3, and B6. The
catches of pre-recruits in strata C7and C7a were lower in 2020 than in 2018 and 2019, and BK remained
low throughout (Figure 4).

Catches of small oysters were consistently higher in 2020 than in 2018 and 2019, except in stratum BK
(Figure 5). The number of small oysters reflects the trend of increasing recruitment to the population
indicated by spat monitoring.

Fisheries New Zealand Foveaux Strait oyster and Bonamia surveys February 2020 • 13
Figure 3: The numbers of recruit-sized oysters (≥ 58 mm in diameter) per tow, means (grey symbols matching shape showing survey year), and 95% confidence
 intervals (grey lines) by stratum for surveys during 2018–2020. Tow numbers are adjusted to a standard tow length of 0.2 nautical miles. Numbers from
 the 2018 survey are shown as light green filled circles, 2019 as blue filled triangles, and 2020 as tan filled diamonds. Bonamia survey strata are arranged
 west to east with northern strata at similar longitudes shown first and the background stratum (BK) furthermost right.

14 • Foveaux Strait oyster and Bonamia surveys February 2020 Fisheries New Zealand
Figure 4: The numbers of pre-recruit- oysters (≥ 50–57 mm in diameter) per tow, means (grey symbols matching shape showing survey year), and 95% confidence
 intervals (grey lines) by stratum for surveys during 2018–2020. Tow numbers are adjusted to a standard tow length of 0.2 nautical miles. Numbers from
 the 2018 survey are shown as light green filled circles, 2019 as blue filled triangles, and 2020 as tan filled diamonds. Bonamia survey strata are arranged
 west to east with northern strata at similar longitudes shown first and the background stratum (BK) furthermost right.

Fisheries New Zealand Foveaux Strait oyster and Bonamia surveys February 2020 • 15
Figure 5: The numbers of small oysters (10–49 mm in diameter) per tow, means (grey symbols matching shape showing survey year), and 95% confidence intervals
 (grey lines) by stratum for surveys during 2018–2020. Tow numbers are adjusted to a standard tow length of 0.2 nautical miles. Numbers from the 2018
 survey are shown as light green filled circles, 2019 as blue filled triangles, and 2020 as tan filled diamonds. Bonamia survey strata are arranged west to east
 with northern strata at similar longitudes shown first and the background stratum (BK) furthermost right.

16 • Foveaux Strait oyster and Bonamia surveys February 2020 Fisheries New Zealand
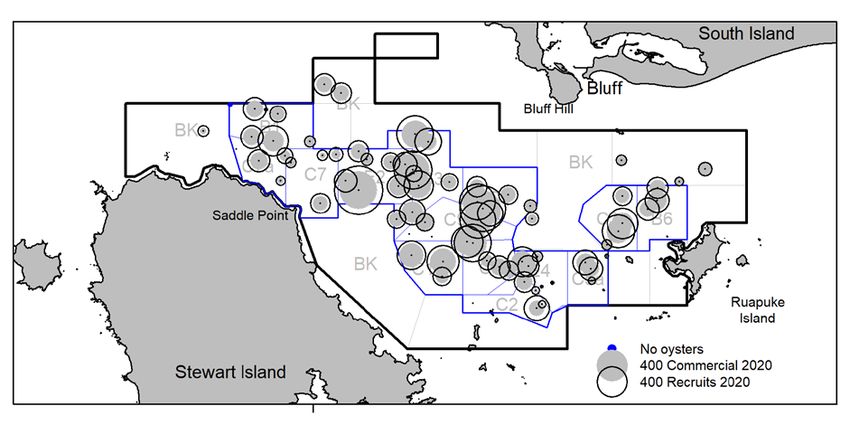
Survey estimates of population size
Estimates of absolute population size for commercial-sized, recruit, pre-recruit, and small oysters from
the February 2020 survey are given by stratum in Tables 4–7: for the core strata (n= 14: B1, B3, B6,
C1a, C2, C3, C5, C5a, C7, C7a, C8, C9, E2, and E4), all core strata combined, the background stratum
(all background strata combined (BK), n= 12: B1a, B1b, B2, B2a, B2b, B4, B5, B6b, B7, C4, C6, and
C6a), and the whole 2007 stock assessment survey area (Survey total). The population estimates in the
Bonamia survey area for recruit-sized, pre-recruit, and small oysters from the 2012 and 2016–2020
surveys are shown in Table 8, and for 2012, and 2014–2020 in Figure 6. Fisheries Assessment Reports
for Foveaux Strait oyster and Bonamia surveys 2010–2019 that provide estimates of oyster density,
population size, and CVs for all size groups are referenced in Table A6.1 (Appendix 6).

Comparisons between the population estimates for the background stratum should be made with caution
because there were only 5 stations sampled in total. Bootstrapped estimates of 95% confidence intervals
(B.lower and B.upper) were made by resampling a normal distribution where the variance is based on
a CV and the error of the estimated dredge efficiency. Bootstrapped estimates are likely to better
represent the true range of estimates from this patchily distributed population.

Fishers high-grade their catches (return the smaller oysters that are above minimum legal size) to
maximise the numbers of first grade oysters. The density and population size of commercial-sized
oysters were estimated for the first time in 2019 (Table 4) and represent the size group retained by
fishers. Of the recruit-sized population, 59.6% was of commercial size in the core strata and 57.3% in
the stock assessment survey area in 2020 (Tables 4 & 5), similar to the 59.0% of commercial size in the
core strata and 61.9% in the stock assessment survey area in 2019. The population size in core strata in
2020 was similar to that in 2019 (declined by 0.8%, Table 4). Mean density in the core strata was 0.64
oysters m-2 in 2020 (0.65 oysters m-2 in 2019) and ranged from 0.21 to 1.30 oysters m-2 in 2020
(Table 4). Oyster densities for strata C5a and E4 are likely to be underestimated.

The density and population size of recruit-sized oysters in core strata in 2020 were similar to 2019. The
population size declined by 2.3% (Table 5). The mean density in core strata declined from 1.40 oysters
m-2 in 2012 to 1.09 oysters m-2 in 2014, further declined to 0.71 oysters m-2 in 2015, and remained at a
similar level until 2017 (0.78 oysters m-2 in 2016 and 0.74 oysters m-2 in 2017) before increasing in
2018 to 1.00 oysters m-2, increasing further in 2019 to 1.10 oysters m-2 and remaining similar at 1.08
oysters m-2 in 2020 (see Tables 5 & 8). Usually an increase in recruit-sized oyster density results in an
increased catch rate; however, large numbers of fast growing and thin legal-sized oysters were not of
commercial size. The density of recruit-sized oysters in the background stratum is not likely to be well
estimated by recent surveys (since 2017) due to the low numbers of stations sampled (n=5) over a large
area (578.4 km2). Mean recruit-sized oyster density in the background stratum was 76% (0.82 oysters
m-2) of that in the Bonamia survey area in 2019 (Table 5), higher than between 2017 and 2019 (0.56,
0.67, and 0.28 oysters m-2, respectively).

The population size of recruit-sized oysters in core strata declined from 688.1 million oysters in 2012
to 363.6 million oysters in 2017, increased to 494.1 million oysters in 2018, further increased to 542.5
million oysters in 2019, and remained similar in 2020 with 529.9 million oysters. Between 2012 and
2019, data from 55 stations produced CVs for all core strata combined between 8.0% and 13.0%. The
population size in BK increased from 230.3 million oysters in 2012 to 482.9 million oysters in 2014,
declined with a varying trend to 163.9 million oysters in 2017, increased to 389.2 million oysters in
2018, decreased to 325.5 million oysters in 2019, and increased to 349.4 million oysters in 2020. The
CVs have increased from 19.7% in 2012 (stations sampled, n=62), to 59.0% in 2018 (n=5), but
decreased to 17% in 2019 and 13% in 2020. It is not likely that the five stations are a good representation
of the size of the oyster population in the background stratum despite the size of the 2020 CV, and
caution is advised when population estimates from the stock assessment survey area are compared.
Recruit-sized oyster population sizes (and mean densities) increased in half of the strata in 2020
(Table 5). Increases in population size ranged from about 5.4% to 253.1% and decreases ranged from
2.3% to 71.2% (Table 5).

Fisheries New Zealand Foveaux Strait oyster and Bonamia surveys February 2020 • 17
Pre-recruit mean oyster densities in all core strata combined declined from 0.60 oysters m-2 in 2012, to
0.25 oysters m-2 in 2017 in a fluctuating trend, and increased to 0.36 oysters m-2 in 2018, 0.44 oysters
m-2 in 2019, and 0.54 oysters m-2 in 2020 (Table 6). The population size declined from 297.4 million
oysters in 2012 to 89.2 million oysters in 2015, increased to 216.5 million oysters in 2019, and further
increased to 265.3 million oysters in 2020. Pre-recruit population size increased by 22.5% between
2019 and 2020 (Table 6), in addition to the 21.4% between 2018 and 2019. The population size in the
background stratum was similar between 2017 and 2018, 45.0 million oysters and 47.4 million oysters
respectively, doubled to 93.4 million oysters in 2019, and almost doubled again to 171.3 million oysters
in 2020 (Table 6). The population size in the 2007 stock assessment survey area increased by 37.2%
from 225.8 million oysters in 2018 to 309.8 million oysters in 2019 and increased further to 436.6
million oysters in 2020. Pre-recruit oyster population sizes (and mean densities) increased in all but
three strata between 2019 and 2020 (Table 6). Increases in population size ranged from about 0.7% to
1266.8% and decreases ranged from 27.5% to 65.9% (Table 6).

The mean densities and population sizes of small oysters for all the core strata combined declined
markedly (65%) from 451.3 million oysters in 2012 to 156.3 million oysters in 2014 and increased to
261.9 million oysters in 2017, 401.8 million oysters in 2018, 595.8 million oysters in 2019, and further
increased by 76.6 % to 1052.4 million oysters in 2020 (Table 7). The population in the background
stratum remained similar between 2012 (160.9 million oysters) and 2014 (156.3 million oysters), but
declined to 99.7 million oysters in 2017, increased to 150.8 million oysters in 2018, to 272.0 million
oysters in 2019, and further increased by 11.2% to 304.3 million oysters in 2020 (Table 7). Overall, the
population size of small oysters in the stock assessment survey area declined from 612.2 million oysters
in 2012 to 249.0 million oysters in 2015, then increased to 552.5 million oysters in 2018, to 867.8
million oysters in 2019, and further increased by 56.3% to 1356.7 million oysters in 2020 (Table 7).
Small oyster population sizes (and mean densities) increased (between 14.1% and 976.3%) in all strata
except B3 (decrease by 13.9%) (Table 7).

In 1995 and 1997, Cranfield et al. (1999) estimated Current Annual Yield (CAY) from a “commercial
population” that reflected the patchy distribution of oyster density. Cranfield et al. (1999) defined the
commercial population as the recruited population in the stock assessment survey area above a density
of 400 oysters per tow (equivalent to about 6–8 sacks per hour during commercial dredging). This
threshold was based on a historical, economic catch rate, and when the catch rate dropped below 6 sacks
per hour, fishers would move to new fishery areas. Although this method is no longer used for stock
assessments, estimates of commercial population size allow some comparison with previous years and
the Shellfish Working Group requested that these estimates be included in this report. Table 9 shows
estimates of commercial population size, using the catch of recruit-sized oysters at each station minus
400 oysters, for the 2020 core strata (n= 14), all core strata combined, all background strata combined
(n=12), and for the whole 2007 stock assessment survey area sampled. Ten core strata supported
commercial densities in 2012, six in 2014, two in 2015, six in 2016, three in 2017, five in 2018, six in
2019, and seven in 2020 (B1, B3, C1a, C3, C5, C9, and E2). The mean commercial density in the core
strata was 0.17 oysters m-2 in 2017, increased to 0.37 oysters m-2 in 2018, to 0.41 oysters m-2 in 2019,
and further increased by 18.6% to 0.49 oysters m-2 in 2020. In the background stratum, oyster density
was 0.02 oysters m-2 in 2017, increasing to 0.43 oysters m-2 in 2018, further increasing to 0.56 oysters
m-2 in 2019; however, there were no commercial densities sampled in 2020 (Table 9).

18 • Foveaux Strait oyster and Bonamia surveys February 2020 Fisheries New Zealand
You can also read