Supplement of Seasonal variation and origins of volatile organic compounds observed during 2 years at a western Mediterranean remote background ...
←
→
Page content transcription
If your browser does not render page correctly, please read the page content below
Supplement of Atmos. Chem. Phys., 21, 1449–1484, 2021
https://doi.org/10.5194/acp-21-1449-2021-supplement
© Author(s) 2021. This work is distributed under
the Creative Commons Attribution 4.0 License.

Supplement of
Seasonal variation and origins of volatile organic compounds
observed during 2 years at a western Mediterranean remote
background site (Ersa, Cape Corsica)
Cécile Debevec et al.

Correspondence to: Stéphane Sauvage (stephane.sauvage@imt-lille-douai.fr)
and Cécile Debevec (cecile.debevec@imt-lille-douai.fr)

The copyright of individual parts of the supplement might differ from the CC BY 4.0 License.
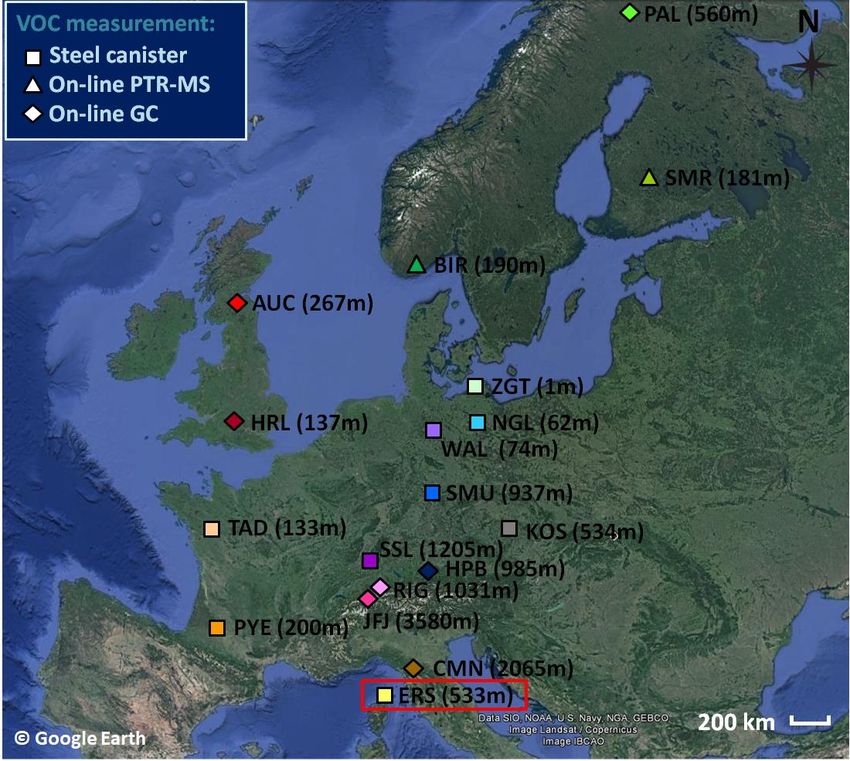
Table S1: Average concentrations ± standard deviations (µg m-3) of selected VOCs measured at Ersa from June 2012 to June 2014
as a function of the measurement sampling time (see Table 1).

 Samples collected Samples collected
 Species
 from 09:00-13:00 from 12:00-16:00
 BVOCs Isoprene 0.08 ± 0.21 0.21 ± 0.35
 α-Pinene 0.13 ± 0.11 0.49 ± 0.71
 Camphene 0.01 ± 0.03 0.03 ± 0.07
 α-Terpinene 0.02 ± 0.03 0.09 ± 0.18
 Limonene 0.08 ± 0.17 0.24 ± 0.34

 Anthropogenic Ethane 2.43 ± 0.70 1.57 ± 0.80
 NMHCs Propane 1.28 ± 0.62 0.81 ± 0.62
 i-Butane 0.36 ± 0.25 0.19 ± 0.16
 n-Butane 0.51 ± 0.29 0.31 ± 0.25
 i-Pentane 0.32 ± 0.26 0.26 ± 0.22
 n-Pentane 0.27 ± 0.28 0.23 ± 0.21
 n-Hexane 0.09 ± 0.06 0.08 ± 0.05
 Ethylene 0.38 ± 0.20 0.30 ± 0.18
 Propene 0.07 ± 0.04 0.07 ± 0.04
 Acetylene 0.31 ± 0.20 0.25 ± 0.27
 Benzene 0.35 ± 0.16 0.30 ± 0.22
 Toluene 0.37 ± 0.26 0.30 ± 0.24
 Ethylbenzene 0.06 ± 0.07 0.05 ± 0.07
 m,p-Xylenes 0.14 ± 0.15 0.15 ± 0.14
 o-Xylene 0.07 ± 0.09 0.09 ± 0.09

 OVOCs Formaldehyde 0.96 ± 0.48 1.82 ± 1.44
 Acetaldehyde 0.68 ± 0.17 1.11 ± 0.44
 i,n-Butanals 0.13 ± 0.07 0.34 ± 0.69
 n-Hexanal 0.15 ± 0.10 0.26 ± 0.32
 Benzaldehyde 0.15 ± 0.12 0.15 ± 0.12
 n-Octanal 0..07 ± 0.05 0.13 ± 0.24
 n-Nonanal 0.49 ± 0.43 0.18 ± 0.15
 n-Decanal 0.43 ± 0.34 0.14 ± 0.13
 n-Undecanal 0.09 ± 0.06 0.06 ± 0.06
 Glyoxal 0.07 ± 0.04 0.07 ± 0.05
 Methylglyoxal 0.07 ± 0.04 0.21 ± 0.16
 Acetone 3.32 ± 1.77 4.84 ± 2.95
 MEK 0.34 ± 0.11 0.37 ± 0.16

 2
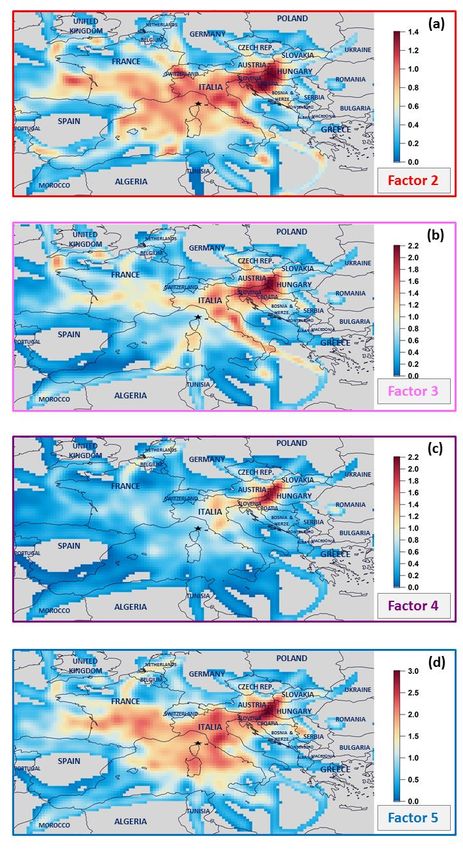
Figure S1: Data collection status indicating when VOC samples were carried out over the two-year period and when concurrent
 ancillary measurements were realized. The numbers indicated within parentheses correspond to the total number of data
 observations.

5

 3

Figure S2: (a) Monthly variations in gas concentrations (CO and O3 expressed in ppb) represented by box plots; the blue solid line,
 the red marker, and the box represent the median, the mean and the interquartile range of the values, respectively. The bottom and
 top of the box depict the first and third quartiles and the ends of the whiskers correspond to the first and ninth deciles. (b) Their
5 monthly average concentrations as a function of the year. Note that gas data used in this study were restricted to periods when VOC
 measurements were realized (Sect. 2.2.2).

 4
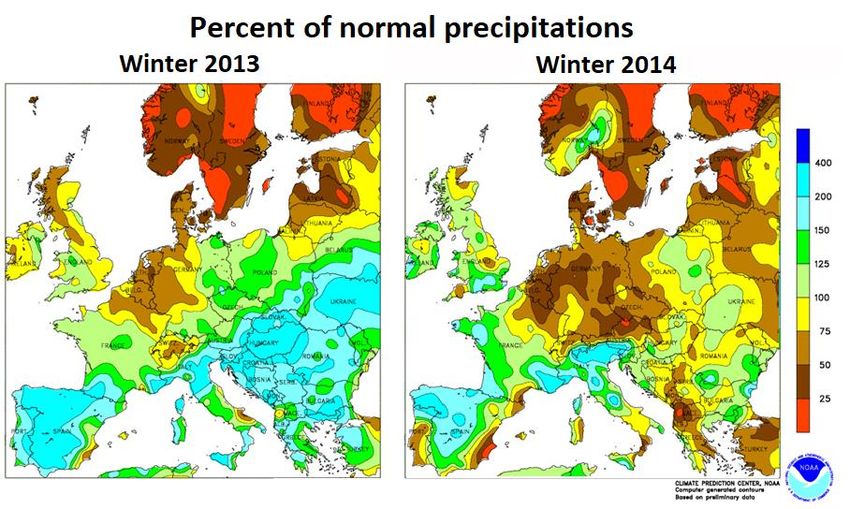
Figure S3: Potential emission area contributions to NMHC anthropogenic sources using the CF model. Contributions are expressed
5 in µg m-3. PMF factors: factor 2 - short-lived anthropogenic sources; factor 3 – evaporative sources; factor 4 – long-lived combustion
 sources; factor 5 – regional background.

 5

6
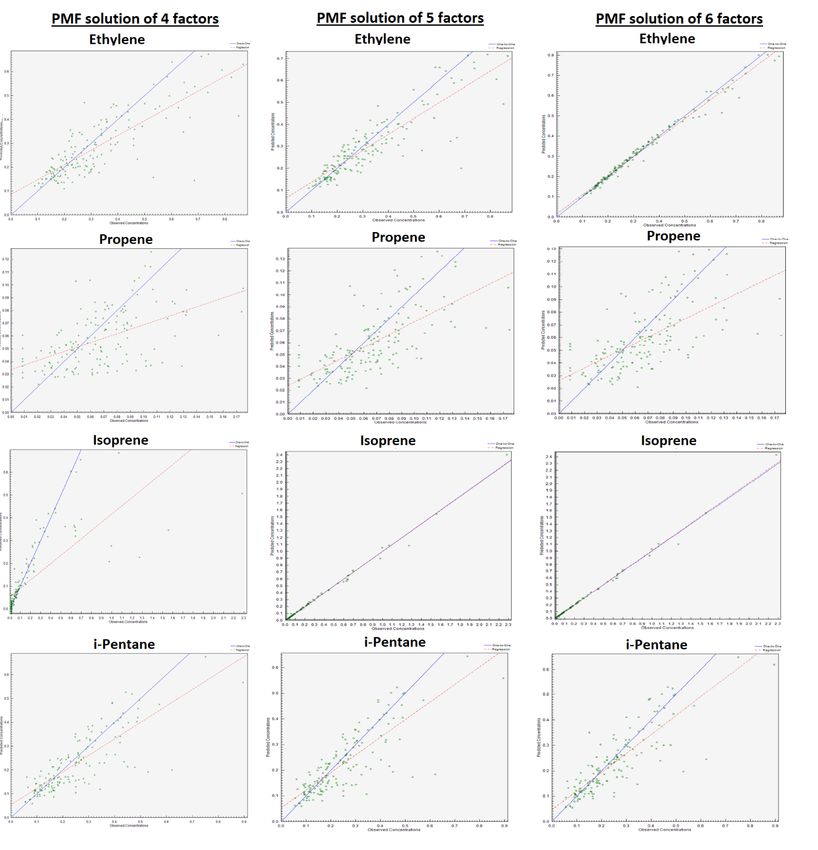
Figure S4: Seasonal (a) and interannual (b) variations in NMHC source contributions (expressed in µg m-3) represented by box plots;
 the blue solid line, the red marker, and the box represent the median, the mean, and the interquartile range of the values,
 respectively. The bottom and top of the box depict the first and third quartiles and the ends of the whiskers correspond to the first
5 and ninth deciles. PMF factors: factor 1 - local biogenic source; factor 2 - short-lived anthropogenic sources; factor 3 – evaporative
 sources; factor 4 – long-lived combustion sources; factor 5 – regional background. Winter: 01/01-31/03 periods – spring: 01/04-30/06
 periods – summer: 01/07-30/09 periods – autumn: 01/10-31/12 periods. Note that the NMHC dataset used for the PMF analysis
 included different sampling time hours (09:00-13:00 or 12:00-16:00) following shifts that occurred during the two-year period (see
 Table 1).

 7
8
5 Figure S5: Normalized temperature anomalies and percent of precipitations in winters 2013 and 2014 in Continental Europe.
 Simulations realized by the Climate Prediction Center (CPC) of the National Oceanic and Atmospheric Administration (NOAA;
 https://www.cpc.ncep.noaa.gov/products/analysis_monitoring/regional_monitoring/europe.html, last access: 11/10/2020).
 Normalized values were calculated by the CPC using the average of monthly (or quarterly) values for the 1981-2010 period.

 9
Section S1: VOCs selected in this study

 In this section, the selection of the VOCs retained for this study among those measured at Ersa during the 2-yr period (see
 Table S2) is presented. Co-eluted VOCs, i.e. n-pentanal+o-tolualdehyde (measured from DNPH cartridges) and 2,3-
 dimethylbutane+cyclopentane (measured from multi-sorbent cartridges), were not considered in this study. Concentrations of
 5 b-pinene resulting from multi-sorbent cartridges were also not considered in this study for analytical reasons.
 17 NMHCs were measured from both steel canisters and multi-sorbent cartridges (underlined species in Table S2)
 and n-hexanal was measured from both DNPH cartridges and multi-sorbent cartridges. Note that consistency between recovery
 species was checked during the intensive field campaign of summer 2013 (see Michoud et al., 2017) and was not checked a
 second time due to the low temporal recovery of the instruments in terms of data points. In this study, concentrations of the 17
10 NMHCs measured from steel canisters were selected given their higher number of observations and lower uncertainties
 compared to those measured with multi-sorbent cartridges. Concentrations of n-hexanal measured using DNPH cartridges
 were selected in this study for the same reason.
 VOC percentages of values below their detection limit (DL) were then examined and VOCs having more than 50%
 of their concentrations below their DL were discarded. This criteria has concerned four NMHCs measured from steel canisters
15 (2,2-dimethylbutane, i-octane, n-octane and 1,2,4-trimethylbenzene), one carbonyl compound measured from DNPH
 cartridges (acrolein) and seven VOCs measured from multi-sorbent cartridges (2-methylhexane, 2,2-dimethylpentane, 2,3-
 dimethylpentane, 2,4-dimethylpentane, 2,2,3-trimethylbutane, 2,3,4-trimethylpentane and 1,3,5-trimethylbenzene).
 Furthermore, VOC average signal-to-noise (S/N) ratios were examined. This parameter determines the average relative
 difference between concentrations and their corresponding uncertainties, thus pondering the results according to their quality
20 (Norris et al, 2014). Species having a S/N ratio below 1.2 were discarded (see Debevec et al, 2017). This criteria has concerned
 three additional NMHCs measured from canisters (2-methylpentane, 3-methylpentane and n-heptane), two additional carbonyl
 compounds measured from DNPH cartridges (propanal and methacrolein) and 14 additional VOCs measured from multi-
 sorbent cartridges (cyclohexane, n-nonane, n-decane, n-undecane, n-dodecane, n-tridecane, n-tetradecane, n-pentadecane, n-
 hexanedecane, 1-hexene, cyclopentene, g-terpinene, styrene and n-heptanal).
25

 10
Table S2: Listed VOCs as a function of group of chemical species and measurement method. Underlined VOCs were measured by
several instruments. Selected VOCs in this study are indicated in bold.

 Group of Steel canisters – GC-FID DNPH cartridges – Solid adsorbent –
 chemical species chemical desorption adsorption/thermal desorption
 (acetonitrile) – HPLC- –
 UV GC-FID
 ALKANES Ethane, propane, i-butane, n- i-Pentane, n-pentane, 2,2-
 butane, i-pentane, n-pentane, 2,2- dimethylbutane, 2,3-
 dimethylbutane, 2-methylpentane, dimethylbutane+cyclopentane, 2-
 3-methylpentane, n-hexane, n- methylpentane, 3-methylpentane,
 heptane, i-octane, n-octane n-hexane, cyclohexane, 2-
 methylhexane, 2,2,3-
 trimethylbutane,
 2,2dimethylpentane, 2,4-
 dimethylpentane, 2,3-
 dimethylpentane, n-heptane,
 2,3,4-trimethylpentane, i-octane,
 n-octane, n-nonane, n-decane, n-
 undecane, n-dodecane, n-
 tridecane, n-tetradecane, n-
 pentandecane, n-hexadecane
 ALKENES Ethylene, propene Cyclopentene, 1-hexene
 ALKYNE Acetylene
 DIENE Isoprene Isoprene
 TERPENES a-Pinene, b-pinene, camphene,
 limonene, a-terpinene, g-
 terpinene
 AROMATICS Benzene, toluene, ethylbenzene, Benzene, toluene, ethylbenzene,
 m,p-xylenes, o-xylene, 1,2,4- m,p-xylenes, o-xylene, styrene,
 trimethylbenzene 1,3,5-trimethylbenzene, 1,2,4-
 trimethylbenzene
 CARBONYL Formaldehyde, Hexanal, n-heptanal, n-octanal,
 COMPOUNDS acetaldehyde, propanal, n-nonanal, n-decanal, n-
 i,n-butanals, n- undecanal
 pentanal+o-
 tolualdehyde, hexanal,
 benzaldehyde, acetone,
 MEK, acrolein,
 methacrolein, glyoxal,
 methylglyoxal

 11
Section S2: Identification and contribution of NMHC major sources by EPA PMF 5.0 approach

 S2.1 PMF approach
 PMF is a tool elaborated for a multivariate factor analysis and used for the identification and the characterization of the “p”
 independent sources of "n” species measured “m” times at a given site. Note that the PMF mathematical theory is detailed
 5 elsewhere (Paatero, 1997; Paatero and Tapper, 1994). Concisely here, the PMF method is based on the decomposition of a
 matrix of chemically speciated sample data (of dimension n x m) into two matrices of factor profiles (n x p) and factor
 contributions (p x m), interpreting each factor as a different source type. Species profiles of each source identified represent
 the repartition of each species into each given factor, and the amount of mass contributed by each factor to each successive
 individual sample represents the evolution in time of the contribution from each factor to the various species. The principle
10 can be condensed as:

 = ∑ =1 × + = + , (1)

 where xij is the ith species measured concentration (in µg m-3 here) in the jth sample, fki the ith mass fraction from kth source,
 g jk the kth source contribution of the jth sample, eij the residual resulting of the decomposition and cij the species reconstructed
 concentration. The Eq. (1) can be solved iteratively by minimizing the residual sum of squares Q following Eq. (2):

 2

15 = ∑ =1 ∑
 =1 ( ) , (2)

 with sij , the extended uncertainty (in µg m-3 here) of the associated xij . A user-provided uncertainty, following the procedure
 presented in Polissar et al. (1998), is hence required by the PMF tool to weight individual points. Moreover, negative source
 contributions are not allowed.

20 S2.2 VOC dataset and data preparation
 In order to have sufficient completeness (in terms of observation number), only NMHC measurements from bi-weekly ambient
 air samples collected into steel canisters from 04 June 2012 to 27 June 2014 were retained in the factorial analysis of this study.
 The NMHC dataset encompassed 152 atmospheric data points having a 4-hour time resolution. VOC observations resulting
 from DNPH and multi-sorbent cartridges were not considered in the PMF analysis since they were sampled only 73 and 52
25 days concurrently to the VOC collection from steel canisters (Fig. S1). Reconstructing the missing data points would
 significantly affect the dataset quality. Additionally, the restriction of the number of data points to those common to the three
 datasets (36 data points) would significantly impact the temporal representativeness of the VOC inputs of the study period and
 would hence limit the examination of interannual and seasonal variations for reasons of statistical robustness. Note that no
 outlier was removed from the dataset.

 12
NMHC inputs were built from the concentrations of the 17 HCNMs, measured from steel canisters, selected in this
 study (see Sect. S1). The chemical dataset includes 13 single variables and a grouped one. This latter named “EX” resulted
 from the grouping of the concentrations of C8 aromatic compounds, in order to maximize its concentration levels.
 The data preprocessing and quality analysis of the VOC PMF dataset are presented in the supplement material of
 5 Debevec et al. (2017). In this study, since signal-to-noise (S/N) ratios of the 14 variables selected in the factorial analysis are
 all higher than 1.2, no variable was categorized as “weak”, and hence downweighted (categorizing variables in “weak” means
 tripling their original uncertainties; Norris et al, 2014).

 S2.3 Selected PMF Solution
10 In order to identify the optimal number of factors for the PMF solution selected in this study, the first step consisted in carrying
 out numerous successive base runs considering an incremented factor number, according to the protocol defined by Sauvage
 et al. (2009). PMF solutions composed of 2 to 10 factors, considering 100 runs and a random start, were explored.
 Firstly, the selection of a solution among PMF solutions of 2 to 10 factors is based on the analysis of diverse
 exploratory statistical parameters (Table S3 and Fig. S6) which are as follows:
15 - Variations in Qtrue and Qtheoretical as a function of the factor number of a PMF solution. Qtrue is provided by the EPA PMF tool
 (Norris et al., 2014) following the launch of a base model run. Qtheoretical is a calculated parameter following the equation (3).
 Qtrue and Qtheoretical tend to decrease when the factor number increases. A PMF user can choose a PMF solution having a lower
 Qtrue compared to the associated Qtheoretical.
 - Variations in IM and IS (maximum individual standard deviation and maximum individual column mean, respectively) as a
20 function of the factor number of a PMF solution. IM and IS can be defined following equations (4) and (5), respectively. A
 PMF user can choose a PMF solution corresponding to a significant break in the slope of IM and/or IS as a function of the
 PMF factor number.
 - Variations in average determination coefficients between reconstructed concentrations of the total variable (called in this
 study TVOC; see Norris et al., 2014) and measured ones (R²(TVOC)). A PMF user can choose a PMF solution of p factors
25 corresponding to a significant increase in R²(TVOC) compared to a PMF solution of p-1 factors.
 - An optimal PMF solution should also present a symmetrical distribution of residual values related to the total variable as well
 as a large proportion of them ranging between -2 and 2, especially between -0.3 and 0.3.

 ∈ [2, 10], ℎ = × − × ( + ), (3)

 with M=152 and N=14 in this study (Sect. S2.2).
 1
30 = max ( ∑
 =1 ) , ∈ [1, ] (4)

 2
 1 ̅̅̅̅̅̅

 = max (√ ∑
 =1 [ − ( )] ) , ∈ [1, ] (5)
 −1

 13
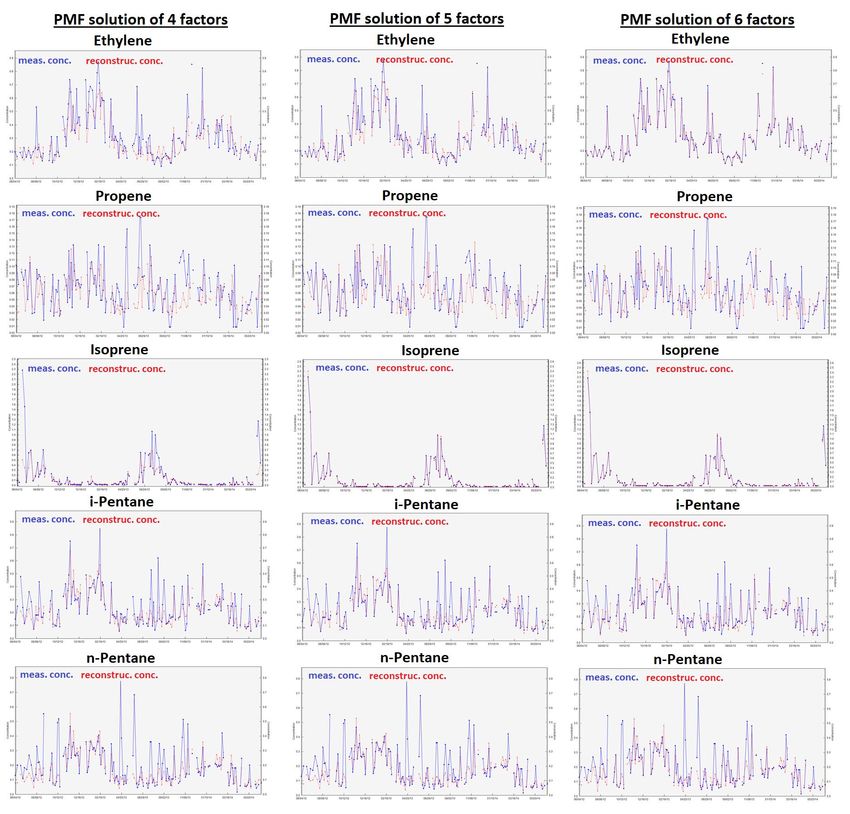
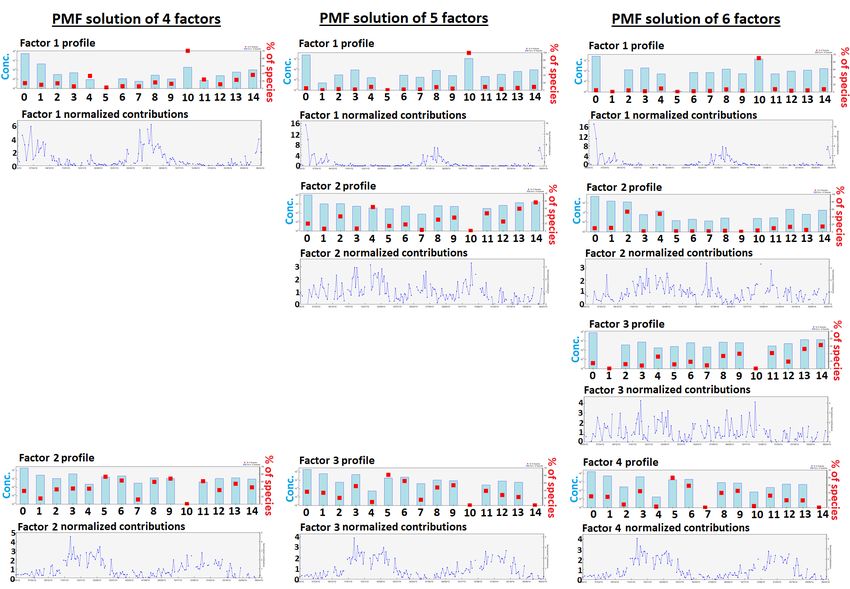
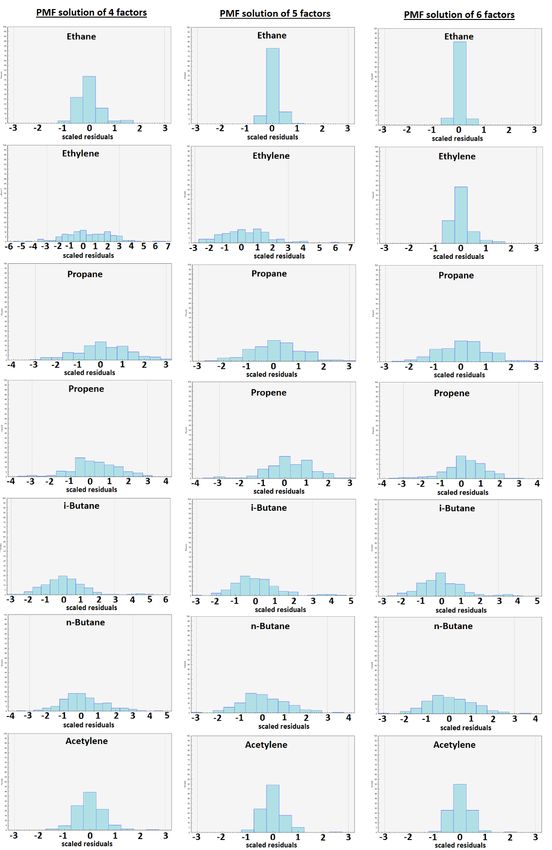
The visual inspection of statistical indicators was realized following Fig. S6. Significant breaks in slope of variations
 in IM as a function of the factor number of a PMF solution were noticed for PMF solutions composed of 3 to 5 factors, 4 to 6
 factors and 7 to 9 factors (Fig. S6c; see also the relative differences d(IM) and d(IS) in Table S3). Moreover, a significant
 break in slope of variations in IS as a function of the factor number of a PMF solution was only noticed for PMF solutions
 5 composed of 5 to 7 factors (Fig. S6d). R²(TVOC) increases significantly between PMF solutions of 3 and 4 factors and to a
 lesser extent between PMF solutions of 4 to 7 factors (Fig. S6e). Contrarily, R²(TVOC) decreases significantly between PMF
 solutions of 7 and 8 factors. However, Qtrue is lower than Qtheoretical from a PMF solution of 8 factors (Fig. S6a). From a PMF
 solution of 4 factors, the proportion of residual values between -2 and 2 is higher than 90% and from a PMF solution of 5
 factors, the proportion of residual values between -0.3 and 0.3 is higher than 40% (Fig. S6b). As a result, we oriented our
10 choice of optimal PMF solution to those of 4 to 6 factors.
 In order to refine this choice, we also examined correlations between reconstructed concentrations and measured ones
 for individual species of the selected PMF solutions (Figs S7-S9 and Table S4), their distribution of residual values (Fig S10),
 the physical meaning of their factor profiles (Fig S11), their factor contribution time series (Fig S11) and correlations between
 their factors. From a PMF solution of 4 factors, the model identified a factor related to a biogenic source (factor 1 depicted in
15 Fig. S11 and related to isoprene concentrations). A better reconstruction of ethane, acetylene and isoprene concentrations was
 noticed for the 4-factor PMF solution (Fig S7). We did not observe any correlation between factors composing the 4-factor
 PMF solution. From a PMF solution of 5 factors, the model distinguished a factor related to the more reactive anthropogenic
 species (factor 2 of the 5-factor PMF solution composed of ethylene, propene, toluene and EX - Fig. S11) from the factor
 associated with evaporation sources (factor 3 composed of propane, i,n-butanes and i,n-pentanes - Fig. S11). These two factors
20 are not correlated (determination coefficient: 0.35). This deconvolution notably improved the reconstruction by the PMF model
 of concentrations of ethylene, propene, toluene and EX (Figs. S7 and S9 and Table S4) and slightly improved the distribution
 of residual values for propene and toluene (Fig. S10). Ethane and isoprene concentrations are fully reconstructed with the PMF
 solution of 5 factors (Fig. S8 and Table S4) and their residual values were more symmetrical and gathered between -1 and 1
 (Fig. S10). The additional factor composing the 6-factor PMF solution compared to the 5-factor one results from the split of
25 the factor related to the more reactive anthropogenic species into two factors. The first one (factor 2 of the 6-factor PMF
 solution – Fig. S11) is mostly composed of ethylene and propene while the second one (factor 3 – Fig. S11) is composed of
 propene, i,n-pentanes, toluene and EX. These two factors are not correlated (determination coefficient: 0.02 – Fig. S11). This
 deconvolution notably improved the reconstruction of ethylene concentrations (Fig. S9 and Table S4), slightly improved the
 reconstruction of i,n-pentanes, toluene and EX concentrations but degraded propene concentration one. In terms of residual
30 value distribution, the 6-factor PMF solution mostly improved the ethylene one (Fig. S10). However, ethylene, propene, i,n-
 pentanes, toluene and EX concentrations observed at Ersa in summer 2013 were mainly explained by the same factor according
 to Michoud et al. (2017), which comforted our choice of a 5-factor PMF solution for this study.

 14
Table S3: Exploratory statistical parameters for the identification of the optimal factor number for the PMF solution of this study.

 Factor Q Q robust Q IM IS Proportion of Proportion of Determination d(IM) d(IS)
 number theoretical mod true residuals residuals > coefficient = (IM(p) - =(IS(p) -
 between [- abs(0,3) PMF results vs IM(p-1)) / IS(p-1)) /
 2 ;2] Meas. (R²) IM(p-1) IS(p-1)
 2 1796 6557 7472 0.9249 3.1160 0.7904 0.8008 0.9653 - -
 3 1630 4352 4749 0.8838 2.5538 0.8604 0.7702 0.9746 0.0444 0.1804
 4 1464 3057 3169 0.4239 1.9464 0.9037 0.7049 0.9879 0.5204 0.2378
 5 1298 2092 2120 0.2659 1.5157 0.9441 0.6109 0.9920 0.3727 0.2213
 6 1132 1545 1547 0.2260 1.1361 0.9615 0.5550 0.9939 0.1503 0.2504
 7 966 1161 1162 0.2255 1.0810 0.9737 0.5028 0.9952 0.0021 0.0485
 8 800 777 777 0.1153 0.9373 0.9864 0.4384 0.9883 0.4885 0.1329
 9 634 558 558 0.1133 0.8282 0.9915 0.3435 0.9873 0.0180 0.1164
 10 468 380 380 0.0939 0.7596 0.9953 0.2740 0.9836 0.1713 0.0828

 Table S4: Evaluation of NMHC concentrations reconstructed by PMF solutions from 4 to 6 factors.

 r² slope intercept
 VOC 4 factors 5 factors 6 factors 4 factors 5 factors 6 factors 4 factors 5 factors 6 factors
 (0) TVOC 0.988 0.992 0.994 1.003 1.013 1.013 -0.034 -0.072 -0.060
 (1) Ethane 0.992 0.998 0.999 0.977 0.994 1.000 0.037 0.009 -0.001
 (2) Ethylene 0.666 0.771 0.985 0.618 0.722 0.938 0.086 0.065 0.017
 (3) Propane 0.950 0.968 0.969 0.990 1.002 1.007 -0.010 -0.013 -0.016
 (4) Propene 0.275 0.454 0.411 0.350 0.534 0.488 0.034 0.024 0.026
 (5) i-Butane 0.894 0.909 0.913 0.820 0.833 0.842 0.033 0.030 0.028
 (6) n-Butane 0.946 0.969 0.969 0.953 0.969 0.968 0.009 0.005 0.006
 (7) Acetylene 0.989 0.993 0.989 0.952 0.971 0.973 0.008 0.006 0.006
 (8) i-Pentane 0.657 0.654 0.712 0.692 0.687 0.743 0.053 0.054 0.046
 (9) n-Pentane 0.328 0.331 0.378 0.421 0.419 0.470 0.082 0.082 0.077
 (10) Isoprene 0.568 0.995 0.995 0.362 0.998 1.009 0.054 -0.0004 -0.002
 (11) n-Hexane 0.560 0.537 0.582 0.546 0.546 0.583 0.029 0.029 0.027
 (12) Benzene 0.898 0.918 0.908 0.858 0.896 0.867 0.031 0.022 0.029
 (13) Toluene 0.539 0.600 0.630 0.467 0.597 0.677 0.113 0.090 0.083
 (14) EX 0.342 0.536 0.623 0.332 0.548 0.665 0.134 0.102 0.079
5

 15
Figure S6: Variations in exploratory statistical parameters as a function of the factor number of a PMF solution.

 16
Figure S7: Correlations between NMHC concentrations reconstructed by the PMF model and measured ones as a function of the
factor number of a PMF solution.

 17
18
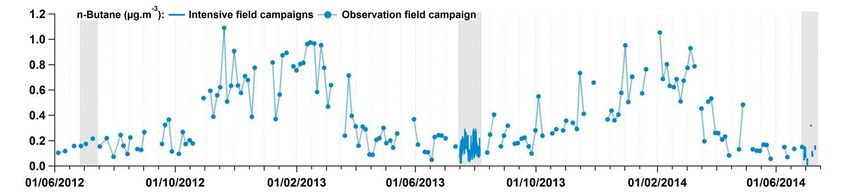
Figure S8: Time series of NMHC concentrations reconstructed by PMF solutions from 4 to 6 factors compared to NMHC measured concentrations. Note
that only results of NMHCs not well reconstructed by the PMF model (r² < 0.85, see Table S4) are presented.

 19
20
Figure S9: Scatter plots of NMHC concentrations reconstructed by PMF solutions from 4 to 6 factors and NMHC measured
concentrations. Note that only results of NMHCs not well reconstructed by the PMF model (r² < 0.85, see Table S4) are presented.

 21
22
Figure S10: Distributions of scaled residuals of NMHC concentrations reconstructed by PMF solutions from 4 to 6 factors.

 23
24
Figure S11: Factor profiles and normalized contribution time series of PMF solutions from 4 to 6 factors. Note that NMHCs numbered 0-14 are listed in
Table S4.

 25
S2.4 Optimization of the selected PMF solution
 Generally, the non-negativity constraint alone is considered insufficient to obtain a unique solution. In order to reduce the
 number of solutions, one possible approach is to rotate a given solution and assess the obtained results with the initial solution.
 5 The optimization of the 5-factor PMF solution selected in this study relies on the exploration of the rotational freedom of this
 solution by acting on the Fpeak parameter (Paatero et al., 2005; Paatero et al., 2002), following recommendations of Norris et
 al. (2014), so as to reach an optimized final solution. As a result, a Fpeak parameter fixed at 0.8 and applied to the selected PMF
 solution allowed a finer decomposition of the NMHC dataset following an acceptable change of the Q-value (Norris et al.,
 2014).
10 Quality indicators provided by the EPA PMF application have been indicated in Table S5. The PMF model results
 reconstructed on average 99% of the total concentration of the 14 variables incorporated in this factorial analysis. Individually,
 almost all chemical species also showed both good determination coefficients and slopes (close to 1 – Table S4) between
 reconstructed and measured concentrations, apart from propene, n-pentane, n-hexane and EX (see Fig. S9). The PMF model
 reconstructed well variations in concentrations of these species over long periods (Fig. S8) but not over short-periods,
15 explaining their lower determination coefficients and their slopes farther from 1 (Table S4). Therefore, PMF model limitations
 to explain concentrations of these species should be kept in mind when examining PMF results.

 Table S5: Input information and mathematical diagnostic for the PMF analysis results of this study.

 Input information
 Samples N 152
 Variables M 14
 Factors P 5
 Runs 100
 Nb. Species indicated as weak 0
 Fpeak 0.8
 Model quality
 Q robust Q(r) 2589.7
 Q true Q(t) 2119.9
 Maximum individual standard deviation IM 0.27
 Maximum individual column mean IS 1.52
 Mean ratio (modelled vs. measured) Slope(TVOC) 1.01
 TVOCmodelled vs. TVOCmeasured R²(TVOC) 0.99
 Nb. of species with R2 > 0.6 10
 Nb. of species with 1.1 > slope > 0.6 9

 26
The evaluation of rotational ambiguity and random errors in a given PMF solution can be realized with DISP
 (displacement) and BS (bootstrap) error estimation methods (Brown et al., 2015; Norris et al., 2014; Paatero et al., 2014). As
 no factor swap occurred in the DISP analysis results, the 5-factor PMF solution selected in this study is considered adequately
 robust to be interpreted. Bootstrapping was then realized by performing 100 runs, and considering a random seed, a block size
 5 of 18 samples and a minimum Pearson correlation coefficient of 0.6. Each modeled factor of the selected PMF solution was
 well mapped over at least 95% of realized runs, assuring their reproducibility.
 Moreover, since sampling time of NMHC measurements from canister shifted several times during the two years of
 the study period (Table 1), correlations between reconstructed and measured NMHC concentrations as a function of sampling
 period were investigated (Table S6). Slightly different correlation results were observed for observations resulting from
10 samples collected from 12:00-16:00 UTC (from early June 2012 to late October 2012 and from early January 2013 to late
 October 2013) compared to those collected from 09:00-13:00 UTC (from early November 2012 to late December 2012 and
 from early November 2013 to late June 2014). The PMF model slightly overestimated TVOC concentrations resulting from
 samples collected from 09:00-13:00 and slightly underestimated those collected from 12:00-16:00, mostly due to
 reconstruction of ethane and propane concentrations in both cases. Concerning more reactive NMHCs, ethylene, i-butane,
15 isoprene, toluene and EX concentrations are better reconstructed with samples collected from 12:00-16:00 while propene, i-
 pentane, n-pentane and n-hexane concentrations are better reconstructed with those from 09:00-13:00. The most impacted
 species by sampling time shifts was n-pentane, since the PMF model did not identify the sources influencing the high
 concentrations of n-pentane observed over short periods (see Fig S9) and which were mostly noticeable with the 12:00-16:00
 sample set. More generally, the influence of sampling time shifts on PMF results also depends on the frequency and the
20 amplitude of NMHC concentration variations over short periods for the two sample sets.

 27
Table S6: Evaluation of NMHC concentrations reconstructed by the PMF model as a function of the sampling time shift.

 Samples collected from 09:00- Samples collected from 12:00-
 All period
 13:00 UTC 16:00 UTC
 slope intercept r² slope intercept r² slope intercept r²
 Ethane 0.997 0.006 0.999 0.986 0.029 0.996 1.002 0.001 0.999
 Ethylene 0.727 0.064 0.779 0.593 0.111 0.673 0.796 0.044 0.827
 Propane 1.000 -0.011 0.968 0.929 0.052 0.949 1.046 -0.035 0.977
 Propene 0.534 0.024 0.438 0.632 0.018 0.489 0.497 0.026 0.418
 i-Butane 0.832 0.029 0.897 0.761 0.056 0.869 0.893 0.015 0.904
 n-Butane 0.967 0.004 0.963 0.954 0.010 0.957 0.975 0.002 0.961
 Acetylene 0.952 0.008 0.975 0.991 0.003 0.991 0.941 0.007 0.972
 i-Pentane 0.686 0.053 0.644 0.783 0.054 0.765 0.623 0.052 0.600
 n-Pentane 0.421 0.081 0.332 0.852 0.032 0.788 0.295 0.085 0.238
 Isoprene 0.956 0.005 0.996 0.872 0.005 0.996 0.971 0.006 0.998
 n-Hexane 0.510 0.032 0.519 0.668 0.026 0.738 0.419 0.035 0.410
 Benzene 0.889 0.022 0.895 0.918 0.027 0.849 0.873 0.018 0.911
 Toluene 0.582 0.092 0.599 0.526 0.105 0.501 0.626 0.083 0.669
 EX 0.527 0.103 0.515 0.452 0.112 0.431 0.582 0.095 0.578
 TVOC 1.004 -0.186 0.992 0.988 -0.083 0.987 1.009 -0.213 0.993

 28
Section S3: Identification of potential emission areas by CF approach

 In order to investigate potential emission regions contributing to long-distance pollution transport to the receptor site, PMF
 source contributions were coupled with back-trajectories of air masses following a statistical approach. To achieve this, the
 concentration field (CF) statistical method established by Seibert et al (1994) was chosen in the present study.
 5 The CF approach relies on the attribution of concentrations of a variable measured at a receptor site along back-
 trajectories of air masses arriving at this site. In a second step, the trajectory map is gridded so that concentrations attributed
 to a given cell are weighted by the residence time spent by air parcels in the considered cell (Eq. (3); Michoud et al., 2017):

 ∑
 =1 log( )× − 1
 ̅̅̅ij ) =
 log(C = ∑
 =1 log( ) × − , (3)
 ∑
 =1 −

 with ̅̅̅
 Cij the concentration attributed to the ijth grid cell, CL the concentration observed when the back-trajectory L reached the
10 measurement site, nij−L the number of points of the back-trajectory L contained in the ijth grid cell, nij the number of points of
 the total number of back-trajectories contained in the ijth grid cell, and M the total number of back-trajectories.

 29
Section S4: Comparisons of VOC measurements with other ones performed at Ersa

 Additional VOC measurements were realized during summer campaigns performed in 2012, 2013 and 2014 (Table S7). One
 hundred of 3-h-integrated air samples were collected at Ersa on DNPH cartridges from 29 June to 11 July 2012 at a frequency
 of 8 samples per day. These air samples were collected and analyzed following the same protocol as the one presented in Sect.
 5 2.2.1. Additionally, the ChArMEx SOP-1b (special observation period 1b) field campaign took place at Ersa from 15 July to
 5 August 2013. During this intensive field campaign, more than 80 VOCs were measured by different on-line and off-line
 techniques, which were deeply presented in Michoud et al. (2017) and summarized in Table S7. Formaldehyde measurements
 realized during the SOP-1b field campaign with DNPH cartridges are also used in this study. Finally, around 70 3-h-integrated
 air samples were collected at Ersa from 26 June to 10 July 2014 on DNPH cartridges (54 samples realized at a frequency of 4
10 cartridges per day from 6h-18h UTC) or on stainless steel canisters (20 samples realized at a frequency of 3 canisters per day
 from 9h-18h UTC). These air samples were collected and analyzed following the same protocol as the one presented in Sect.
 2.2.1. All these measurements were confronted with the two years of VOC measurements investigated in this study, in order
 to examine the representativeness of the study period in terms of summer concentration levels and variations. Time series of
 concentrations of selected VOCs, biogenic and anthropogenic compounds and OVOCs, are depicted in Figs S12-S14,
15 respectively.

 Table S7: Technical details of the set-up for VOC measurement during the intensive field campaigns realized at Ersa in summers
 2012, 2013 and 2014.

 Time
 Field campaign Instrument Species observations used in this study References
 resolution

 Detournay,
 formaldehyde, acetaldehyde, acetone and
 Summer 2012 Off-line DNPH 180 min 2011; Detournay
 MEK
 et al., 2013
 On-line Michoud et al.,
 10 min isoprene, acetaldehyde, acetone and MEK
 PTR-TOF-MS 2017
 ethane, propane, n-butane, n-pentane, Michoud et al.,
 On-line GC-FID-FID 90 min
 ethylene, acetylene, benzene 2017
 Summer 2013
 (SOP-1b) Michoud et al.,
 On-line GC-FID-MS 90 min α-pinene, β-pinene and limonene
 2017
 Detournay,
 Off-line DNPH 180 min formaldehyde 2011; Detournay
 et al., 2013
 Detournay,
 formaldehyde, acetaldehyde, acetone and
 Off-line DNPH 180 min 2011; Detournay
 MEK
 Summer 2014 et al., 2013
 Off-line steel ethane, propane, n-butane, n-pentane, Sauvage et al.,
 180 min
 canisters ethylene, acetylene, benzene, isoprene 2009
20

 30
During the SOP-1b field campaign, biogenic compounds were measured on-line by different techniques (proton
 transfer reaction time-of-flight mass spectrometer - PTR-TOF-MS - or GC-FID-MS; Table S7). In summer 2013,
 concentrations of α-pinene measured during the SOP-1b field campaign were of the same range as those measured off-line
 5 during the 2-yr field campaign. Isoprene concentrations were observed at higher concentrations during the SOP-1b
 (concentrations up to 3.5 µg m-3 – Fig. S12), which can be partly related to the finer time resolution and the better temporal
 coverage of these measurements. Note that isoprene daily maximal concentrations measured during the SOP-1b campaign
 were variable in relation to temperature variations (Kalogridis, 2014; Michoud et al., 2017). Additionally, isoprene
 concentrations measured during the summer 2014 field campaign were low, in agreement with those observed in June 2014
10 during the 2-yr field campaign.

 Figure S12: Concentration time series of a selection of biogenic VOCs (expressed in µg m-3) measured during the different field
15 campaigns conducted at Ersa. Grey rectangles pinpoint periods when intensive field campaigns were realized. Time is given in UTC.

 Anthropogenic VOC concentrations were measured with an on-line GC-FID-FID during the SOP-1b field campaign
 and from stainless steel canisters during the summer 2014 field campaign (Table S7). Whatever their lifetime in the
 atmosphere, low anthropogenic VOC concentration levels were noticed during the summer field campaigns carried out in 2013
20 and 2014 (Fig. S13), in agreement with seasonal variations described in Sect. 3.4.2. These findings can suggest that the annual
 temporal coverage of VOC measurements realized over the two years was sufficiently adapted to well characterize VOC
 concentration variations (at seasonal scale).

 31
5
10

 32
5

 Figure S13: Concentration time series of a selection of anthropogenic VOCs (expressed in µg m-3) measured during the different
 field campaigns conducted at Ersa. Grey rectangles pinpoint periods when intensive field campaigns were realized. Time is given
 in UTC.

10
 During the summer field campaigns carried out in 2012 and 2014, OVOCs were measured off-line using DNPH
 cartridges. During the SOP-1b field campaign, they were also measured with a PTR-TOF-MS (Table S7). OVOC concentration
 levels during the three summer field campaigns (Fig. S14) were consistent with seasonal variations described in Sect. 3.4.3.

 33
5

 Figure S14: Concentration time series of a selection of oxygenated VOCs (expressed in µg m-3) measured during the different field
 campaigns conducted at Ersa. Grey rectangles pinpoint periods when intensive field campaigns were realized. Time is given in UTC.

10

 34
Section S5: Comparisons of VOC source apportionment with previous one performed at Ersa

 Figure S15 compares average relative contributions of PMF factors (modelled with two different datasets and presented in this
 study and Michoud et al., 2017) to VOC concentrations monitored at Ersa during the two-year and the summer 2013 study
 periods. Note that the SOP-1b factorial analysis was realized considering additional primary NMHCs (2-methyl-2-butene+1-
 5 pentene, 2,2-dimethylbutane, undecane+camphor, C9-aromatics; which represented 2% of the total mass of the NMHCs
 considered in this PMF analysis) and non-speciated monoterpenes (19%), which were measured with automatic analysers
 deployed at Ersa only during the SOP-1b field campaign (Sect. S4).

10 Figure S15: Factor relative contributions (expressed in %) to VOC concentrations of the 2-yr period (on the left) compared to factor
 relative contributions to VOC concentrations of the SOP-1b (on the right).

 Firstly, the local biogenic source (factor 1 – this study) was mainly composed of isoprene like the SOP-1b primary
 biogenic factor. The latter also explained a large portion of monoterpene concentrations along with from 11 to 15% of some
15 OVOC concentrations (carboxylic acids, methanol and acetone). The SOP-1b primary biogenic factor contributed 14% to the

 35
VOC total mass measured in summer 2013, partly considering the contribution of OVOCs to this factor (~60% of the factor
 contribution). The local biogenic source contribution was only 4% to the total mass of the NMHCs selected in the PMF analysis
 of this study but its contribution was higher in summer (12 and 15% during summers 2012 and 2013, respectively).
 Short-lived anthropogenic sources (factor 2 – this study) explained a large portion of ethylene, propene, toluene and
 5 C8 aromatic compound concentrations observed at Ersa during the 2-yr period, in agreement with SOP-1b short-lived
 anthropogenic factor contributions to those measured in summer 2013. These two factors contributed similarly to their
 respective VOC total mass observed at the Ersa station (19 and 23% for short-lived anthropogenic sources and the SOP-1b
 short-lived anthropogenic factor, respectively). Note that some OVOCs contributed significantly to the SOP-1b short-lived
 anthropogenic factor, such as carboxylic acids and acetone (~ 61% of the factor contribution), enhancing the relative
10 contribution of this factor to the VOC total mass.
 Evaporative sources (factor 3 – this study) and the SOP-1b medium-lived anthropogenic factor have chemical profiles
 marked by C4-C6 alkanes. Nevertheless, a higher portion of i-butane and n-butane concentrations observed at Ersa during the
 2-yr period was explained by evaporative sources than those measured in summer 2013 which were attributed to SOP-1b
 medium-lived anthropogenic factor contributions. The SOP-1b medium-lived anthropogenic factor contributed 12% to VOC
15 summer 2013 concentrations while evaporative source contribution to NMHC concentrations measured during two years was
 22%, partly considering their higher contribution in winter (see Sect. 4.2). Evaporative sources and the SOP-1b medium-lived
 anthropogenic factor were of the same origins, as they showed higher contributions when Ersa received French and European
 air masses.
 The SOP-1b long-lived anthropogenic factor was mainly composed of ethane, acetylene, propane and benzene, in
20 agreement with chemical profiles characterizing long-lived combustion sources (factor 4 – this study) and regional background
 (factor 5 – this study). Regional background and long-lived combustion sources fully explained ethane and acetylene
 concentrations, respectively, while the SOP-1b long-lived anthropogenic factor explained only 58% of ethane concentrations
 and 44% of acetylene concentrations. These findings can suggest that the PMF model applied to the 2-yr NMHC dataset mostly
 pinpointed distant origins impacting ethane and acetylene concentrations measured at Ersa, which may be related to the
25 temporal coverage and the time resolution of VOC measurements of the 2-yr period. Moreover, the PMF solution of this study
 allowed to deconvolve long-lived combustion sources, partly attributed to residential heating (Sect. 3.5.4), from the regional
 background, and to highlight contributions higher for regional background (39% to total mass of selected NMHCs) than for
 long-lived combustion sources (16%). The high temperature in summer probably induced a limited use of heating systems that
 could explain why the PMF analysis performed with the SOP-1b VOC dataset did not identify separately these two source
30 categories as well as the relatively low contribution of the SOP-1b long-lived anthropogenic factor to the total VOC mass
 (16%). Note that winter contributions of regional background and long-lived combustion sources showed different interannual
 variations during the 2-yr study period (see Sect. 4.2), which may have participated in the deconvolution of these sources by
 the PMF model. The SOP-1b long-lived anthropogenic factor, long-lived combustion sources and regional background were
 of the same regional origins as they showed higher contributions especially when Ersa received European air masses.

 36
Nevertheless, the time resolution of VOC measurement of the 2-yr period (see Sect. 2.2.1) and the limited number of
 sampling days during this study period (Fig. S1) did not help to support the clear deconvolution of the 5 factors composing the
 PMF solution of this study. Indeed, factors related to anthropogenic sources were quite correlated between them (Pearson
 correlation factors from 0.1 to 0.8; the highest ones were noticed for sources mainly of regional origins; Sect. 3.5) while SOP-
 5 1b anthropogenic sources were not (Pearson correlation factors from -0.5 to 0.1).
 Finally, the incorporation of OVOCs in the SOP-1b factorial analysis allowed to identify and characterize two
 secondary source categories, namely secondary biogenic factor and oxygenated factor. Secondary biogenic factor contributed
 only 6% to VOC summer 2013 mass and was mainly composed of methyl vinyl ketone, methacrolein, pinonaldehyde and
 nopinone. These compounds are specific oxidation products of primary biogenic VOCs (isoprene, α-pinene and β-pinene)
10 which were emitted in the vicinity of the Ersa site (Michoud et al., 2017). Oxygenated factor was mainly composed of
 carboxylic acids (this factor explained 54, 43 and 28% of formic acid, acetic acid and propionic acid concentrations,
 respectively), alcohols (e.g. 49% of methanol concentrations) and carbonyl compounds (e.g. 57, 18 and 21% of acetone,
 acetaldehyde and MEK concentrations, respectively). Most of these species can result from the photochemical oxidation of
 both anthropogenic and biogenic VOCs. Oxygenated factor was found to be the largest contributor to VOC summer 2013
15 concentrations observed at Ersa (28% of the total VOC mass). Michoud et al. (2017) concluded that OVOCs monitored at Ersa
 in summer 2013 were approximately half oxidation products of VOCs and half primary VOCs.

 37
Section S6: Examination of a summer 2013 PMF solution realized considering only the NMHCs selected in the factorial
 analysis of this study

 We modelled a summer 2013 PMF solution composed of 4 factors, as 4 primary sources were identified in Michoud et al.
 (2017; Sect. S5), considering a subset of NMHC data composed only of 13 variables (those selected for the 2-yr PMF solution
 5 of this study, at the exception of n-hexane which was not measured in summer 2013 at a 90-min time resolution). We compared
 this solution with the PMF solution modelled by Michoud et al. (2017) and results are presented in Figs. S16 and S17. The
 same species dominantly composed the paired factor profiles of the two PMF solutions (Fig. S16) suggesting that the 13
 variables selected for the factorial analysis of this study included key tracers of the primary sources influencing VOC summer
 2013 concentrations observed at Ersa. The primary biogenic source of the PMF solution modelled with the VOC subset (factor
10 4 – Fig. S16) is composed of a lower proportion of anthropogenic NMHCs and a higher isoprene one than the primary biogenic
 factor modelled by Michoud et al. (2017). NMHCs composing anthropogenic sources in low proportions tend to have been
 reduced with the 4-factor PMF solution (factors 1-3 – Fig. S16), suggesting a better deconvolution of these sources, at the
 exception of ethane proportion in the chemical profile of short-lived anthropogenic sources (factor 3) which increased.
 Concerning factor contribution variations (Fig. S17), medium-lived anthropogenic sources and the primary biogenic source
15 showed the same variability with the two PMF solutions (determination coefficients: 0.85-0.89). Similar results were noticed
 for long-lived anthropogenic sources (determination coefficient: 0.72), at the exception of the last days of the summer 2013
 study period. However, short-lived anthropogenic sources have shown different day-to-day variations as a function of the PMF
 solution, even if factor contribution variations globally followed the same pattern (Fig. S17). This factor contribution
 variability seems to be not only influenced by the variations in concentrations of reactive selected NMHCs composing it (Fig.
20 S16) but can be also induced by other species such as ethane (for the factor of the PMF solution modelled with the subset), C9
 aromatics, 2-methylfuran and OVOCs (carboxylic acids, acetone, isopropanol and n-hexanal; for the factor of the PMF solution
 modelled by Michoud et al., 2017). Note that formic acid, acetic acid, and acetone concentrations corresponded to 42% of the
 measured VOC concentrations selected in the factorial analysis of Michoud et al. (2017).

 38
Figure S16: Chemical profiles (percent of each species apportioned to each factor - %) of the 4-factor PMF solution (13 variables;
 blue bars) compared to a selection of VOCs composing chemical profiles of the 4 primary sources identified in Michoud et al. (2017)
 owing to a 6-factor PMF solution (42 variables; red bars).

5

 39
Figure S17: Times series (on the left) and scatter plots (on the right) of contributions (in ppt) of factors composing the 4-factor PMF
 solution (13 variables; blue lines) compared to the 4 primary sources identified in Michoud et al. (2017) owing to a 6-factor PMF
 solution (42 variables; red lines).
5

 40
Section S7: Concurrent NMHC measurements performed at other European background monitoring stations

 From June 2012 to June 2014, NMHC measurements were concurrently conducted at 17 other European background
 monitoring stations. These European stations are part of EMEP and GAW networks. Figure S18 shows their geographical
 distribution. They cover a large part of western and central Europe from Corsica Island in the south to northern Scandinavia
 5 in the north, they are located at different altitudes (up to 3580 m a.s.l.) and most of them are categorized as GAW ‘regional
 stations for Europe’. More information on these stations can be found on EMEP
 (https://www.nilu.no/projects/ccc/sitedescriptions/index.html, last access: 11/10/2020) or GAW station information system
 (https://gawsis.meteoswiss.ch/GAWSIS//index.html#/, last access: 11/10/2020) websites. NMHC measurements were realized
 by different on-line (GC or proton-transfer-reaction mass spectrometer - PTR-MS) or off-line techniques (VOCs collected by
10 steel canisters) and were reported to the EMEP EBAS database (http://ebas.nilu.no/Default.aspx, last access: 11/10/2020).

 41
Figure S18: Locations of 18 European monitoring stations where NMHC measurements were conducted from June 2012 to June
 2014. These stations are part of EMEP/GAW networks. They are characterized by their GAW identification and the altitudes are
 given within brackets in reference to standard sea level. AUC, BIR, ERS, KOS, NGL, PYE, RIG, SMR, SSL and TAD stations are
 5 categorized as GAW ‘regional stations for Europe’. CMN, HPB, JFJ and PAL stations are categorized as GAW ‘global stations’.
 AHRL, SMU, WAL and ZGT stations are considered as GAW ‘other elements stations in Europe’, more precisely, ZGT is a ‘coastal
 station’ while HRL, SMU and WAL are ‘rural stations’. Note that high-altitude stations such as CMN and HPB stations could be
 frequently in free-tropospheric conditions. The Ersa site (GAW identification: ERS) is underlined in red. Square markers indicate
 that VOCs were collected by steel canisters and analysed thereafter at laboratories (i.e. off-line measurements). Triangle and
10 diamond markers indicate that VOC measurements were conducted in-situ using PTR-MS or GC analysers, respectively. NMap
 provided by Google Earth Pro software (v.7.3.3 image Landsat/Copernicus – IBCAO; data SIO, NOAA, U.S, Navy, NGA, GEBCO;
 © Google Earth).

 42
References

 Brown, S. G., Eberly, S., Paatero, P., and Norris, G. A.: Methods for estimating uncertainty in PMF solutions: Examples with
 ambient air, and water quality data, and guidance on reporting PMF results, Sci. Total Environ., 518–519, 626–635,
 doi:10.1016/j.scitotenv.2015.01.022, 2015.
 5 Debevec, C., Sauvage, S., Gros, V., Sciare, J., Pikridas, M., Stavroulas, I., Salameh, T., Leonardis, T., Gaudion, V., Depelchin,
 L., Fronval, I., Sarda-Esteve, R., Baisnée, D., Bonsang, B., Savvides, C., Vrekoussis, M., and Locoge, N.: Origin, and
 variability in volatile organic compounds observed at an Eastern Mediterranean background site (Cyprus), Atmos. Chem.
 Phys., 17, 11355–11388, doi:10.5194/acp-17-11355-2017, 2017.
 Detournay, A., Sauvage, S., Locoge, N., Gaudion, V., Leonardis, T., Fronval, I., Kaluzny, P., and Galloo, J. C.: Development
10 of a sampling method for the simultaneous monitoring of straight-chain alkanes, straight-chain saturated carbonyl
 compounds, and monoterpenes in remote areas, J. Environ. Monit., 13, 983–990, doi:10.1039/c0em00354a, 2011.
 Detournay, A., Sauvage, S., Riffault, V., Wroblewski, A., and Locoge, N.: Source, and behavior of isoprenoid compounds at
 a southern France remote site, Atmos. Environ., 77, 272–282, doi:10.1016/j.atmosenv.2013.03.041, 2013.
 Kalogridis, A.: Caractérisation des composés organiques volatils en région méditerranéenne, Université Paris Sud - Paris XI,
15 available at: https://tel.archives-ouvertes.fr/tel-01165005 (last access: 14 June 2020), 2014.
 Michoud, V., Sciare, J., Sauvage, S., Dusanter, S., Léonardis, T., Gros, V., Kalogridis, C., Zannoni, N., Féron, A., Petit, J. E.,
 Crenn, V., Baisnée, D., Sarda-Estève, R., Bonnaire, N., Marchand, N., Dewitt, H. L., Pey, J., Colomb, A., Gheusi, F., Szidat,
 S., Stavroulas, I., Borbon, A., and Locoge, N.: Organic carbon at a remote site of the western Mediterranean Basin: Sources,
 and chemistry during the ChArMEx SOP2 field experiment, Atmos. Chem. Phys., 17, 8837–8865, doi:10.5194/acp-17-
20 8837-2017, 2017.
 Norris, G., Duvall, R., Brown, S., and Bai, S.: EPA Positive Matrix Factorization (PMF) 5.0 Fundamentals, and User Guide
 Prepared for the US Environmental Protection Agency Office of Research, and Development, Washington, DC. [online]
 Available from: https://www.epa.gov/sites/production/files/2015-02/documents/pmf_5.0_user_guide.pdf (last access: 11
 October 2020), 2014.
25 Paatero, P.: Least squares formulation of robust non-negative factor analysis, Chemom. Intell. Lab. Syst., 37, 23–35,
 doi:10.1016/S0169-7439(96)00044-5, 1997.
 Paatero, P., and Tapper, U.: Positive matrix factorization: A non‐negative factor model with optimal utilization of error
 estimates of data values, Environmetrics, 5, 111–126, doi:10.1002/env.3170050203, 1994.
 Paatero, P., Eberly, S., Brown, S. G., and Norris, G. A.: Methods for estimating uncertainty in factor analytic solutions, Atmos.
30 Meas. Tech., 7, 781–797, doi:10.5194/amt-7-781-2014, 2014.
 Paatero, P., Hopke, P. K., Song, X. H., and Ramadan, Z.: Understanding, and controlling rotations in factor analytic models,
 Chemom. Intell. Lab. Syst., 60, 253–264, doi:10.1016/S0169-7439(01)00200-3, 2002.
 Paatero, P., Hopke, P. K., Begum, B. A., and Biswas, S. K.: A graphical diagnostic method for assessing the rotation in factor
 analytical models of atmospheric pollution, Atmos. Environ., 39, 193–201, doi:10.1016/j.atmosenv.2004.08.018, 2005.
35 Polissar, A. V., Hopke, P. K., Paatero, P., Malm, W. C., and Sisler, J. F.: Atmospheric aerosol over Alaska 2. Elemental
 composition, and sources, J. Geophys. Res. Atmos., 103, 19045–19057, doi:10.1029/98JD01212, 1998.
 Sauvage, S., Plaisance, H., Locoge, N., Wroblewski, A., Coddeville, P., and Galloo, J. C.: Long term measurement, and source
 apportionment of non-methane hydrocarbons in three French rural areas, Atmos. Environ., 43, 2430–2441,
 doi:10.1016/j.atmosenv.2009.02.001, 2009.
40 Seibert, P., Kromp-Kolb, H., Baltensperger, U., Jost, D. T., and Schwikowski, M.: Trajectory analysis of high-alpine air
 pollution data, in Air Pollution Modeling, and Its Application X, NATO · Challenges of Modern Society, vol. 18, edited by
 S.-E. Gryning, and M. M. Millán, 595–596, Springer, Boston, MA., https://doi.org/10.1007/978-1-4615-1817-4_65, 1994.

 43
You can also read