Suitability of Airborne and Terrestrial Laser Scanning for Mapping Tree Crop Structural Metrics for Improved Orchard Management - MDPI
←
→
Page content transcription
If your browser does not render page correctly, please read the page content below
remote sensing
Article
Suitability of Airborne and Terrestrial Laser Scanning
for Mapping Tree Crop Structural Metrics for
Improved Orchard Management
Dan Wu 1 , Kasper Johansen 1,2, * , Stuart Phinn 1         and Andrew Robson 3
 1    Remote Sensing Research Centre, School of Earth and Environmental Sciences, The University of
      Queensland, St Lucia, QLD 4072, Australia; d.wu@uqconnect.edu.au (D.W.); s.phinn@uq.edu.au (S.P.)
 2    Hydrology, Agriculture and Land Observation Group, Water Desalination and Reuse Center, King Abdullah
      University of Science and Technology, Thuwal 23955-6900, Saudi Arabia
 3    Applied Agricultural Remote Sensing Centre, School of Science and Technology, University of New England,
      Armidale, NSW 2351, Australia; arobson7@une.edu.au
 *    Correspondence: kasper.johansen@kaust.edu.sa; Tel.: +966-545351582

 Received: 8 April 2020; Accepted: 18 May 2020; Published: 21 May 2020

 Abstract: Airborne Laser Scanning (ALS) and Terrestrial Laser Scanning (TLS) systems are useful
 tools for deriving horticultural tree structure estimates. However, there are limited studies to guide
 growers and agronomists on different applications of the two technologies for horticultural tree
 crops, despite the importance of measuring tree structure for pruning practices, yield forecasting,
 tree condition assessment, irrigation and fertilization optimization. Here, we evaluated ALS data
 against near coincident TLS data in avocado, macadamia and mango orchards to demonstrate and
 assess their accuracies and potential application for mapping crown area, fractional cover, maximum
 crown height, and crown volume. ALS and TLS measurements were similar for crown area, fractional
 cover and maximum crown height (coefficient of determination (R2 ) ≥ 0.94, relative root mean square
 error (rRMSE) ≤ 4.47%). Due to the limited ability of ALS data to measure lower branches and within
 crown structure, crown volume estimates from ALS and TLS data were less correlated (R2 = 0.81,
 rRMSE = 42.66%) with the ALS data found to consistently underestimate crown volume. To illustrate
 the effects of different spatial resolution, capacity and coverage of ALS and TLS data, we also
 calculated leaf area, leaf area density and vertical leaf area profile from the TLS data, while canopy
 height, tree row dimensions and tree counts) at the orchard level were calculated from ALS data.
 Our results showed that ALS data have the ability to accurately measure horticultural crown structural
 parameters, which mainly rely on top of crown information, and measurements of hedgerow width,
 length and tree counts at the orchard scale is also achievable. While the use of TLS data to map crown
 structure can only cover a limited number of trees, the assessment of all crown strata is achievable,
 allowing measurements of crown volume, leaf area density and vertical leaf area profile to be derived
 for individual trees. This study provides information for growers and horticultural industries on the
 capacities and achievable mapping accuracies of standard ALS data for calculating crown structural
 attributes of horticultural tree crops.

 Keywords: airborne laser scanning; terrestrial laser scanning; horticulture; tree crops; crown structure;
 crown area; fractional cover; tree height; crown volume

1. Introduction
    The canopy structure of a forest and individual trees influence ecosystem function, carbon cycle,
biophysical processes, wildlife habitat, tree health and productivity [1–3]. For horticultural tree crops,
canopy structure is also important, as it relates to yield, tree condition, light interception, pruning

Remote Sens. 2020, 12, 1647; doi:10.3390/rs12101647                        www.mdpi.com/journal/remotesensing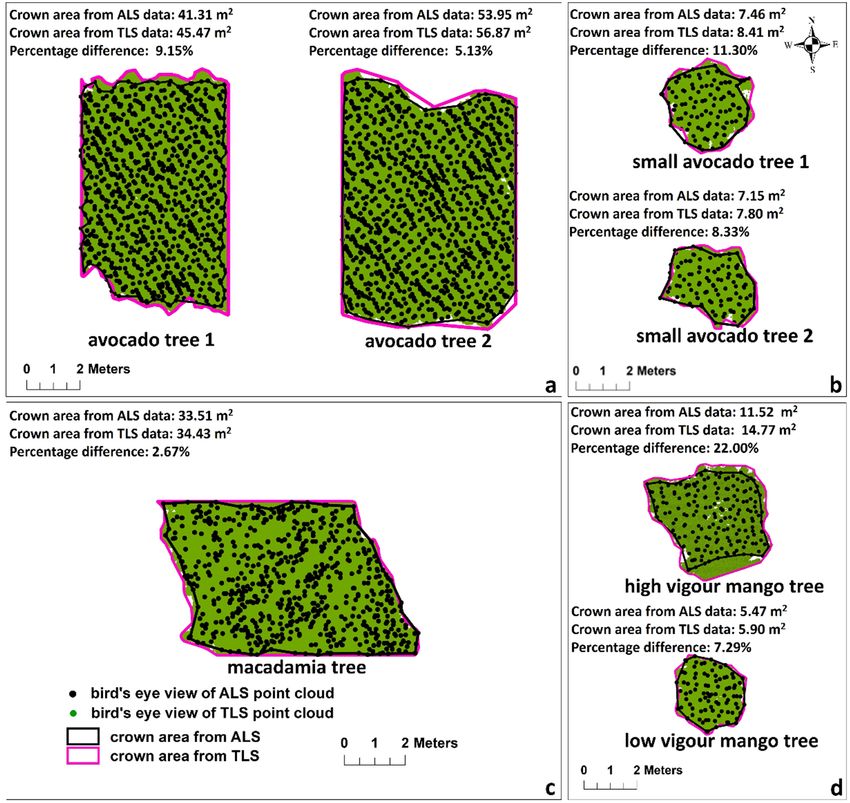
Remote Sens. 2020, 12, 1647                                                                           2 of 23

requirements, irrigation and fertilizer application, and orchard management practices [4–8]. Differing
from forests, horticultural tree crops generally have very short tree stems that have been mechanically
altered via limb removal, and as such, most of the biomass is concentrated in the canopy, and therefore,
canopy structure metrics are of significant interest to growers [9,10]. While forest inventory tends to
focus on crown detection, height and stem diameter, crown characteristics including crown height,
diameter, area and shape are desired parameters for orchard inventories [11]. For horticultural tree
crops, canopy structure influences light interception and distribution within tree crowns, which impact
yield, fruit quality and in some cases, pest and disease susceptibility [5]. The geometric character
of orchard trees is also important, as it can guide pruning, irrigation, fertilization and pesticide
applications and indicate tree health condition and vegetative growth [4,10,12]. It is complicated and
time-consuming to measure crown structure manually [13]. Although remote sensing technologies
have been applied to horticultural tree crop environments over the last decades, the main focus of
remote sensing technologies on mapping canopy structures is in forestry [4,14].
      Light detection and ranging (LiDAR) data have been recognized as the most precise and reliable
technology for canopy structure mapping, as it provides both horizontal and vertical structure
information at the forest and individual tree level [5,12,15–17]. Although LiDAR data have been
applied for structural mapping of horticultural tree crops [4], there is limited information on the level of
detail that LiDAR data can provide and how it may be applied to tree crops in a precision agricultural
setting. While airborne laser scanning (ALS) data have been used for mapping tree crop structure,
including crown height, crown dimension and crown volume [11,18,19], the majority of horticultural
applications have focused on olive and apple trees [9,11,18,19]. Estornell et al. [9] demonstrated that
low point density ALS data (~0.5 points/m2 ) have the potential to estimate wood volume (coefficient of
determination (R2 ) = 0.70) and crown height (R2 = 0.67) of olive trees. With an average point density of
4 points/m2 , Hadas et al. [11] estimated crown height (average error = 19%), crown base height (average
error = 53%), length of the longer diameter and perpendicular diameter (average error = 13% and 9%
respectively) of 25 olive trees. Estornell et al. [18] suggested that medium point density (4 points/m2 )
ALS data underestimated crown volume due to underestimation of maximum crown height and
overestimation of the lowest part of the tree crowns, while crown area was accurately mapped. Crown
area and the maximum ALS intensity values within each tree were identified as the most important
parameters to predict the pruning residual biomass when compared against field measurements
(R2 = 0.89, Root-mean-square error (RMSE) = 2.78 kg) [18]. Jang et al. [19] illustrated that ALS data
underestimated apple tree crown height by about 1 m when compared to field measurements, but the
ALS data (horizontal point spacing < 50 cm) successfully detected 99.4% of trees, except for those with
a height below 1 m. Jang et al. [19] also acknowledged that factors such as crown height, irregular
crown form, centre-opened crown shape and overlapping branches affected crown detection accuracy.
      Terrestrial laser scanning (TLS) data have been used for olive and walnut trees to map individual
crown architecture and advance orchard management [20,21]. Moorthy et al. [21] selected 24 olive
trees to demonstrate that TLS data can produce robust and highly accurate individual tree crown
architecture information. The crown architecture information included tree height, i.e., the difference
in laser pulse reflection from the top of the crown and the ground (R2 = 0.97, RMSE = 0.21 m), crown
width (R2 = 0.97, RMSE = 0.13 m), crown height (the top and bottom extents of the crown) (R2 = 0.86,
RMSE = 0.14 m), crown volume (R2 = 0.99, RMSE = 2.6 m3 ) and Plant Area Index (PAI) (R2 = 0.76,
RMSE = 0.26), defined as the total one-sided leaf and woody area [22]. They suggested that the TLS
system should replace traditional manual field measurements to generate crown structure information
for horticultural tree crops. Fernández-Sarría et al. [20] demonstrated a high correlation between
field and TLS calculated olive tree crown structure information such as crown height (R2 = 0.85),
crown diameter (R2 = 0.92) and crown volume (R2 = 0.87). Similar results for these crown structure
parameters were found in studies of walnut trees, therefore affirming the ability of TLS data to derive
accurate crown structure parameters in horticultural tree crops [23]. Estornell et al. [23] calculated
crown volume, crown diameter and crown height with high accuracy for walnut trees using TLS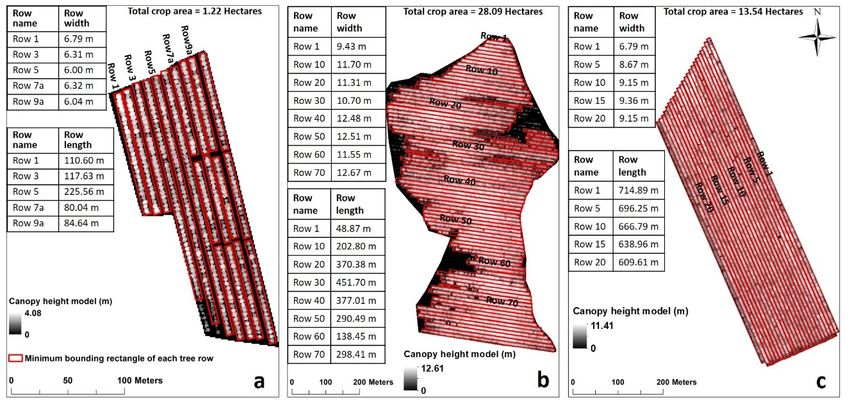
Remote Sens. 2020, 12, 1647                                                                          3 of 23

data. These structure measurements from TLS data showed strong correlations to field measurements.
They also indicated that further research needs to be conducted regarding the most suitable point
density of TLS data required to extract different crown architecture information of horticultural tree
crops, because the size of the TLS dataset can significantly influence the data collection time, the storage
costs and efficiency of data processing. Wu et al. [6] derived tree level leave area (LA), leaf area
density (LAD) and vertical leaf area profile of mango, avocado and macadamia tree crops. This study
demonstrated that TLS technology has the ability to quantify LA, LAD and vertical leaf area profiles for
horticultural tree crops and the LA change derived from TLS data were consistent with the expected
LA changes caused by canopy management, growth and a severe storm.
      ALS and TLS data have been compared for their ability to derive canopy structure information
in forest plantations [24,25]. Factors such as point density, laser footprint size, scan angle and pulse
power can limit the ability of ALS data to measure lower parts of the canopy and stem structure [24].
However, ALS is better suited for assessing the upper canopy due to the aerial perspective during data
acquisition, while TLS can provide more detailed information about the lower canopy with potential
occlusion of the tree apex, depending on tree density, structure and scan angles [25]. Korhonen et
al. [26] estimated crown volume of 77 trees (mainly Scots pine, Norway spruce and birches) in a
boreal forest in southern Finland from ALS data. Due to insufficient returns from the lower canopy,
significant underestimation of crown volume (−24.7% on average) was found when compared against
field measurements. TLS data can provide a much higher spatial resolution than ALS data but with
limited spatial coverage, while ALS data can cover a large area but with a lower point density than
TLS data [25].
      A thorough review of current literature failed to identify any publications comparing ALS and
TLS data for horticultural applications and estimation of crown structure of tree crops. In this paper,
we address this knowledge gap by calculating crown structure information for avocado, macadamia
and mango trees using both ALS and TLS data, including crown area, fractional cover, maximum crown
height, and crown volume. In addition, due to different data resolutions and spatial coverage, LAD, LA
and vertical leaf area profiles were calculated from the TLS data only, while tree row dimensions, crown
height and number of trees at the orchard level were calculated from the ALS data only. The main
objectives of this paper were to: (1) map tree crop (mango, avocado and macadamia) structure
information, including crown area, fractional cover, crown height and crown volume, from ALS data
and evaluate these measurements against TLS data; and (2) compare the practicality, vertical and
horizontal coverage, and scalability of ALS and TLS data for calculating tree crop structure information
for improved orchard management. Based on those objectives, we hypothesize that ALS data can be
used to derive orchard relevant information on crown area, fractional cover, height and crown volume
when evaluated against measurements obtained from TLS data, and that ALS data have capabilities
for deriving tree row and orchard scale information such as row dimensions and number of trees.
This research provides novel findings on mapping tree structure metrics from ALS and TLS data that
may guide growers and agronomists on horticultural tree crop applications.

2. Study Areas and Datasets

2.1. Study Area
     The Bundaberg region is one of the largest horticultural regions in Australia, producing a large
variety of fruit and nuts from tree crops [27]. It has a subtropical climate, with a mean annual
rainfall of 1022 mm (1942–2019), mean maximum temperature of 26.80 ◦ C (1959–2019) and the mean
minimum temperature of 16.40 ◦ C (1959–2019) [28]. Bundaberg produces about 4000 tons of mangoes
a year [29]. It is also one of three major avocado production regions, and the largest and fastest
macadamia-growing region in Australia [30–32]. For this study, two avocado (Persea americana) cv.
Hass trees from commercial orchards and two avocado (Persea americana) cv. Hass trees from a research
station, one macadamia tree (Macadamia integrifolia) cv. Hawaiian Agricultural Experiment Station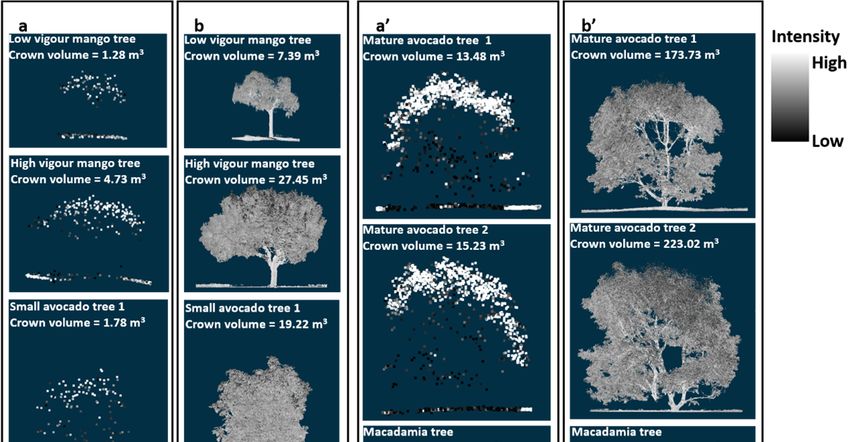
Remote Sens. 2020, 12, 1647 4 of 23
Remote Sens. 2019, 11, x FOR PEER REVIEW 4 of 24
(HAES) 344, and two mango trees (Mangifera indica) cv. Calypso, including a high and low vigour tree,
were selected as representative samples for TLS data collection within the Bundaberg region (Figure 1).
vigour tree, were selected as representative samples for TLS data collection within the Bundaberg
ALS data were collected for the orchards within which these selected trees occurred. The mango,
region (Figure 1). ALS data were collected for the orchards within which these selected trees occurred.
avocado and macadamia orchards covered 1.22, 28.09 and 13.54 ha, respectively. The mango and
The mango, avocado and macadamia orchards covered 1.22, 28.09 and 13.54 ha, respectively. The
macadamia orchards had a spacing of 4 m between trees within a row, while the avocado trees were
mango and macadamia orchards had a spacing of 4 m between trees within a row, while the avocado
planted 5 m apart.
trees were planted 5 m apart.
Figure 1. Unmanned aerial vehicle (UAV) imagery of (a) mango, (b) avocado and (c) macadamia
Figure 1. Unmanned aerial vehicle (UAV) imagery of (a) mango, (b) avocado and (c) macadamia
orchards, and associated field photos of (d) a mango, (e) avocado and (f) macadamia tree.
orchards, and associated field photos of (d) a mango, (e) avocado and (f) macadamia tree.
2.2. Datasets and Methods
2.2. Datasets and Methods
2.2.1. Datasets
2.2.1. Datasets
Crown structure information on avocado, macadamia and mango tree crops was collected from a
RIEGL VZ-400
Crown (RIEGLinformation
structure Laser Measurement
on avocado,Systems GmbH,and
macadamia Horn, Austria)
mango tree TLS
cropssystem on 14 and
was collected 15
from
August
a RIEGL2016.
VZ-400The(RIEGL
RIEGL Laser
VZ-400 TLS system was
Measurement mounted
Systems GmbH, on Horn,
a tripod at a height
Austria) of approximately
TLS system on 14 and
1.5
15 m. With a2016.
August, laserThewavelength of 1550 nm
RIEGL VZ-400 TLSinsystem
the near wasinfrared
mountedpart on
of the spectrum
a tripod at and a beam
a height of
divergence of 0.35 mrad, the RIEGL VZ-400 scanner sends out laser pulses
approximately 1.5 m. With a laser wavelength of 1550 nm in the near infrared part of the spectrum that can reach up to a
distance
and a beamof 350 m and records
divergence of 0.35up to four
mrad, thereturns
RIEGLper emitted
VZ-400 pulse.sends
scanner Through inclination
out laser pulsessensors
that canand an
reach
internal
up to a compass,
distance of the350
RIEGL
m andVZ-400 also up
records collects
to fourpitch, roll and
returns peryaw information.
emitted The RIEGL
pulse. Through VZ-400
inclination
settings are provided
sensors and an internal in compass,
Table 1 and thethe accuracy
RIEGL VZ-400 of the
alsoscanner ±5 mm.
collectsispitch, roll The
and scan resolution of The
yaw information. the
TLS data ◦
is 0.06settings
. Four are
scanprovided
locationsinwere
RIEGL VZ-400 Tableset up around
1 and each tree
the accuracy to scanner
of the minimize occlusion.
is +/–5 mm. The Due to
scan
the narrowof
resolution rowthespacing
TLS data andisthe scanner’s
0.06°. zenith
Four scan view angle
locations set up ◦around
were(30–130 ), a vertical
eachandtreea to90◦minimize
tilt scan
were conducted
occlusion. Due to at the
eachnarrow
scan location for theand
row spacing twothe mature avocado
scanner’s trees
zenith from
view the commercial
angle (30–130°), a orchard
vertical
and
and the macadamia
a 90° tree to
tilt scan were ensure that
conducted at the
eachentire
scan tree was scanned.
location for the twoDue to the avocado
mature time requiredtrees to collect
from the
high-resolution TLS data from multiple scan angles (to minimize occlusion),
commercial orchard and the macadamia tree to ensure that the entire tree was scanned. Due to the seven trees were selected
for
timeevaluating
required to thecollect
tree structural parameters
high-resolution derived
TLS data fromfrom the ALS
multiple scandata.
anglesReflector
(to minimizetargets were set
occlusion),
up around
seven treeseach
weretree and were
selected visible fromthe
for evaluating all tree
scanstructural
locations.parameters
These targets were used
derived fromtothe register
ALS data.and
merge the TLS data collected at all four scan positions for each tree. Further details
Reflector targets were set up around each tree and were visible from all scan locations. These targets about the fieldwork
procedures
were used to can be found
register andin [6]. the TLS data collected at all four scan positions for each tree. Further
merge
details about the fieldwork procedures can be found in [6].
The ALS data were acquired on 31 July, 2016 using an airborne small-footprint RIEGL LMS-Q
1560 LiDAR system with the laser scanner collecting data at 1064 nm (Table 1). The average flying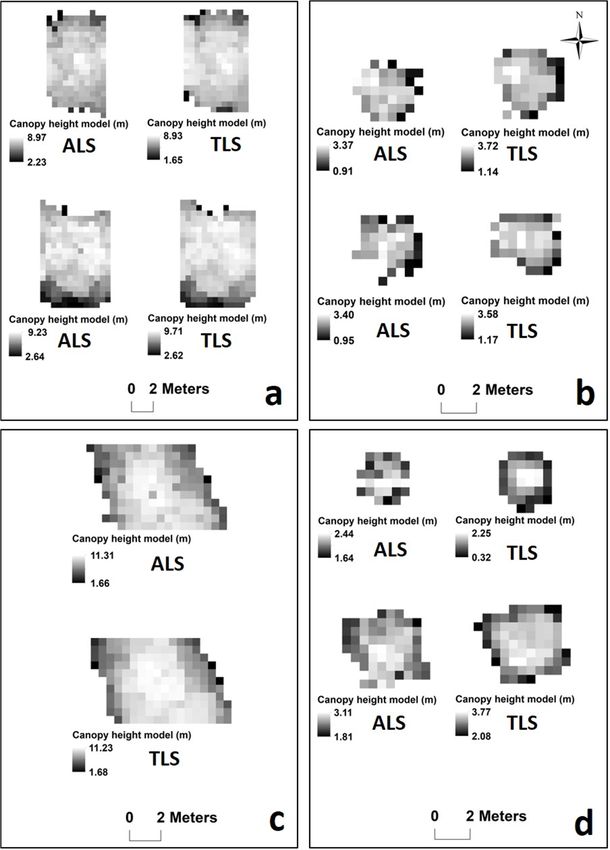
Remote Sens. 2020, 12, 1647                                                                               5 of 23

      Table 1. RIEGL VZ-400 TLS scanner vs. RIEGL LMS-Q 1560 ALS scanner settings and data
      acquisition parameters.

                                  RIEGL VZ-400 TLS Scanner           RIEGL LMS-Q 1560 ALS Scanner
          Beam divergence                   0.35 mrad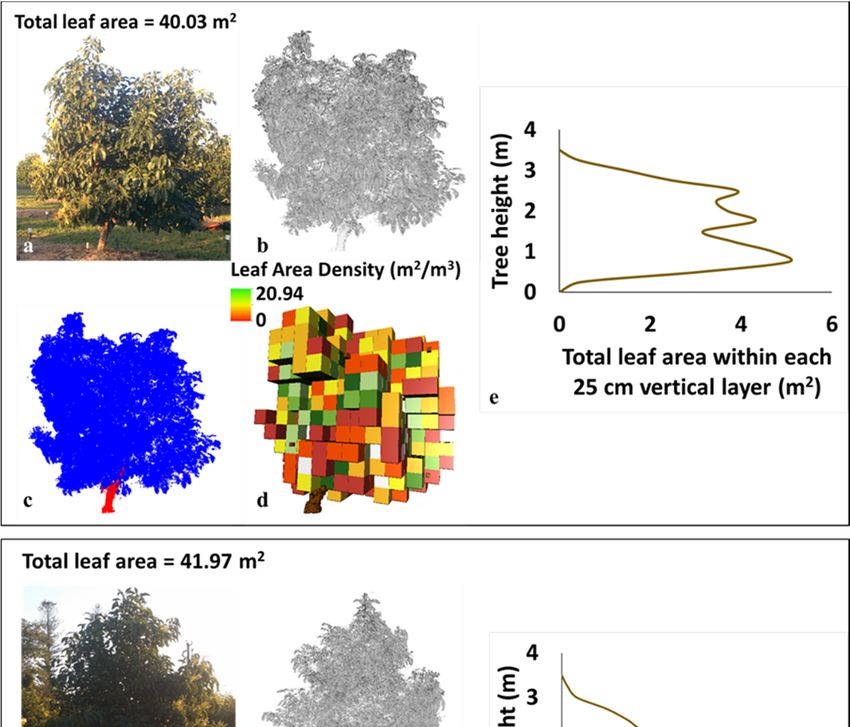
Remote Sens. 2019, 11, x FOR PEER REVIEW 6 of 24
Remote Sens. 2020, 12, 1647 6 of 23
point density. Assuming that there was no occlusion, based on the crown size we gridded the CHM
into 0.5 m grids to calculate the percentage of crown pixels that had a value higher than 0.15 m within
each
grid to grid the
derive to derive the fractional
fractional cover. The cover.
crownTheheight
crownthreshold
height threshold
was setwas set to
to 0.15 0.15
m to m to
omit omit
understory
understory and ground features in the orchards. TLS points were classified as
and ground features in the orchards. TLS points were classified as ground points and non-ground ground points and
non-ground points first using “lasground” and maximum crown height was calculated using
points first using “lasground” and maximum crown height was calculated using “lasgrid” within the
“lasgrid” within the LAStools software, where height was determined by the highest point above the
LAStools software, where height was determined by the highest point above the ground TIN at their
ground TIN at their x and y location. The crown point clouds were also used to calculate crown
x andvolume.
y location.
VoxelsThe crown
with a sidepoint
lengthclouds were
of 25 cm, alsosuitable
deemed used toforcalculate
the crowncrown
size ofvolume. Voxels
the tree crops, werewith a
side length
createdof 25 cm,
based on deemed suitable
point clouds for the
belonging to crown size of
each crown, thethen
and treethe
crops,
crown were created
volume was based on point
calculated
cloudsbased on counting the filled voxels using the LAStools software. A detailed flowchart of the TLS data the
belonging to each crown, and then the crown volume was calculated based on counting
filledprocessing
voxels usingstepsthe
forLAStools
measuringsoftware. A detailed
crown structure flowchart
metrics of the TLS
of the individual data processing
tree crowns is presentedsteps
in for
Figure crown
measuring 2. structure metrics of the individual tree crowns is presented in Figure 2.
Figure 2. Flowchart for generating crown structure metrics from the terrestrial laser scanning (TLS) data.
Figure 2. Flowchart for generating crown structure metrics from the terrestrial laser scanning (TLS)
2.2.3. data. Laser Scanning Data Processing
Airborne
At theAirborne
2.2.3. orchardLaserlevel, a maximum
Scanning CHM was created for each avocado, macadamia and mango
Data Processing
orchard. By selecting 0.15 m as the
At the orchard level, a maximum CHMcanopy height
wasthreshold,
created for the
eachCHM wasmacadamia
avocado, converted andintomango
a shapefile
representing the hedgerows, and manual editing was conducted to separate the connected
orchard. By selecting 0.15 m as the canopy height threshold, the CHM was converted into a shapefile rows due to
branches reaching
representing theacross tree rows.
hedgerows, A minimum-bounding
and manual editing was conducted rectangle wasthe
to separate created for each
connected tree row
rows due
in ArcGIS 10.6. reaching
to branches The treeacross
row width andAlength
tree rows. were represented
minimum-bounding by the
rectangle wasdimensions of the
created for each treerectangle.
row
Frominthe
ArcGIS
length10.6. Therectangles
of the tree row width and lengththe
and knowing were represented
spacing between by the
treedimensions
crowns from of the
fieldrectangle.
assessment,
From the length of the rectangles and knowing the spacing between
the number of trees per tree row and orchard were calculated. At the tree level, individual tree crowns from field trees
assessment, the number of trees per tree row and orchard were calculated.
were extracted from the ALS data using the same bounding boxes as those used to clip the TLS data. At the tree level,
individual trees were extracted from the ALS data using the same bounding boxes as those used to
Fractional cover was derived from the proportion of first returns (higher than 0.5 m) in relation to all
clip the TLS data. Fractional cover was derived from the proportion of first returns (higher than 0.5
returns [37]. All ALS points except for the ground points of each clipped individual tree was used to
m) in relation to all returns [37]. All ALS points except for the ground points of each clipped
calculate crowntree
individual volume using
was used the same
to calculate voxel-based
crown approach
volume using the sameas for the TLS data.
voxel-based Theasvoxel-based
approach for the
approach wasThe
TLS data. used in this case,
voxel-based as it iswas
approach a direct measurement
used in this case, as it of
is apoints as opposed to
direct measurement of model-based
points as
estimates.
opposed Thetosame workflow
model-based was used
estimates. forsame
The both workflow
the ALS andwasTLSusedfor forderiving
both thecrown area,
ALS and maximum
TLS for
crown height and crown volume (Figure 2).
deriving crown area, maximum crown height and crown volume (Figure 2).
2.2.4.2.2.4. Evaluation
Evaluation of ALS-derivedTree
of ALS-Derived TreeCrop
CropStructure
Structure
In this
In this research,
research, TLS-derivedmeasurements
TLS-derived measurements of of tree
treestructure
structurewere
were used
usedfor for
evaluation of theof the
evaluation
ALS-derived results. The TLS data were deemed suitable for evaluation purposes
ALS-derived results. The TLS data were deemed suitable for evaluation purposes based on existing based on existing
research findings, e.g., by [38,39], and the much higher point cloud density, smaller laser footprint
research findings, e.g., by [38,39], and the much higher point cloud density, smaller laser footprint size,
size, integration of multiple scans of each tree from different view angles and measurement proximity
integration of multiple scans of each tree from different view angles and measurement proximity to
to each tree. We used linear regression to relate the ALS-derived results of the mapped crown
each tree. We parameters
structure used lineartoregression to relate
those produced fromthe
theALS-derived results
TLS data of the of the mapped
corresponding crown
trees. We usedstructure
the
parameters to those produced from the TLS data of the corresponding trees. We
R and the line slope and intercept for interpretation of the relationship. A two-tailed t-test
2 used the R2was
and the
line slope and intercept
performed to evaluatefor interpretation
if the of theofrelationship.
intercept and slope Athe
the equations of two-tailed t-test
line of best was
fit was performed to
significantly
evaluate if the intercept and slope of the equations of the line of best fit was significantly different
from zero and one, respectively, at a significance level of 0.05 [40]. Also, RMSE was calculated to
indicate the spread of the residuals, expressed as the standard deviation between estimated crown
structure values derived from the ALS and TLS data, using a linear model. In order to compare
the linear models between different crown structure measurements calculated in different units (i.e.,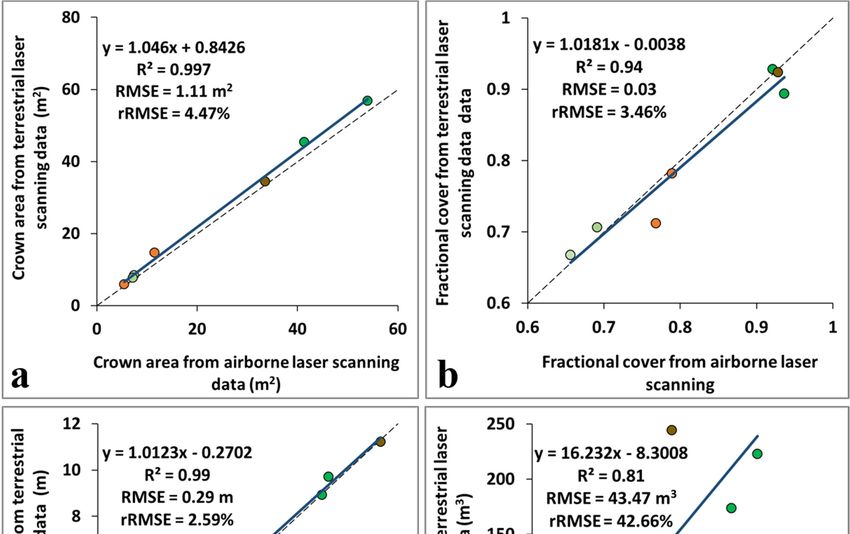
Remote Sens. 2020, 12, 1647 7 of 23
crown area, m2 ; crown height, m; and crown volume, m3 ), we also calculated the unitless relative
RMSE (rRMSE), by dividing the RMSE with the respective mean crown structure value estimated from
the TLS data. Hence, the lower the rRMSE is, the better model fit. For crown area evaluation, the
percentage difference of the ALS and TLS measurements were calculated. For tree crown fractional
cover and height, the values of individual pixels encompassed by each tree crown’s perimeter were
related to identify the maximum and minimum differences, average values as well as the RMSE for
each individual tree. The number of trees estimated per tree row and orchard from the ALS data were
evaluated against field counted numbers of trees for selected tree rows, including the entire mango
orchard, 10 avocado tree rows, and 5 macadamia tree rows.
3. Results
Our results showed that those crown structure measurements relying on information from the top
of the crown were largely similar when using both the ALS and TLS data (Figure 3). The measurements
of crown area achieved the highest correlation (R2 = 0.997) between the ALS and TLS data (Figure 3a).
The RMSE of the crown area derived from the ALS data evaluated against the TLS data was 1.11 m2 and
the rRMSE was only 4.47%. Low estimation differences between the ALS and TLS-derived fractional
cover (rRMSE = 3.46%) were also observed (Figure 3b). The RMSE of fractional cover determined from
the ALS data was only 0.03 when assessed against TLS measurements and the R2 was 0.94. The RMSE
of the linear model between maximum crown height derived from the ALS and TLS data was 0.29 m
and the R2 was 0.99 (Figure 3c). A linear model for maximum crown height estimates between the
ALS and TLS data achieved the best model fit (rRMSE = 2.59%) of all the linear models of crown
structure with a near 1:1 relationship. In fact, the relationships between the ALS and TLS estimates of
crown area, fractional cover and crown height all had near 1:1 relationships intercepting close to the
origin. Based on a two-tailed t-test, it was found that the slope was not significantly different from
1 at a significance level of 0.05 for crown area, fractional cover and maximum height. The intercept
was not significantly different from 0 for fractional cover, but the null hypothesis of the intercept was
rejected for crown area and maximum height at a significance level of 0.05. On the other hand, crown
volume measured from the ALS data was consistently smaller than that derived from the TLS data
for all tree types (Figure 3d), with the slope and intercept being significantly different from 1 and 0,
respectively, at a significance level of 0.05. While the R2 was 0.81 when evaluating the ALS against the
TLS-derived crown volume, the linear model had the poorest fit (rRMSE = 42.66%) of the four crown
structural parameters. In fact, the ALS-derived crown volume estimates were >10 times smaller than
those derived from the TLS data, which was attributed to the top-down viewing geometry of the ALS
data, preventing volume estimation of the lower parts of the tree crowns (Figure 3d).
3.1. Evaluation of ALS Crown Area Against TLS Data
The crown area of the avocado, macadamia and mango trees was derived in the same manner
for both the ALS and TLS data, using a TIN merged into a single polygon from which the crown
area was calculated. Crown areas estimated from the ALS data were consistently smaller than the
crown areas derived from the TLS data for all avocado, macadamia and mango trees in this study
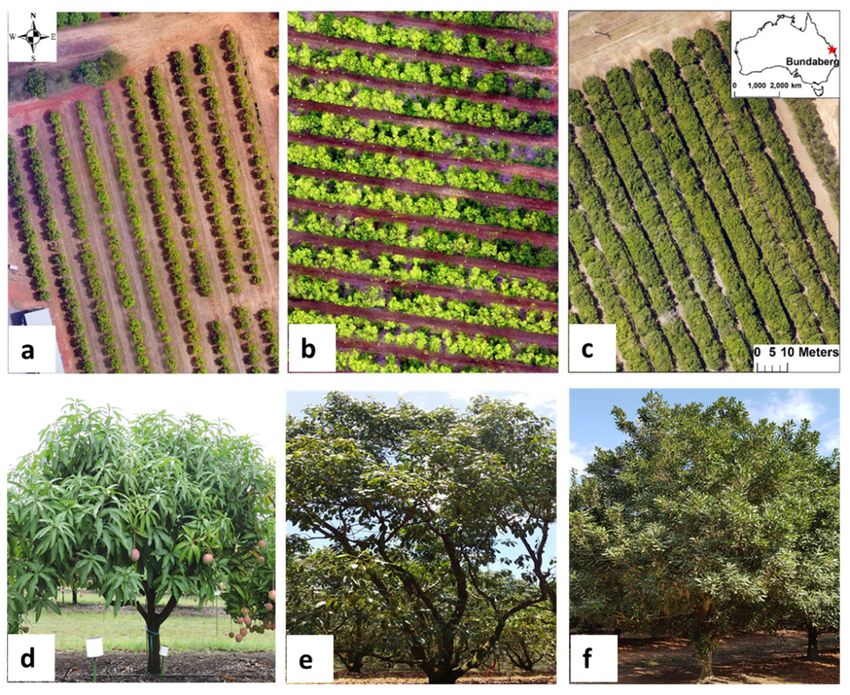
(Figures 3a and 4). The maximum absolute crown area difference between the ALS and TLS data was
4.16 m2 (9.15% difference) for one of the avocado trees in a commercial orchard (Figure 4a), while the
minimum absolute crown area difference was 0.43 m2 (7.29% difference) for the low vigour mango
tree (Figure 4d). The largest and smallest percentage differences between the ALS- and TLS-derived
crown area was 22.00% for the high vigour mango tree and 2.67% for the macadamia tree, respectively.
On average, the ALS crown area was 1.90 m2 smaller than the TLS crown area for all the trees in this
study. Estornell et al. [18] showed that due to the lower point density, ALS data may not be able
to detect the border and lower part of the crown when mapping the individual tree crown area for
horticultural tree crops. Similar findings can be seen from our study for all the three tree crop types
and the significant difference in point density between ALS and TLS data is illustrated in Figure 4.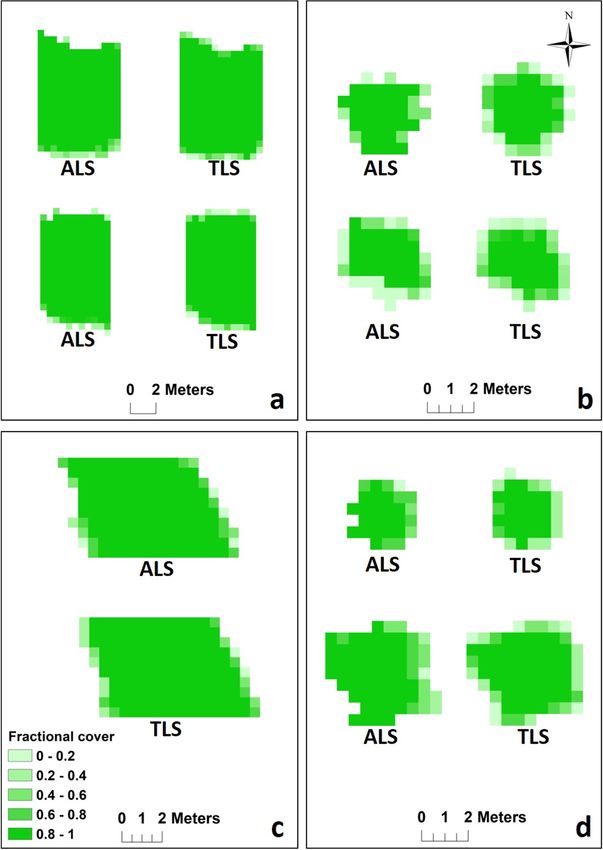
Remote Sens. 2020, 12, 1647                                                                                            8 of 23

Furthermore, compared to the overhead vertical data acquisition method of the ALS data, the side
view data acquisition of TLS data was better suited for capturing the border and lower parts of the tree
crowns, especially for vertically overlapping crown layers. For example, ALS data could not be used
to detect the southern edges of the crown for the high vigour mango tree, which was occluded by the
crown from the adjacent tree (Figure 4d). Therefore, the lower point density and vertical view angle
contributed to the limited ability of ALS data to detect the edges along the crown parameters, causing
the ALS data to underestimate the crown area for all the horticultural tree crops. On the contrary, ALS
data could be used to accurately identify the crown area of the macadamia tree (percentage difference
of 2.67%   between
      Remote Sens. 2019, ALS-    and
                         11, x FOR   TLS-derived
                                   PEER REVIEW   results), because of its dense crown structure (Figure   4c).
                                                                                                    8 of 24

      Figure 3. Crown
          Figure        areaarea
                  3. Crown   (a),(a),
                                  fractional  cover
                                      fractional    (b),
                                                 cover   maximum
                                                       (b), maximum(max) (max) crown
                                                                                crown height   (c),and
                                                                                       height (c),  andcrown
                                                                                                        crownvolume
                                                                                                              volume (d)
      compared   between
          (d) compared     the airborne
                         between           (ALS)(ALS)
                                   the airborne   and and
                                                       terrestrial  laser
                                                            terrestrial    scanning
                                                                        laser scanning(TLS)
                                                                                        (TLS)data.
                                                                                              data.

      3.1. Evaluation of ALS Crown Area Against TLS Data
            The crown area of the avocado, macadamia and mango trees was derived in the same manner
      for both the ALS and TLS data, using a TIN merged into a single polygon from which the crown area
      was calculated. Crown areas estimated from the ALS data were consistently smaller than the crown
      areas derived from the TLS data for all avocado, macadamia and mango trees in this study (Figures
      3a and 4). The maximum absolute crown area difference between the ALS and TLS data was 4.16 m2
      (9.15% difference) for one of the avocado trees in a commercial orchard (Figure 4a), while the
      minimum absolute crown area difference was 0.43 m2 (7.29% difference) for the low vigour mango
      tree (Figure 4d). The largest and smallest percentage differences between the ALS- and TLS-derived
      crown area was 22.00% for the high vigour mango tree and 2.67% for the macadamia tree,
      respectively. On average, the ALS crown area was 1.90 m2 smaller than the TLS crown area for all the
      trees in this study. Estornell et al. [18] showed that due to the lower point density, ALS data may not
      be able to detect the border and lower part of the crown when mapping the individual tree crown
      area for horticultural tree crops. Similar findings can be seen from our study for all the three tree crop
      types and the significant difference in point density between ALS and TLS data is illustrated in Figure
      4. Furthermore, compared to the overhead vertical data acquisition method of the ALS data, the side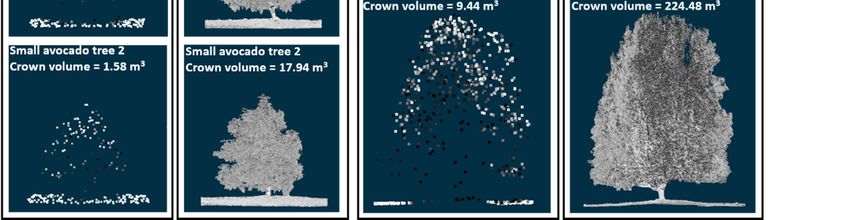
used to detect the southern edges of the crown for the high vigour mango tree, which was occluded
    by the crown from the adjacent tree (Figure 4d). Therefore, the lower point density and vertical view
    angle contributed to the limited ability of ALS data to detect the edges along the crown parameters,
    causing the ALS data to underestimate the crown area for all the horticultural tree crops. On the
    contrary, ALS data could be used to accurately identify the crown area of the macadamia tree9 of 23
Remote Sens. 2020, 12, 1647
    (percentage difference of 2.67% between ALS- and TLS-derived results), because of its dense crown
    structure (Figure 4c).

      Figure  4. Crown
          Figure  4. Crown area  calculation
                              area calculationof
                                               of(a)
                                                   (a) the
                                                        the avocado  treesfrom
                                                            avocado trees   fromthe
                                                                                  thecommercial
                                                                                       commercial   orchard
                                                                                                 orchard andand    (b) the
                                                                                                              (b) the
      research  station,
          research        (c)(c)
                    station,  thethe
                                   macadamia
                                     macadamiatree,
                                                  tree, and
                                                         and (d) the
                                                                 the mango
                                                                     mangotrees
                                                                              treeswith
                                                                                    with  high
                                                                                        high   and
                                                                                             and lowlow  vigour
                                                                                                      vigour     derived
                                                                                                             derived
      fromfrom
            the the
                airborne   (ALS)
                    airborne       and
                               (ALS) andterrestrial
                                          terrestriallaser
                                                      laserscanning   (TLS)data.
                                                             scanning (TLS)  data.

3.2. 3.2.
     Evaluation   of ALS
          Evaluation      Fractional
                     of ALS FractionalCover
                                       CoverAgainst
                                            Against TLS Data
                                                    TLS Data
       Fractional   cover
           Fractional   covermeasured
                                measured  from
                                             fromthetheALS
                                                         ALS  data
                                                                datawas
                                                                      wasevaluated
                                                                           evaluatedagainst
                                                                                      againstthe
                                                                                               theTLS
                                                                                                    TLS data
                                                                                                         data collected.
                                                                                                              collected. AtAt the
tree the  tree level,
      crown     crownthere
                        level,was
                               there nowas  no consistent
                                         consistent             underestimation
                                                        underestimation            or overestimation
                                                                              or overestimation         of fractional
                                                                                                    of fractional      cover
                                                                                                                    cover   when
     when    relating  the  results between    the ALS     and  TLS  data  (Figure 3b). Fractional
relating the results between the ALS and TLS data (Figure 3b). Fractional cover along the crown     cover  along  the crown
     boundaries
boundaries       hadhad   lower
                      lower       agreementbetween
                               agreement       between the  the results
                                                                 resultsfrom
                                                                          fromthe
                                                                                theALS
                                                                                     ALS and
                                                                                           andTLSTLSdata than
                                                                                                       data    those
                                                                                                             than      in the
                                                                                                                    those  in the
     crown    centre  (Figure   5). This  may   be due    to  the lower  point density  of the
crown centre (Figure 5). This may be due to the lower point density of the ALS data, which may  ALS  data,  which   may   not not
     hit the sparser crown perimeters, whereas the much denser point cloud of the TLS data increases the
hit the   sparser crown perimeters, whereas the much denser point cloud of the TLS data increases
     ability to map the exact crown perimeter. It seems that with the ALS data, it is more likely that the
the ability to map the exact crown perimeter. It seems that with the ALS data, it is more likely that
     perimeter of sparse and small canopies is omitted, i.e., mango and small avocado trees, when
the perimeter of sparse and small canopies is omitted, i.e., mango and small avocado trees, when
     compared with dense and tall canopies, i.e., mature avocado and macadamia trees (Figure 5).
compared
     However, withfordense   and differences
                       all trees,  tall canopies,    i.e., mature
                                                 of ≥0.84           avocado
                                                             in fractional     andwere
                                                                            cover   macadamia
                                                                                         identifiedtrees (Figure
                                                                                                     along         5).crown
                                                                                                            the tree   However,
for all trees, differences of ≥0.84 in fractional cover were identified along the tree crown perimeters
(Table 2). The perimeters of the tree crowns are also more likely to be influenced by wind, which
may have caused the large maximum differences in fractional cover. In contrast, the crown centers
displayed differences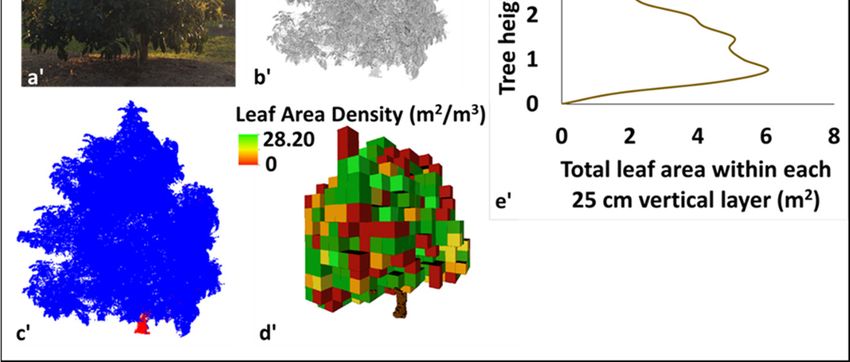
which may have caused the large maximum differences in fractional cover. In contrast, the crown
    centers displayed differences
Remote Sens. 2020, 12, 1647 11 of 23
3.3. Evaluation of ALS Maximum Crown Height Against TLS Data
The maximum crown height of the avocado, macadamia and mango trees was calculated by
extracting the value of the highest point within each tree crown for both the ALS and TLS data and
subtracting the ground elevation from this height measurement (Figure 3c). The absolute height
difference between these two datasets was 0.07 m–0.58 m. Some studies have found that ALS may
underestimate crown height due to the lower point density and the larger foot print size in relation to
crown structure [35]. To derive the maximum crown height from ALS data, a laser beam has to hit
the tree apex and the return of this laser beam has to be recorded by the scanner [32]. Yu et al. [41]
found that data acquisition parameters such as flying altitude and pulse density can affect the ability
of height estimation from ALS data, and that canopy height underestimation increases with flying
height. Our ALS- and TLS-derived height measurements of the avocado, macadamia and mango trees
produced a near 1:1 relationship for maximum tree height (Figure 3c), which was attributed to the
relatively flat semi-spherical crown top of the mango, mature avocado and macadamia trees. In some
cases, TLS data can underestimate tall trees (e.g., 15 m [42]) due to possible occlusions of the upper
crown [43]. However, when assessing the maximum values of individual pixels within each tree crown,
there was a tendency of the TLS data producing larger height values than the ALS data, which was
the main contributor to the RMSE reported in Table 3. In fact, all maximum differences (Table 3) in
height values between the ALS- and TLS-derived measurements were due to height underestimation
using the ALS data. Edge pixels showed the largest variation of height values with both over- and
underestimation of ALS-derived measurements (Figure 6), which could possibly be attributed wind
effects. For the pixels encompassing each tree crown, the TLS data produced larger height values in
86.96–97.50% of cases for six (not the low vigour mango tree) out of the seven assessed trees (Figure 6,
Table 3). Because of these findings, and the fact that the horticultural trees were less than 12 m in height
with sufficient space between tree rows for apex identification, TLS was found to be an appropriate
technology for evaluation of ALS-derived crown height in this study. The larger TLS height values
resulted in average heights per tree crown being between 0.39–0.94 m greater than those from the
ALS-derived measurements, excluding the lower vigour mango tree (Table 3). These results highlight
that while the maximum height value per tree crown produced a near 1:1 relationship between the ALS-
and TLS-derived measurements; the within-crown ALS measurements were generally underestimated
in relation to the TLS measurements.
Table 3. Comparison of airborne- (ALS) and terrestrial laser scanning- (TLS) derived tree height at the
individual pixel level for each of the avocado, macadamia and mango trees, showing the number of
pixels per tree crown (n), maximum (max) and minimum (min) height difference between the ALS
and TLS data, the average ALS and TLS height, and the root mean square error (RMSE) between the
individual ALS and TLS pixel values per tree crown.
Max Height Min Height Average Average
n Difference Difference ALS Height TLS Height RMSE (m)
(m) (m) (m) (m)
Avocado tree 1 198 6.21 0.004 6.88 7.33 1.12
Avocado tree 2 230 7.07 0.001 7.24 7.63 0.78
Mango high vigour 71 3.27 0.012 2.54 3.20 0.80
Mango low vigour 34 1.31 0.022 1.87 1.25 0.84
Macadamia tree 163 7.28 0.032 8.02 8.96 1.54
Small avocado tree 1 40 1.64 0.040 2.47 2.93 0.59
Small avocado tree 2 39 1.51 0.062 2.21 2.71 0.64Remote Sens. 2020, 12, 1647 12 of 23
Remote Sens. 2019, 11, x FOR PEER REVIEW 12 of 24
Figure 6.
Figure 6. Crown
Crown height
height calculation of (a,b)
calculation of (a,b) avocado,
avocado, (c)
(c) macadamia and (d)
macadamia and (d) mango
mango trees
trees from airborne
from airborne
(ALS) and terrestrial laser scanning (TLS) data.
(ALS) and terrestrial laser scanning (TLS) data.
3.4. Evaluation of ALS Crown Volume Against TLS Data
The crown volume was calculated by counting the filled voxels (25 cm side length) for both the
ALS and TLS data. This voxel size was considered appropriate in relation to the size of the assessed
tree crops. The selection of an optimal voxel size to calculate crown volume of each type of tree crops is
beyond the scope of this research, and therefore should be further investigated in subsequent studies.Remote Sens. 2020, 12, 1647 13 of 23
The crown volume of the avocado, macadamia and mango trees derived from the ALS data was
significantly smaller than that derived from the TLS measurements (Figure 3d). The underestimation
increased for trees with overlapping canopies, high crown depth and density, e.g., within hedgerows
such as the macadamia tree, where the crown volume calculated from the ALS data was only 3.86% of
that measured from the TLS data. In contrast, the crown volume of the two mango trees derived from
the ALS data was around 17% of that measured from the TLS data. For the two mango trees, we can
see a general semi-spherical crown top from the ALS data, but the lower crown and individual leaves
and branches cannot be identified (Figure 7). A similar semi-spherical crown top can also be seen
for the mature avocado and macadamia trees, with only a limited number of ALS returns registered
from within and the lower sections of the crown. The horizontal view angle, the multiple views,
the small laser footprint and high point density of the TLS data produced a more evenly distributed
point cloud across all parts of the crowns. Hence, crown volume based on the calculation of voxels
could more appropriately be derived from the TLS than the ALS data. However, other methods for
estimating crown volume may reduce the underestimation of the ALS-derived volumetric results.
The crown sizes of the sampled orchards were either below 30 m3 for the mango trees and the two
2-year-old avocado trees (Figure 7a,b) or between 150 m3 and 250 m3 for the mature avocado and
macadamia trees (Figure 7a0 ,b0 ). The associated pruning practices may have attributed to these distinct
volumetric intervals.
Remote Sens. 2019, 11, x FOR PEER REVIEW 14 of 24
Figure
Figure 7. Crown
7. Crown volume
volume (calculatedat
(calculated at25
25 cm
cm voxel
voxel side
sidelength)
length)and
andlaser point
laser clouds
point from
clouds airborne
from airborne
laser scanning data (a,a0 ) and terrestrial laser scanning data (b,b0 ) of two mango trees, two2-year
laser scanning data (a, a’) and terrestrial laser scanning data (b, b’) of two mango trees, two -
2-year-old
old small avocado trees from a research station, two mature avocado trees from a commercial orchard,
small avocado trees from a research station, two mature avocado trees from a commercial orchard, and
and one macadamia tree.
one macadamia tree.
3.5. 3.5. Additional
Additional ALSALS Orchardand
Orchard andTLS
TLSCanopy
Canopy Parameters
Parameters
TheThe
muchmuch larger spatial coverage of the ALS data enables orchard scale information to be
larger spatial coverage of the ALS data enables orchard scale information to be derived.
derived. Figure 8 provides an example of how ALS data can be applied to obtain information on tree
Figure 8 provides an example of how ALS data can be applied to obtain information on tree height
height variations as well as row widths and lengths within an orchard. Variations in tree height of
variations as well as row widths and lengths within an orchard. Variations in tree height of individual
individual tree crowns can be seen along and between different rows, which might indicate
differences in growth patterns and condition. The width of the rectangular bounding box, within
which each tree row occurs, was determined by the widest tree crown in a row and can provide a
quick overview of growth patterns and relative crown area variation between trees within a row.
Tree length and width are useful parameters for informed pruning practices and orchard
management. Based solely on the length of the rectangles forming each tree row and the knownRemote Sens. 2020, 12, 1647 14 of 23
tree crowns can be seen along and between different rows, which might indicate differences in growth
patterns and condition. The width of the rectangular bounding box, within which each tree row
occurs, was determined by the widest tree crown in a row and can provide a quick overview of growth
patterns and relative crown area variation between trees within a row. Tree length and width are
useful parameters for informed pruning practices and orchard management. Based solely on the
length of the rectangles forming each tree row and the known spacing between individual trees, a total
of 495 mango trees, 4815 avocado trees and 3947 macadamia trees were estimated. All mango trees
were correctly estimated based on manual counting of the mango trees within the CHM. While some
smaller avocado trees were omitted along the perimeter of the orchard due to their limited height
and size, a total of 4786 trees were estimated when deducting 29 trees based on observed gaps, i.e.,
missing trees, along the rectangles. Based on 561 field-counted avocado trees along 10 rows (rows
66–75, Figure 8b), a total of 559 were estimated from the delineated rows. Rounding the numbers
of the rectangle length divided by the tree spacing, i.e., 5 m, was found to be the cause of the two
unaccounted trees in this case. The estimated number of macadamia trees was 3899 when subtracting
hedgerow gaps representing 48 missing trees within the orchard (Figure 8c). Based on 740 field counted
macadamia trees along 5 rows (rows 18–23, Figure 8c), a total of 742 were estimated from the delineated
rows. The overestimation of two trees based on the ALS data was due to two gaps, each representing
two missing trees instead of one.
Remote Sens. 2019, 11, x FOR PEER REVIEW 15 of 24
8. Canopy
FigureFigure height
8. Canopy andand
height rowrowwidth
widthandandlength
lengthfrom
from airborne laserscanning
airborne laser scanningof of a mango
a mango orchard
orchard
(a), an(a),
avocado orchard
an avocado (b) and
orchard a macadamia
(b) and a macadamia orchard
orchard(c).
(c). Note thatyoung
Note that youngtrees
trees
in in
thethe mango
mango andand
avocadoavocado orchards
orchards werewere excluded
excluded in this
in this calculation.
calculation.
BasedBased
on theon methods
the methods and and resultsby
results byWuWu et al.
al.[6],
[6],some
some examples
examples of additional information
of additional on
information
tree structure that can be produced from TLS data is provided in Figure 9. The
on tree structure that can be produced from TLS data is provided in Figure 9. The leaf area density leaf area density was
calculatedfor
was calculated for all
all parts
parts of
of the
the tree
tree crowns,
crowns, displaying
displayingvariations in in
variations leafleaf
area in three
area dimensions.
in three dimensions.
Relating leaf area calculations at the voxel level to tree height enables a vertical profile of leaf area to
Relating leaf area calculations at the voxel level to tree height enables a vertical profile of leaf area to be
be produced, in this case showing that the densest parts of the crown with the highest leaf area
produced, in this case showing that the densest parts of the crown with the highest leaf area occurred
occurred approximately 1 m above ground level for both of the 2-year-old avocado trees (Figure 9).
approximately
However, 1thism above
level ofground level
detail can forbeboth
only of thefor
obtained 2-year-old avocado
selected trees, trees (Figure
as covering 9). However,
an orchard with
this level of detail
hundreds can only be
or thousands obtained
of trees wouldforbeselected trees,cost-
prohibitively as covering an orchardand
and time-consuming, withthehundreds
amount or
thousands of trees
of data wouldwould be be prohibitively
excessive. Hence,cost-
the and
ALStime-consuming, and the provide
and TLS technologies amount of data would
different but be
excessive. Hence, thecapabilities
complementary ALS and TLS technologies
for mapping provide
tree crop different
structural but
metrics to complementary capabilities for
support orchard management
mappingat both
treeindividual tree crown
crop structural scalestoand
metrics orchard
support scales. management at both individual tree crown
orchard
scales and orchard scales.Remote Sens. 2020, 12, 1647 15 of 23
Remote Sens. 2019, 11, x FOR PEER REVIEW 16 of 24
Figure 9. Pictures
Figure 9. Pictures of
of two
two 2-year-old
2-year-old avocado
avocado trees
trees (a,
(a,aa’) from aa research
0 ) from research station,
station, their
their corresponding
corresponding
3D
3D intensity
intensity images
images (b,
(b,bb′) and classified
0 ) and classified discrete
discrete point
point clouds
clouds (c,
(c,cc′), leaf area
0 ), leaf area density
density at
at aa voxel
voxel level
level
(25 cm in side length) (d, d′),
0 and vertical leaf area profiles within each 25 cm vertical
(25 cm in side length) (d,d ), and vertical leaf area profiles within each 25 cm vertical layer (e,e ). layer (e, e′).
0
Discussion
4. Discussion
4.1. Evaluating
4.1. Evaluating ALS-Derived
ALS-Derived Tree
Tree Crop
Crop Structure
Structure Against
Against TLS
TLS Data
Data
This study
This study showed
showed thatthat accurate crown area
accurate crown area measurements
measurements for for horticultural
horticultural tree tree crops
crops can
can be
be
derived from ALS data. These results concur with those previously reported
derived from ALS data. These results concur with those previously reported for olive trees [18]. for olive trees [18].
Crown area
Crown area cancan be
be used
used asas an
an indicator
indicator ofof tree
tree growth
growth during
during the
the growing
growing season
season forfor horticultural
horticultural
tree crops, and hence provides information, if assessed on a multi-temporal
tree crops, and hence provides information, if assessed on a multi-temporal basis, on tree basis, on tree response
response toto
orchard management
orchard management practices,
practices,such
suchasasirrigation
irrigationand andfertilization
fertilization[44].
[44].Due
Due to to
thethe irregular
irregular shape
shape of
of horticultural trees, tree crown shape cannot simply be assumed to be circular
horticultural trees, tree crown shape cannot simply be assumed to be circular or spherical [11]. or spherical [11].
Therefore,
Therefore, itit is
is time
time intensive
intensive toto manually
manually conduct
conduct field
field measurements
measurements of of crown
crown areaarea [45].
[45]. ALS
ALS data
data
offer growers an accurate and efficient alternative. As the crown area calculation
offer growers an accurate and efficient alternative. As the crown area calculation from the LiDAR from the LiDAR data
was
data was mainly based on the upper crown returns, ALS, in this case with a point density of > 13,
mainly based on the upper crown returns, ALS, in this case with a point density of > 13 points/m 2
and TLS data
points/m 2, and demonstrated similar capacities
TLS data demonstrated similar to generatetohighly
capacities accurate
generate highlycrown
accurateestimates. However,
crown estimates.
TLS
However, TLS data collection is significantly more time-consuming and will often require ascanned
data collection is significantly more time-consuming and will often require a tree to be tree to
from
be multiple
scanned fromangles to minimize
multiple angles occlusion
to minimizeissues [46]. Hence,
occlusion issuesmapping tree mapping
[46]. Hence, crown area from
tree an aerial
crown area
perspective seems more appropriate.
from an aerial perspective seems more appropriate.
An alternative to our TLS data collection includes LiDAR-based mobile surveying technology
consisting of a laser scanning system, generally with integrated positioning and imaging capabilities,Remote Sens. 2020, 12, 1647 16 of 23
An alternative to our TLS data collection includes LiDAR-based mobile surveying technology
consisting of a laser scanning system, generally with integrated positioning and imaging capabilities,
and installed on a moving platform [47]. These types of systems have the capacity to collect point cloud
data from multiple view angles to prevent occlusion and to significantly reduce the data collection time
in orchards. While holding great potential for future point cloud data collection, the limited spacing
between hedgerows restricts the type of vehicle or robotic system to be used for mobile mapping
systems. For instance, Underwood et al. [48] used a TLS system mounted on a mobile robotic ground
vehicle for almond orchards to calculate crown volume from a 3D voxelised point cloud from which
yield was estimated. However, ground obstacles might hinder vehicle access or limit the quality of
collected data [49]. While the objective of this research was to assess ALS data evaluated against
TLS data for deriving structural parameters relevant for horticulture tree crops, it is important to
highlight that crown area can be estimated from other types of image data, including airborne and
UAV-based optical datasets [8,50–52] and potentially high spatial resolution satellite imagery [53].
However, Johansen et al. [54] found that high spatial resolution WorldView-3 pan-sharpened imagery
with 30-cm pixels was not sufficient for delineating individual macadamia trees grown as a hedgerow.
The ALS dataset was found to provide highly accurate crown fractional cover estimates for
horticultural trees when assessed against the TLS data (Figure 5, Table 2). LiDAR data have been
widely applied in crown fractional cover mapping of forested and riparian environments due to
its ability to extract spatially continuous vertical crown structure information even without field
data [37,55–58]. Fractional cover is traditionally assessed from an aerial view, i.e., identifying the
fraction of vegetation versus no vegetation from nadir-viewing, and hence ALS data are particularly
suited for the derivation of this measurement. While TLS data were obtained with a much higher point
density (>10,000 points/m2 ) than the ALS data (13.63 points/m2 ), multiple scans at different viewing
angles are required to avoid occlusion and hence reduce the ability to calculate fractional cover on the
side of the tree opposite to the scan location. Fractional cover is a good indicator of light interception,
which is also a crucial determinant of crop growth and important for flowering, fruit maturation and
quality as well as reducing disease and pest incursions for horticultural tree crops [59,60]. Remote
sensing technologies used for fractional cover estimates of horticultural tree crops still mainly rely
on passive optical sensors [59,61,62]. Challenges of optical imagery collected from different dates,
including shadow effects, sensor viewing geometry, illumination angle differences and leaf phenology
effects, do not exist for LiDAR data [37,58,63]. While optical imagery generally needs calibration and
validation either from field data or ALS data for measuring fractional cover, ALS data can provide
consistent results with similar accuracies to those derived from field measurements, e.g., using the
LI-COR LAI-2000 Plant Canopy Analyzer or hemispherical photographs [37,56].
For maximum crown height measurements, similar results were produced using both the ALS and
TLS data. Accurate crown height estimates have also been achieved from both ALS and TLS data for
olive, walnut, mango and avocado trees, although some ALS-derived measurements can underestimate
the maximum crown height [11,21,23,35]. Our results presented in Table 3 also showed that the
within-crown ALS height measurements were underestimated in relation to the TLS measurements by
up to 0.94 m on average per crown. Misclassified ground points (tall grass classified as ground), low
point density and failure to identify the crown apex may be a cause for crown height underestimation
of ALS data for horticultural tree crops [19,35]. Wang et al. [42] demonstrated that ALS data can
provide accurate crown top height estimates regardless of tree height, crown shape and species. This
corresponds with our findings that ALS data are suitable for estimating maximum crown height for
horticultural trees of different age, canopy management regime, height, and tree types, in our case
mango, avocado and macadamia trees. Maximum crown height and width are controlled based on row
space in commercial orchards to achieve the best light interception, machine access and convenience for
harvesting [64–66]. Therefore, in mango orchards most trees are limited to a maximum height of 4 m,
whereas avocado and macadamia trees might grow to around 10 m. While the footprint size of ALS
returns, the pulse repetition rate, flying height and the threshold beyond which a return is registeredRemote Sens. 2020, 12, 1647 17 of 23
will affect the ability of ALS data to identify the highest point of tree crops, these parameters will rarely
impact TLS data [67]. However, depending on the tree height and view angle of the scanner, the line of
sight of TLS data might in some cases be restricted from identifying the apex of tall tree crops [38].
Alternative options for measuring tree height from remote sensing include the use of multi-view digital
photography, in particularly structure-from-motion algorithms based on optical UAV imagery, where
photogrammetry permits height measurements of tree crops to be calculated [45,50,68,69].
Laser scanning data are perfectly designed for obtaining point clouds for provision of 3D tree
structure information such as crown volume. However, our results showed that the ability to measure
crown volume is significantly affected by the point density and the ability of points to penetrate
the crown. Although an ALS pulse has the capacity to reach the ground through open or sparse
canopies, the bottom and inner crown parts were in most cases not detected by the ALS data, as the
laser pulses were mainly returned by the upper parts of the crown [67]. Due to the occlusion issue
and the insufficient point density, the ALS data used in this research could not detect the lower crown
parts and hence underestimated crown volume using the voxel-based approach (Figure 7). Similar
findings have also been identified in ALS and TLS comparison studies for calculating canopy volume
in forestry [70]. By demonstrating the different viewing and data capture geometry from ALS and
TLS data, Kükenbrink et al. [70] concluded that occlusion effects were the main reason for canopy
volume underestimation from ALS data. Goodwin et al. [67] indicated that higher canopy density
and canopy cover reduce beam penetration through the canopy and thus reduce the point density
from the bottom canopy. Therefore, the macadamia tree, which had the highest crown density and the
highest crown depth of the trees assessed in this study, showed the largest relative difference in crown
volume between the ALS and TLS data (Figure 7). As crown volume is directly related to tree health
and vigour [71], our crown volume results of the high and low vigour mango trees reflect this point as
well, where the high vigour mango tree was 3.7 times larger than the low vigour mango tree (Figure 7).
In addition, voxel size is a critical parameter for voxel-based crown structure measurements [6,16,20].
Future work should include further experiments on the optimal voxel size selection based on crown
size, branch structure, occlusion effect and scanning resolution. Colaço et al. [72] tested different canopy
volume calculation methods (convex-hull and the alpha-shape surface reconstruction algorithms) for
orange trees and found substantial volume differences based on different methods. Therefore, more
canopy volume modelling methods need to be further evaluated in the future to determine which ones
are most accurate and how they are affected by different crown structure and size.
Differences in wind direction and speed between the days that the ALS and TLS data were
collected could have caused differences amongst the mapped tree crown perimeters due to movement
of branches and leaves [73]. The wind speed measured from a nearby climate station (Bundaberg
Aero weather station; 24.9069◦ S, 152.3230◦ E) when scanning the two avocado trees in the commercial
orchard, two small avocado trees from the research station, one macadamia tree and two mango trees
were 20.5–38.9 km/h, 24.1–27.7 km/h, 9.4–13 km/h and 29.5–40.7 km/h, respectively. The average wind
speed from the same weather station at the time of the ALS data collection was 11.8 km/h. However,
the hedgerow structure of the orchards acts as a barrier for blocking the wind. Although the wind
speed was higher during the TLS scanning, the two avocado and the macadamia trees (Figure 6) were
well sheltered amongst other tree rows, which likely contributed to the good agreement between the
ALS- and TLS-derived tree crown heights. The two small avocado trees from the research station and
the two mango trees may have been more influenced by wind, as they were more exposed. This might
have contributed to the offsets been crown apex and perimeter observations between the ALS and TLS
data (Tables 2 and 3).
4.2. Capacity of ALS and TLS Data for Imporved Orchard Management
TLS data can bridge the gap between traditional field measurements and ALS data [38],
and the combined application of ALS and TLS data provides an alternative method for accurate 3D
characterization of horticultural tree crops over both local and orchard scales. It is time-consuming,You can also read