Student Performance Predictions for Advanced Engineering Mathematics Course with New Multivariate Copula Models
←
→
Page content transcription
If your browser does not render page correctly, please read the page content below

Please do not remove this page

Student Performance Predictions for Advanced
Engineering Mathematics Course with New
Multivariate Copula Models
Nguyen-Huy, Thong; Deo, Ravinesh C; Khan, Shahjahan; et.al.
https://research.usc.edu.au/discovery/delivery/61USC_INST:ResearchRepository/12163156720002621?l#13163136650002621

Nguyen-Huy, Deo, R. C., Khan, S., Devi, A., Adeyinka, A. A., Apan, A. A., & Yaseen, Z. M. (2022). Student
Performance Predictions for Advanced Engineering Mathematics Course with New Multivariate Copula
Models. IEEE Access, 10, 45112–45136. https://doi.org/10.1109/ACCESS.2022.3168322
Document Type: Published Version

Link to Published Version: https://doi.org/10.1109/ACCESS.2022.3168322

USC Research Bank: https://research.usc.edu.au
research-repository@usc.edu.au
CC BY V4.0
This work is licensed under a Creative Commons Attribution 4.0 License. For more information, see
https://creativecommons.org/licenses/by/4.0/
Downloaded On 2022/10/20 00:27:05 +1000

Please do not remove this page
Received April 7, 2022, accepted April 14, 2022, date of publication April 18, 2022, date of current version May 3, 2022.
Digital Object Identifier 10.1109/ACCESS.2022.3168322

Student Performance Predictions for Advanced
Engineering Mathematics Course With New
Multivariate Copula Models
THONG NGUYEN-HUY 1,2 , RAVINESH C. DEO 3 , (Senior Member, IEEE),
SHAHJAHAN KHAN4,5 , ARUNA DEVI6 , ADEWUYI AYODELE ADEYINKA2,7 , ARMANDO A. APAN8 ,
AND ZAHER MUNDHER YASEEN 9,10,11
1 SQNNSW      Drought Resilience Adoption and Innovation Hub, University of Southern Queensland, Toowoomba, QLD 4350, Australia
2 Centre for Applied Climate Sciences, University of Southern Queensland, Toowoomba, QLD 4350, Australia
3 School  of Mathematics, Physics and Computing, University of Southern Queensland, Springfield, QLD 4350, Australia
4 School of Mathematics, Physics and Computing, University of Southern Queensland, Toowoomba, QLD 4350, Australia
5 School of Sciences and Engineering, Asian University of Bangladesh, Ashulia, Dhaka 1341, Bangladesh
6 School of Teacher Education and Tertiary Access, University of the Sunshine Coast, Caboolture, QLD 4350, Australia
7 Office of Research and Innovation, University of Southern Queensland, Toowoomba, QLD 4350, Australia
8 School of Surveying and Built Environment, University of Southern Queensland, Toowoomba, QLD 4350, Australia
9 Department of Earth Sciences and Environment, Faculty of Science and Technology, Universiti Kebangsaan Malaysia, Bangi, Selangor 43600, Malaysia
10 USQ’s Advanced Data Analytics Research Group, School of Mathematics Physics and Computing, University of Southern Queensland, Toowoomba,

QLD 4350, Australia
11 Scientific Research Center, New Era and Development in Civil Engineering Research Group, Al-Ayen University, Thi-Qar 64001, Iraq

Corresponding author: Ravinesh C. Deo (ravinesh.deo@usq.edu.au)
This work was supported in part by the University of Southern Queensland (School of Sciences Q1 Challenge Grant 2018), and in part by
the Office for Advancement of Learning and Teaching Technology Demonstrator Project Artificial Intelligence Predictive Analytics
Framework under the Ethics Approval Number H18REA236.
This work involved human subjects or animals in its research. Approval of all ethical and experimental procedures and protocols was
granted by the USQ Ethics Committee under Ethics Approval No. H18REA236.

  ABSTRACT Engineering Mathematics requires that problem-solving should be implemented through
  ongoing assessments; hence the prediction of student performance using continuous assessments remains
  an important task for engineering educators, mainly to monitor and improve their teaching practice. This
  paper develops probabilistic models to predict weighted scores (WS, or the overall mark leading to a final
  grade) for face-to-face (on-campus) and web-based (online) Advanced Engineering Mathematics students at
  an Australian regional university over a 6-year period (2013-2018). We fitted parametric and non-parametric
  D-vine copula models utilizing multiple quizzes, assignments and examination score results to construct
  and validate the predicted WS in independently test datasets. The results are interpreted in terms of the
  probability of whether a student’s continuous performance (i.e., individually or jointly with other counterpart
  assessments) is likely to lead to a passing grade conditional upon joint performance in students’ quizzes and
  assignment scores. The results indicate that the newly developed D-vine model, benchmarked against a linear
  regression model, can generate accurate grade predictions, and particularly handle the problem of low or high
  scores (tail dependence) compared with a conventional model for both face-to-face, and web-based students.
  Accordingly, the findings advocate the practical utility of joint copula models that capture the dependence
  structure in engineering mathematics students’ marks achieved. This therefore, provide insights through
  learning analytic methods to support an engineering educator’s teaching decisions. The implications are
  on better supporting engineering mathematics students’ success and retention, developing evidence-based
  strategies consistent with engineering graduate requirements through improved teaching and learning, and
  identifying/addressing the risk of failure through early intervention. The proposed methods can guide an
  engineering educator’s practice by investigating joint influences of engineering problem-solving assessments
  on their student’s grades.

  INDEX TERMS Engineering mathematics performance prediction, D-vine copula, multivariate probability
  model, academic performance, education decision-making, statistical model.

                                                                                               I. INTRODUCTION
   The associate editor coordinating the review of this manuscript and                         Over the last two years the problem of predicting stu-
approving it for publication was Ehab Elsayed Elattar            .                             dents’ ongoing learning using joint relationships between

                     This work is licensed under a Creative Commons Attribution 4.0 License. For more information, see https://creativecommons.org/licenses/by/4.0/
45112                                                                                                                                                                 VOLUME 10, 2022
T. Nguyen-Huy et al.: Student Performance Predictions for Advanced Engineering Mathematics Course

continuous assessments and final examinations are receiving                     variables influence a weighted score to assign a passing
attention from many researchers [1]–[4]. This is important as                   grade.
overall student outcomes define the quality of a university                        This research paper considers well-established theory of
graduate’s attributes, and is a primary factor that influences                  copulas [21] and further builds the original method into a new
the growth of student number and ranking of a university [5].                   predictive framework for engineering education decision-
Higher education institutions are now focusing on ways to                       making. We apply a new copula approach to the data from
improve student performance by provisioning early learning                      a web-based (online) and face-to-face (on-campus) engi-
support through evidence-based student performance eval-                        neering students’ performance. Copulas are advantageous in
uation methods. Predicting and analysing performance is                         modelling the joint distribution between variables where their
critical for academic progress [6] but from an educator’s                       marginal distributions and the data features are otherwise rel-
perspective, this issue remains a challenging task given the                    atively separate. We adopt copulas based on their capability to
influence of many factors that affect a student’s performance.                  analyse joint dependence structure, and constructing models
Examples of such factors include the family background,                         that are assumption-free and non-parametric. Free from the
psychological status, past schooling or academic achieve-                       influence of marginal distribution linear assumptions [22],
ments, and a learner’s interaction with their peers and teach-                  copulas provide a distinct advantage in probabilistic or con-
ers throughout the teaching period [7]. Therefore, predictive                   ditional estimation considering different predictors, their rel-
models based on continuous assessments, that are often part                     ative strength or joint features and conditional probability.
of engineering education curriculum, and those that can map                     These features provide flexibility in modelling practical data
out an early learning phase of students in a course, can poten-                 encountered in fields such as education where variables like
tially yield helpful information for academics to implement                     assessments, time spent on online learning management sys-
strategies to improve teaching and learning [8], [9]. The                       tems, and teaching or learning activities used to determine
qualitative and quantitative approaches employed to predict                     student learning outcomes.
student performance are categorised in the human-based and                         The choice of copula approach in this study is motivated
computer-based methods. Examples of human-based meth-                           by extensive applications of the method in many advanced
ods are those that use a teacher’s own judgement [10], [11]                     modelling areas. Examples include actuarial studies and
and self-reports [12] but computer-based methods often aim                      finance [23]–[25], econometrics and marketing [26]–[28],
to apply statistical and data mining methods to predict a                       and agriculture and hydrology [18], [19], [29]–[34]. Copulas
student’s performance [3], [13], [14]. Data mining tech-                        were recently used to investigate the influence of climate
niques use advanced statistics or machine learning methods,                     variability on systemic weather risks, particularly using joint
among others, as one of the most widely used approaches                         models to maximise the spatial diversification portfolios in
for performance prediction e.g., [1], [4], [7], [15], [16].                     insurance industry [29]–[31]. These studies, articulated the
Whilst these approaches are contributing towards develop-                       benefits of copulas in jointly studying the dependence struc-
ing evidence-based teaching strategies to advance student                       ture and modelling multivariate predictors/targets. It is imper-
progress in study disciplines, there is a need to develop                       ative to mention that probabilistic models are potent tools
advanced data mining methods [17] that can consider stu-                        that can evaluate the risk by considering the tail distribution
dent’s continuous assessments, and their joint effects with                     of any data, where for example, a set of extreme values are
other forms of ongoing tests. This may be useful to develop                     considered realistically and within a Bayesian model frame-
early intervention plans to prevent the failure in a course.                    work [35]. This copula approach can therefore extend the
   In this paper we developed multivariate distribution mod-                    capabilities/functionalities of conventional machine learning
els utilizing assessment (e.g. quiz, and assignment) to pre-                    models that are capable of simulating single data values in
dict a weighted score for engineering mathematics course                        a test set after taking the training parameters from a training
and determine its influence on the final grade using stu-                       set. It can also simulate the whole distribution, and tails (or
dent performance data and copula models. Copulas have                           extreme values) that machine learning may offer a limited
excellent capabilities to consider non-linear dependence                        capability to pursue. Taking the key findings from these
structure among variables and have shown good predic-                           studies, we also aver that the continuous assessments for
tive skills in modelling non-normally distributed data in                       engineering problem solving can take any value, occupy a
non-education areas [18]–[20]. It is worth noting that despite                  very low, or a very high score that creates a tail distribution
some attention to copulas in modelling non-linear marginal                      pattern. They could also differ in how a weighted score or
distribution data, there appears to be a paucity of straight-                   a final grade is distributed; so the capability of copulas in
forward approaches that can derive joint distribution func-                     studying tail distribution features jointly with a target variable
tions between the marginal distribution of a set of predictors                  is considerably advantageous in present research.
and a target. This is especially true for the field of educa-                      For the specific case of education and social sciences dis-
tion despite such variables playing a key determinant role                      cipline, copulas have been rather limited, although a study
in student success. It is therefore of prime interest to esti-                  by Vuolo [20] has built such models to simulate the spousal
mate joint distribution effects of interacting variables, such                  mortality with empirical examples of association between
as quizzes and assignments, and further identify how these                      unemployment and suicide rate. That study has considered

VOLUME 10, 2022                                                                                                                             45113

T. Nguyen-Huy et al.: Student Performance Predictions for Advanced Engineering Mathematics Course

the joint dependence structure between count (i.e., the num-           or on-campus (ONC) and the web-based, or online study
ber of days of drinking alcohol) in respect to a skewed,               mode (ONL). This work is therefore a pioneering study
continuous variable (i.e., grade point average) and therefore          employing a second-year student learning data (i.e., assign-
demonstrated the merits of copula models in social sciences.           ments, quizzes, examination marks and weighted scores) in
Similarly, copula models may be particularly beneficial in             an Advanced Engineering Mathematics course and aims to
studying a student’s performance based on assignments and              generalize the D-vine quantile regression modelling algo-
if such models are developed, the Faculty can adopt them to            rithm that typically has discrete student performance data.
mitigate risks of student failure in courses well ahead of an             As additional contribution and cross-validity of this study,
examination period [8]. The proposed copula models may be              we tested the developed copula models on a lower level, first
used to assist educators in better preparing students through          year engineering mathematics course ENM1600 (Engineer-
their learning journeys.                                               ing Mathematics) data whose results are also summarized in
   Justifications to adopt the copulas are made with respect           Appendix A.
to the significant proportion of student learning data, that              To ascertain the accuracy of the D-vine quantile regression
by the virtue of their social variability, learning patterns           model for its skill to predict engineering mathematics student
and causal factors, is divergent from a normal or Gaussian             performance, we evaluated this objective method (i.e., PDVR
distribution and free from assumptions used in traditional             and NPDVR models) against a conventional linear regression
models. By fitting an appropriate skewed distribution func-            (i.e., LR) model simulated for an independent test data. Given
tion to student assessment data (e.g., assignments as an input)        the nature of our numeric data, the study adopts parametric
versus a target (i.e., an examination score) or considering            estimation skill of the newly designed D-vine copulas with
another outcome of interest (i.e., a grade point average as a          an added contribution utilizing a modified algorithm that
categorical variable), educators can adopt copula functions            accounts for discreteness in data [36].
to explore the extent of association between these variables.             The rest of the paper describes the properties of copula-
Most importantly, problems where multivariate predictors are           based models, material and methodology, results and discus-
used in the education area can also adopt maximum likelihood           sion. Several challenges after the presentation of results are
techniques for prediction without any assumption on the                discussed, and a final section provides the conclusions.
marginal distribution of individual data, and therefore, formu-
late a variety of predictive models to emulate a target that is         II. BACKGROUND OF COPULAS
linked to a predictor variable [20]. To the best of the authors’       For brevity, only the most relevant details are presented here;
knowledge, no prior study has developed copula models to               readers may also refer to Appendix B for details. To predict
predict engineering mathematics performance, their grades or           Advanced Engineering Mathematics student performance,
weighted scores through multivariate continuous assessment             we first consider the theorem of Sklar [21] states that for a
data.                                                                  joint cumulative distribution function (JCDF) F (x1 , . . . , xd )
   The novelty is to develop for the first time, a D-vine              of a d-dimensional random variable (X1 , . . . , Xd ), we have a
quantile regression model to predict engineering mathematics           marginal distribution Fi (xi ), i = 1,. . . ,d that defines a copula
student performance using the specific case of an Advanced             function C such that
Engineering Mathematics course result, and employing sev-
eral continuous assessment marks and weighted scores used                         F (x1 , . . . , xd ) = C [F1 (x1 ) , . . . , Fd (xd )] .          (1)
to assign a passing or a failing grade. Advancing and expand-               The joint probability density function (JPDF) is expressed
ing the scope of our earlier machine learning-based study [1]          as
and the others [2-5; 7-16], the proposed D-vine quantile                                             " d          #
regression model aims to predict the whole distribution within                                        Y
                                                                            f (x1 , . . . , xd ) =          fi (xi ) c [F1 (x1 ) , . . . , Fd (xd )] (2)
a probabilistic framework rather than the single- or the mean
                                                                                                      i=1
test test values predicted by a conventional machine learning
model. The proposed D-vine quantile regression model (see              where fi (xi ) is the marginal density and
Section IV) has enabled us to perform an accurate and fast
                                                                                  ∂ d C [F1 (x1 ) , . . . , Fd (xd )]   ∂ d C (u1 , . . . , ud )
prediction with a unique advantage over classical quantile                  c=                                        =                          (3)
regressions such as avoiding quantile crossing and interaction                        ∂F1 (x1 ) . . . ∂Fd (xd )             ∂u1 . . . ∂ud
issues between the covariates. Therefore, our new copula                  is the copula density.
models are constructed in such a way that the non-influential             The copula model data, denoted as pseudo-data, has a
predictors are excluded to reflect a final parsimonious model.         uniform distribution on the interval [0,1] with a conversion
   Another major contribution is to adopt D-vine quantile              procedure known as univariate probability integral transfor-
regression model designed with both the parametric (PDVR)              mation. If Fi (xi ) is continuous, the associated function C :
and the non-parametric (NPDVR) copula family functions.                [0, 1]d → [0, 1] is unique. Otherwise, there exist many
For a highly robust model, we consider six years of                    possible copulas and all would coincide over RanF1 × . . . ×
data, over 2013-2018, in ENM2600 (Advanced Engineering                 RanFd where RanFi denotes the range of Fi [33]. Empirical
Mathematics) that are categorised in terms of face-to-face,            applications of the copula approach are possible for discrete

45114                                                                                                                                   VOLUME 10, 2022
T. Nguyen-Huy et al.: Student Performance Predictions for Advanced Engineering Mathematics Course

TABLE 1. The parametric bivariate copula families with the copula generator function, its parameters, the lower and upper tail dependence coefficients
and the relationship between parameters and Kendall’s tau (τ ) coefficients.

marginal distributions that carefully consider modelling and                       For every x ∈ R2 where ϕ is a generator func-
interpreting the dependence, as highlighted in [37]. For a                      tion and both copulas are symmetric so their lower
detailed representation of the mathematics of copulas, readers                  and upper tail dependence coefficients can be the same
can consult papers elsewhere e.g., [38] or [39].                                (see Table 1).
                                                                                   When the margins of variables are diverse, other mea-
A. ELLIPTICAL COPULAS                                                           sures of association such as Kendall’s τ and Spearman’s
Gaussian (or Normal) and Student’s t copula derived from the                    ρ should be used because of the influence from form
density function of an elliptical distribution with mean zero                   of the marginal distributions on the correlation. Table 1
and correlation matrix which is expressed as:                                   provides such a measure, in terms of the value of τ ,
                                                                                which is a non-parametric, robust and efficient estimator
                                   h             i                              of the associations for both elliptical and non-elliptical
                  hϕ (x) = |6|1/2 ϕ (x)0 6 −1 (x) .                   (4)       margins [40].
VOLUME 10, 2022                                                                                                                                  45115
T. Nguyen-Huy et al.: Student Performance Predictions for Advanced Engineering Mathematics Course

                                                                               consider Tj , j = 1, 2, 3 with each tree Tj having 5 - j nodes
                                                                               and 4 - j edges; each edge corresponding to a paired-copula
                                                                               density U as the copula data, i.e., original data that were
                                                                               transformed into a uniform distribution with values in [0,1]
                                                                               using kernel density estimation (non-parametric method, not
                                                                               parametric distribution such as Weibull or Gamma). U 1 can
                                                                               be Quiz 1, for example, but not necessary, and U 1 can be any
                                                                               variable depending on the course and the mode of offer as a
                                                                               general copula model. The four-dimensional C-vine structure
                                                                               is generally expressed as
FIGURE 1. (a) Four-dimensional vine copula models constructed as a                  f (x1 , x2 , x3 , x4 )
regular (R)-vine, (b) Canonical C–vine copula structure, and (c) Drawable
D–vine copula structures. This study used drawable vine (D-vine). Note                  = f1 (x1 ) .f2 (x2 ) .f3 (x3 ) .f4 (x4 )
that the joint distribution between variables u is modelled by copula
function C . For example, C12 is the copula function for u1 or quiz mark,                   .c12 [F1 (x1 ) , F2 (x2 )] .c13 [F1 (x1 ) , F3 (x3 )]
and u2 or assignment mark; C13|2 is the copula function for C 12 and
C 23 i.e. u1 and u3 conditioned on u2.
                                                                                            .c14 [F1 (x1 ) , F4 (x4 )]
                                                                                            .c23|1 F2|1 (x2 |x1 ) , F3|1 (x3 |x1 )

B. ARCHIMEDEAN COPULAS
                                                                                            .c24|1 F2|1 (x2 |x1 ) , F4|1 (x4 |x1 )

Archimedean copulas (ACs) have a relatively simple form for
                                                                                            .c34|12 F3|12 (x3 |x1 , x2 ) , F4|12 (x3 |x1 ) ,

their construction and therefore resulting in a large variety                                                                                         (6)
of copulas within this family. Bivariate ACs are defined as                    and the four-dimensional D-vine
follows [41]
                                                                                    f (x1 , x2 , x3 , x4 )
               C (u, v) = ϕ [−1] [ϕ (u) + ϕ (v)] ,                    (5)
                                                                                        = f1 (x1 ) .f2 (x2 ) .f3 (x3 ) .f4 (x4 )
where the generator function ϕ is a continuous strictly                                     .c12 [F1 (x1 ) , F2 (x2 )] .c23 [F2 (x2 ) , F3 (x3 )]
decreasing convex function such that ϕ(1) = 0 and ϕ 1 being
                                                                                            .c34 [F3 (x3 ) , F4 (x4 )]
a pseudo-inversion. By inserting the generator function in
                                                                                            .c13|2 F1|2 (x1 |x2 ) , F3|2 (x3 |x2 )

Equation 5, one can derive various copula families, as shown
                                                                                            .c24|3 F2|3 (x2 |x3 ) , F4|3 (x4 |x3 )

in Table 1.
   The two-parameter ACs [42] are from a mixture of two                                     .c14|23 F1|23 (x1 |x2 , x3 ) , F4|23 (x4 |x2 , x3 ) .

                                                                                                                                                      (7)
different one-parameter copulas. These mixed copulas can
capture different types of dependence, i.e., lower or upper tail                  In this decomposition, the selection of pairwise copula is
dependence or both. For example, the BB7 has one parameter                     independent of each other so such paired-copula construc-
for modelling the lower tail dependence and another for the                    tions allow arbitrary types of bivariate copulas to be used
upper (see Table 1).                                                           in the building blocks and available for applications in high
                                                                               dimensional datasets.
C. VINE COPULAS                                                                   It is imperative to mention that the vine copulas used in this
To apply our method for the specific cases of Advanced                         paper is very flexible in modelling asymmetric distribution of
Engineering Mathematics, this study adopts a Vine copula                       data (for example, student performance marks being skewed
method, also known as a pair-copula construction [43] based                    to a certain value) and tail dependence (e.g., marks being
on the merits that it can overcome the aforementioned limi-                    too low, or too high rather being than uniformly distributed).
tations. In principle, the vine method constructs joint density                Given the high-dimensional model that we require in this
in Equation 2 into a sequence product of (conditional) bivari-                 research work, vine copulas were considered to address the
ate copula densities, so-called pair-copulas, and its marginal                 limitations of the other methods such as elliptical copulas
densities so in this study, conditional copulas are used to pre-               and ACs [43].
dict student’s passing grades using their continuous assess-                      For the case of a D-vine based regression model, U 1 would
ment marks. Generally, Vine copulas are expressed in three                     actually become V , which is the response variable (i.e., WS or
forms: regular (R)-vine, canonical (C)-vine, and drawable                      EX ), and the other U 1, U 2, U 3 (in this case study) correspond
(D)-vine copulas. The class of R-vine is still very general and                to U 2, U 3, and U 4 in the 4-dimensional D-vine model.
embraces a large number of possible pair-copula     decomposi-                 To predict WS (i.e., variable V), the variables U 1, U 2, U 3
                                  d −  2
                                        !
                                                                               (in this case study) can be examination score, assignment 1,

             d                                                                 and quiz 2, respectively, depending on the D-vine structure
tion, i.e.,      × (d − 2)! × 2 2         while the C-vine and                 (or its order) selected via maximum conditional likelihood.
             2
D-vine provide a specific way to decompose the density into                    Therefore C12 for example denotes the bivariate copula of
d (d − 1) /2 unique copulas.                                                   U 1 and U 2 (or V and U 1) and C23 is the bivariate copula for
   Figure 1 depicts the construction of a four-dimensional                     U 2 and U 3. C13|2 is the bivariate copula for C12 and C23,
vine copula that includes three trees. To interpret this,                      i.e., U 1 and U 3 conditioned on U 2.

45116                                                                                                                                     VOLUME 10, 2022
T. Nguyen-Huy et al.: Student Performance Predictions for Advanced Engineering Mathematics Course

D. FITTING MARGINAL DISTRIBUTIONS                                               F. COPULA PARAMETER ESTIMATION
To develop models for engineering mathematics student                           This study adopts the most common methods: full (or exact)
performance prediction, we followed a first step in devel-                      maximum likelihood (FML) and an inference function for
oping copula models by correctly fitting the marginal distri-                   margins (IFM) [51] to estimate the copula parameters.The
butions of student performance marks and weighted scores                        FML method accords to a method where the likelihood is
to attest their uniformity or dis-uniformity. This followed                     maximised over the copula parameter and margin parameters
the notion that marginal distributions can be modelled based                    simultaneously, and thus also called the one-step ML proce-
on parametric or non-parametric methods where parametric                        dure. The estimated copula parameter θ̂ is acquired by max-
techniques are used to fit each variable to a proposed theoret-                 imising the log likelihood and the log-likelihood function, for
ical distribution function (e.g., Normal, Gamma, or Weibull)                    example for a bivariate case, is defined as:
                                                                                          n
using maximum likelihoods [44], moment matching [45],                                    X
                                                                                 l (θ) =      log c F1 x1,i , F2 x2,i f1 x1,i f2 x2,i .

quantile matching [46], or goodness-of-fit (GOF) [9] proper-
                                                                                           i=1
ties. Non-parametric methods use empirical cumulative dis-
tribution function or continuous smoothing estimator:                                                                                          (9)
                                                                                   Clearly, θ̂ is the global maximizer of l (θ) and the asymp-
                                    x − x (i)
                            n
                         1X
                F̂ (x) =       K                ,           (8)                 totic theory can be applied to both the margins as the copula
                         n             h                                        under standard regularity conditions. Hence, the maximum
                               i=1
                   Rx                                                           likelihood estimator converges
                                                                                                               to anormal distribution   with
where K (x) = −∞ k (t) dt and k (·) is a symmetric proba-                                          √
                                                                                mean zero, i.e., n θ̂ − θ ∼ N 0, J −1 (θ0 ) where θ0 is

bility density function and h > 0 is a parameter.
                                                                                the true value and J denotes the Fisher’s information matrix.
                                                                                The estimates of the ML parameter can be acquired using a
E. FITTING COPULAS
                                                                                numerical maximisation method. However, this can be com-
As an important consideration for developing models for                         putationally difficult for high dimensional models because
engineering mathematics student performance prediction,                         the parameters of margins and the dependence structure are
we were mindful that copulas can be selected using several                      jointly estimated.
measures e.g., statistical GOF tests or the information-based                      In accordance with the proposed IFM method, the marginal
criteria. GOF can be performed either based on White’s                          distribution parameters are estimated first by optimising sep-
information matrix equality [47], [48] or based on Kendall’s                    arately each marginal likelihood. Subsequently, the copula
process [49] that produces test statistics and p-value to reject                parameter is acquired by optimising concentrated likelihood
or accept a parametric copula. Though Akaike information                        in the second step. Thus, this method is also referred as
criteria (AIC) and Bayesian information criteria (BIC) [38]                     the two-step ML procedure. Under      standard  regularity con-
do not provide any understanding about the power of the deci-                                                  √
                                                                                ditions, we also have that n θ̂ − θ0 is asymptotically
sion rule employed, they allow for an efficient comparison of
fitting between different copulas based on single numbers by                    normal with mean zero. The IFM method is found to be as
correcting the log-likelihood for the number of parameters                      a highly efficient estimator closed to the FML but computa-
used in a model, i.e., the model with smallest AIC (or BIC) is                  tionally more attractive compared to the FML [42], [52].
chosen. Furthermore, these criteria-based methods take less                        If the margins are estimated non-parametrically using their
time to compute than GOF tests. In particular, they take the                    empirical CDFs, then it results in the semi-parametric (SP)
relatively simple forms of AIC = −2l (θn ) + 2k and BIC =                       method (Genest, Ghoudi, and Rivest, 1995). Let û = e   FX (xi )
−2l (θn ) + klogn where k and n denote the number of free                       and v̂ = eFY (yi ) be the pseudo-data of observations acquired
parameters and the sample size, respectively. The estimation                    by their empirical CDFs, the unknown copula parameter are
of the copula parameter θ is described in the next section.                     estimated by the maximising the pseudo log likelihood as:
                                                                                                           n
Also, the penalty for two-parameter families when using BIC                                                X           X
                                                                                                    θ̂ =                   ûi , v̂i ; θ .

is stronger than when using the AIC [50].                                                                        log                         (10)
   Since the criteria-based methods do not perform a formal                                                i=1

                                                                                   It can be seen that the joint CDF of (X , Y ), C û, v̂; θ

GOF hypothesis test, they therefore cannot state whether
the copula family with the least AIC/BIC is suitable for the                    is consistent whether the marginal distributions are known
particular case. If the true unknown copula is not among                        or not. Compared to the FML and IFM (with parametric
the series of candidates, selecting the copula with the least                   margins), the SP method allows the margins to take arbitrary
criteria value may be incorrect. Thus, using these criteria                     and unknown functional forms. A possible shortcoming of
in combination with GOF test is preferred to avoid the                          the fully parametric models (i.e., FML and IFM methods)
misinterpretation for the copula model selection. Alterna-                      is that the copula parameter estimation may be inconsistent
tively, to reduce computational cost for GOF tests, several                     even when just one of the margins is mis-specified. The SP
graphical tools can also provide useful visual analysis                         is found to performs better than ML and IFM methods when
supporting the copula selection such as CDF or lambda                           the margins are unknown which is the most frequent case in
plots.                                                                          practice [53].

VOLUME 10, 2022                                                                                                                              45117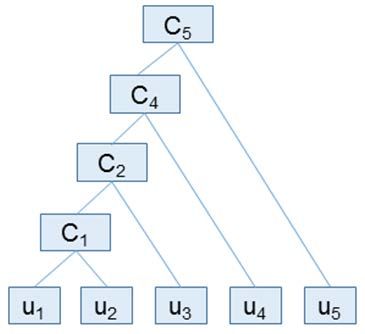
T. Nguyen-Huy et al.: Student Performance Predictions for Advanced Engineering Mathematics Course

III. MATERIALS AND METHODS                                              using data over 2013-2018 taking into account two teaching
A. STUDENT PERFORMANCE DATA                                             semesters. Before obtaining engineering mathematics stu-
To design and evaluate the newly PDVR and NPDVR                         dents’ performance data, an ethical approval (H18RE236)
copula-based models used in the prediction of engineer-                 was applied for, and granted by the university’s ethics com-
ing mathematics student success, this paper has analysed                mittee in accordance with the Australian Code for Respon-
data from a second-year engineering mathematics course                  sible Conduct of Research (2018) and National Statement
(ENM2600 Advanced Engineering Mathematics & and                         on Ethical Conduct in Human Research (2017). The project
ENM1600 for ENM2600 Engineering Mathematics) used                       was considered low-risk as it did not collect any student’s
earlier in developing a machine learning model [1]. The                 identifiable information directly.
data comprised of continuous internal assessments and
weighted scores from 2015-2015 used to assign a pass-                    B. CONSTRUCTING D-VINE REGRESSION MODEL
ing or failing grade. The ENM2600 data had marks for                    We applied D-vine based regression modelling meth-
743 online (ONL) and 716 on-campus (ONC) students,                      ods to predict a response Y (i.e., examination mark or
whereas ENM1600 (whose results are included in the                      weighted score in engineering mathematics) given the influ-
Appendix) had marks for 817 ONC and 1299 ONL stu-                       ence of a predictor X1 , . . . , Xd (e.g., assignment or quiz
dents generated after a data-cleansing phase that deleted               score in engineering mathematics), with d ≥ 1. Our
all missing rows/student records. These courses are taught              D-vine based regression method concurs with literature [54]
and administered by the School of Mathematics, Physics,                 so here, we present only the main steps in this tech-
and Computing in the Faculty of Health, Engineering, and                nique, noting that the prediction is attained via a condi-
Sciences at the University of Southern Queensland (USQ)                 tional quantile function of joint distribution of X and Y
in Australia. Other than being a core component of the                  expressed as
engineering curriculum to meet Engineer’s Australia pro-
gram requirements, ENM2600 plays an essential role as                                                       |X1 ,...,Xd (α |x1 , . . . , xd ) ,
                                                                                 qα (x1 , . . . , xd ) = FY−1                                     (11)
a service course for several programs including a Bache-                where α ∈ (0, 1) is the quantile levels of interest.
lor degree in Engineering, Master of Science, and others.                  We followed the notion that with V = FY (Y ) and Ui =
ENM2600 is an updated course from a previous curriculum                 Fi (Xi ), the corresponding values v = FY (y) and ui = Fi (xi )
to satisfy the Australian engineering program accreditation             with a transformation using kernel density method (Gaussian
requirements.                                                           kernel) and the plug-in bandwidth to minimise the asymp-
   In the ENM2600 course, student performance is assessed               totic mean integrated squared error so that conditional copula
using two quizzes (marked out of 50), denoted as Q1 & Q2,               function takes the form of
and three assignments (marked out of 150) denoted as A1,
A2 & A3, including a final examination (marked out of 600),                          FY |X1 ,...,Xd (y |x1 , . . . , xd )
denoted as EX that generates a weighted score, in %, WS to                               = P [FY (Y ) |F1 (X1 ) , . . . , Fd (Xd )]
assign a passing grade (HD, A, B, C, or D). These assessments
                                                                                         = CV |U1 ,...,Ud (v |u1 , . . . , ud ) .                 (12)
include topics on mathematical concepts from an introduction
to the advanced skills for engineering and surveying profes-            The inverse function is therefore
sionals (Complex Numbers, Ordinary Differential Equations,
Series, Multivariable Calculus, and Linear Algebra). Areas                  |X1 ,...,Xd (α |x1 , . . . , xd )
                                                                         FY−1
such as Ordinary Differential Equations and Series topics                                   = FY−1 CV |U1 ,...,Ud (v |u1 , . . . , ud ) .

                                                                                                                                                  (13)
include direction fields, Euler’s method, first order separa-
ble ODEs, first order and second order linear ODEs with                 The estimated quantile of the response variable can be
constant coefficients, Taylor and Fourier series. Multivari-            obtained as
able Calculus includes representation of functions of several
                                                                         q̂α (x1 , . . . , xd )
variables, surfaces and curves in space, partial differentiation,                                   h                                    i
optimisation, directional derivatives, gradient, divergence and                              = F̂Y−1 ĈV−1|U1 ,...,Ud α û1 , . . . , ûd ,       (14)
curl, line integrals of the 1-st and 2-nd kinds, iterated inte-
                                                                        where ĈV−1|U1 ,...,Ud α û1 , . . . , ûd increases monotonically

grals, and Green’s theorem. The assessment items (quizzes
and assignments) are spread through a 13 week teach-                    in α.
ing semester and provide an ongoing evaluation of student                   This computation requires one to estimate the multivariate
performance.                                                            copula first. It is noted [54] have suggested fitting a D-vine
   In this study, we considered various datasets from the engi-         copula to data (V , U1 , . . . , Ud ) with a fixed order V − Ul1 −
neering mathematics course. As USQ is renowned for both                 . . . − Uld in such a way that V is the first node in the first
web-based (online) and on-campus (face-to-face) teaching,               tree) with (l1 , . . . , ld ) as the ordering of d-dimensional D-
in this study, the performance data for engineering mathe-              vine copula as an arbitrary permutation of (1, . . . , d).
matics students were taken from ONL or ‘‘online’’ and ONC                   The conditional distribution of the response V given
or ‘‘on-campus’’ offers. All predictive models were built               the predictors (U1 , U2 , U3 ) is recursively expressed

45118                                                                                                                                    VOLUME 10, 2022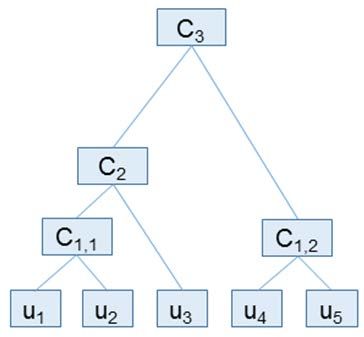
T. Nguyen-Huy et al.: Student Performance Predictions for Advanced Engineering Mathematics Course
in four-dimensional D-vine with order V − U1 − U2 − U3 as
CV |U1 ,U2 ,U3 (v |u1 , u2 , u3 )
= hV |U3 ;U1 ,U2 CV |U1 ,U2 (v |u1 , u2 ) CU3 |U1 ,U2 (u3 |u1 , u2 )
= hV |U3 ;U1 ,U2 hV |U2 ;U1
CV |U1 (v |u1 ) CU2 |U1 (u2 |u1 ) hU3 |U1 ;U2
CU3 |U2 (u3 |u2 ) CU1 |U2 (u1 |u2 )
= hV |U3 ;U1 ,U2 hV |U2 ;U1 hV |U1 (v |u1 ) hU2 |U1
(u2 |u1 ) ] hU3 |U1 ;U2 hU3 |U2 (u3 |u2 ) hU1 |U2 (u1 |u2 ) .
(15)
And thus, the conditional quantile function is defined as
CV−1|U1 ,U2 ,U3 (α |u1 , u2 , u3 )
n h
= h−1 V |U1 hV |U2 ;U1 hV |U3 ;U1 ,U2 α hU3 |U1 ;U2
−1 −1
hU3 |U2 (u3 |u2 ) hU1 |U2 (u1 |u2 ) |
hU2 |U1 (u2 |u1 ) |u1 .
(16)
The conditional copula function has been expressed in terms
of nested h-function and its inversion corresponding with the
pair-copula, i.e.
∂ ĈVU (v, u)
ĈV |U = hV |U = . (17)
∂u
As the order of predictors can be arbitrary, it can result several
D-vine copula models. Hence, to select a parsimonious model
for our study, i.e., the influential predictors can be added into
the model, and the order of predictors yielding the most power
of predicting the response, the order of the Ui is parametrised
and selected via maximum conditional likelihood [8].
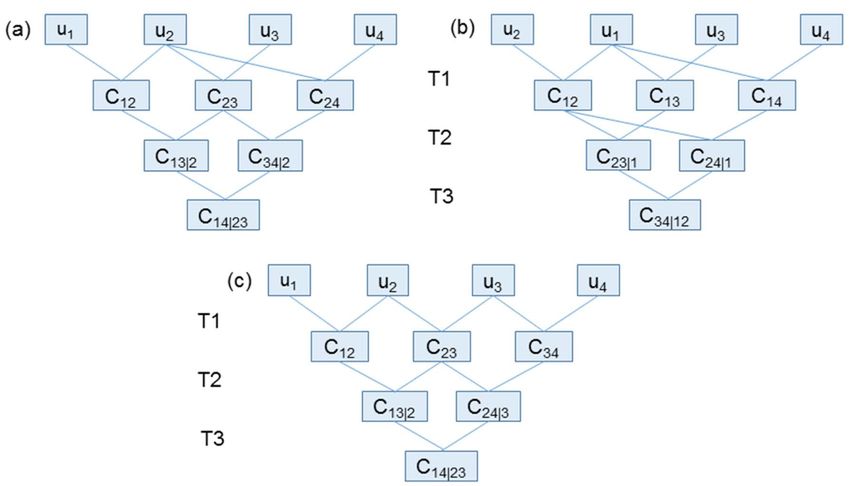
The proposed algorithm in this study accords to [54],
and it has many advantages in constructing a D-vine copula FIGURE 2. Flowchart describing the primary steps required to develop the
model as it can automatically choose the influential pre- parametric D-vine regression, PDVR and non-parametric D-vine
regression, NPDVR models used to predict student performance in
dictors by ranking them based on their strength of predict- ENM2600 Advanced Engineering Mathematics course.
ing response and thus ignoring any superfluous variables.
The method, therefore, automatically overcomes the typical success, we explored causal relationships between continu-
issues of regression such as collinearity, transformation, and ous assessments. We therefore utilized the three assignments
inclusion/exclusion of predictors. Furthermore, as mentioned (i.e., A1, A2 & A3), two quizzes (Q1 & Q2), examination
above, the D-vine copula allows flexible modelling of the scores (EX ) and the weighted score (WS) to evaluate the util-
dependence between the response and the selected predictors. ity of PDVR and NPDVR, in respect to the linear regression
In Figure 2, we describe the steps in this study. For the model.
case of using parametric copula families described in Table 1 The results are shown in Figure 3, where Kendall’s cor-
we denoted the model as a parametric D-vine regression relation coefficient τ and the corresponding Kendall’s plots
model (PDVR). Otherwise, if non-parametric copula families are created for the specific case of ENM2600 considering
(independence and transformation kernel) were used, then students marks for on-campus and online course modes. Next,
the model was a non-parametric D-vine regression model we also explored these data in terms of a Kendall plot in
(NPDVR). accordance with [55] and [33] that attempts to generate infor-
mation on bivariate copulas equivalent to a quantile-quantile
IV. RESULTS AND DISCUSSION plot approach.
A. EXPLORATORY ANALYSIS To interpret this, we must determine whether data points
To appraise the performance of parametric D-vine regression, lie approximately on the diagonal, and if so, then the two
PDVR and non-parametric D-vine regression, NPDVR-based variables can be approximately independent. By contrast,
models to investigate student performance and to exam- a deviation of the data points away from the diagonal line
ine its practicality in Advanced Engineering Mathematics is expected to indicate the dependence between the two vari-
decision-making through probabilistic prediction of student ables. If this happens for the plot representing Q1 and WS
VOLUME 10, 2022 45119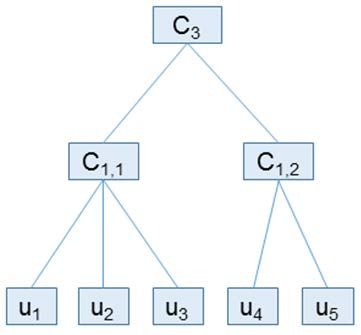
T. Nguyen-Huy et al.: Student Performance Predictions for Advanced Engineering Mathematics Course

                                                                               of course content, is the most dominant indicator of weighted
                                                                               score, and therefore plays a vital role in a passing grade
                                                                               awarded to a student.
                                                                                  When assessed in terms of the Kendall tau plot, the above
                                                                               result is further confirmed where all data points are approxi-
                                                                               mately located on the curve associated with a perfect positive
                                                                               dependence. For example, in case of ENM2600, the degree
                                                                               of association between EX and WS in ONC student cohort
                                                                               yields a Kendall’s correlation coefficient ≈ 0.847, which
                                                                               is only slightly larger than that of the ONL student cohort
                                                                               (≈ 0.80). However, the association between all continuous
                                                                               assessments and WS for ONL student cohort is generally
                                                                               stronger than that of ONC cohort. The association between
                                                                               continuous assessments and EX for the ONL cohort is also
                                                                               higher than that of ONC cohort, except for the case of A1.
                                                                               Furthermore, it can be construed that the influence of Q1 and
                                                                               Q2 on the values of EX and WS is relatively small in both
                                                                               the ONC and the ONL cohort. By contrast, for ENM1600
                                                                               (see the Appendix), the degree of association between EX
                                                                               and WS of the ONL cohort (with Kendall’s correlation coef-
                                                                               ficient ≈0.86) is slightly greater than that of the ONC cohort
                                                                               (≈0.84). It is interesting to see that A1 still has the highest
                                                                               degree of association, with EX and WS for the ONC student
                                                                               cohort while Q1−3 have a greater association with EX and
                                                                               WS, compared to A1−2 for the ONL student cohort.

                                                                                B. COPULA-BASED PREDICTIVE MODEL OUTCOMES
                                                                               The accuracy of a resulting copula model by non-parametric
                                                                               fitting of the marginal distributions was checked using graph-
                                                                               ical analysis.
                                                                                  Figure 4 is a histogram of assignment, A1 that has been
                                                                               overlaid by an empirical density and a density derived from
                                                                               the kernel function estimate. Evidently, the data appears to be
                                                                               appropriately fitted using the proposed kernel and the plug-in
                                                                               bandwidths of this plot that describe these data characteris-
                                                                               tics. The right side shows the histogram of the probability
                                                                               integral transform that reveal considerable degree of unifor-
                                                                               mity across the unit interval.
FIGURE 3. The Kendall’s correlation coefficient and Kendall’s plot used to
explore student performance data in ENM2600 Advanced Engineering                  Table 2 represents the most appropriate parametric bivari-
Mathematics course for: [a] on-campus (ONC) face-to-face, and [b]              ate copulas selected for all pairs between the continuous
online (ONL) web-based student cohorts.
                                                                               assessment marks with the value of EX and with the value
                                                                               of WS for both study modes. This selection is based on
in such a way that the distance is relatively large, we would                  the magnitude of the AIC and the significance level of the
observe a stronger degree of dependency among these bivari-                    statistical independence test that is set to p ≈ 0.05 [50].
ate data. If the data however are located above the diagonal,                     The result is jointly attested with a lambda-plot, as per
one would expect a positive dependence, or vice versa if the                   Figure 5. To interpret this, compare the empirical and theoret-
data are located below the diagonal for a negative dependence                  ical λ-functions that indicates that the BB6 and the Gumbel
result.                                                                        copulas appear to be the optimal model candidates among the
   A closer examination of Figure 3 reaffirms the vital                        various bivariate copula families. This is because these two
importance of examination score (EX ) in predicting the                        copulas demonstrate good ability to model the dependence
weighted score (WS) for both on-campus and online offers of                    structure between EX and WS for ENM2600 ONC student
ENM2600 course. This is evident through a greater weighted                     cohort. Notably, the BB6 copula yields a smaller AIC and
proportion of WS (versus Q1, Q2, A1, A2 and A3) required                       thus, must be selected for further modelling and analysis of
to yield a WS value as indicated clearly by high Kendall’s                     student performance.
correlation coefficient. This result, although not surprising,                    The present results show that copula-based models are rel-
indicates that the examination mark which constitutes a bulk                   atively advanced in capturing tail dependence jointly between

45120                                                                                                                                     VOLUME 10, 2022
T. Nguyen-Huy et al.: Student Performance Predictions for Advanced Engineering Mathematics Course
FIGURE 4. An illustrated example of kernel density estimation as
required to fit marginal distribution of Assignment 1 (A1) to predict
on-campus engineering mathematics ENM2600 student performance and
the probability integral transformation.
FIGURE 5. Empirical and theoretical λ-functions among different
bivariate copula models employed to simulate the joint distribution of
predictors and a target variable. For example, for ENM2600 examination and weighted scores in ENM2600 Advanced Engineering
Mathematics. [a] on-campus (ONC) face-to-face and [b] on-line (ONL)
ONC students, the correlation between continuous assess- web-based course offers using between Assignment 1 and Assignment 2.
ments and EX, or WS, are modelled well by copula functions The dashed lines represent the limits that correspond to statistical
associated with tail dependence (see Table 2). The result independence (i.e., τ = 0) and co-monotonicity (i.e., τ = 1, λ = 0)).
obtained implies that students who physically attend classes
in on-campus course offer, are more likely to attain a rel- Furthermore, high coefficients of the lower tail dependence
atively good score in continuous assessments, and as such, between the two important assessments (i.e., A1 and A2)
will have a plausible chance to obtain a high EX and WS. and WS for both course modes imply that there is a greater
For example, the bivariate copula constructed between WS probability students will have very low WS if they have a
and EX data (ONL) attained a higher (lower) Log likelihood very low score for A1 and A2. On the other hand, EX and
and AIC of logLik = 975.90 and −1947.80, whereas for WS exhibit high upper tail dependence reflecting the fact
ONC, these were 794.05 and −1581.54 respectively. On the that students probably have a very high WS if they have a
contrary, students are likely to have extremely low scores very good result for the EX. The estimated τ -value (indicated
for EX and WS if they attain very low outcomes in their in Table 1) derived from copula models is also found to be
continuous assessments. similar to the empirical values (i.e., Fig. 6). Our findings offer
To investigate the case of ONL course offers, we note that strong indications of the practical utility of copula models in
elliptical copulas are dominant in modelling the association jointly capturing the dependence structure among the student
between pairwise variables, and in particular, between contin- learning variables.
uous assessments and EX. This reflects a weaker dependence In this study, we also developed bivariate copula mod-
in the upper and lower tail between the data pairs of interest. els for a probabilistic prediction of EX and WS that was
VOLUME 10, 2022 45121T. Nguyen-Huy et al.: Student Performance Predictions for Advanced Engineering Mathematics Course
TABLE 2. Parametric bivariate copula model development parameters
with each explanatory variable (Quiz Q and Assignment A) paired with
response variable (i.e, Examination Score EX and Weighted Score WS
after best copula selection. The lowest Akaike Information Criteria (AIC),
in agreement with the lambda plots shown in Figure 5 were used with A1
selected as the best predictor for EX and the BB1180 copula selected to
model the pairwise EX -A1 relationship showing that A1 is a first
predictor added into the proposed D-vine regression model after the
response variable EX. Note: UTD = upper tail distribution, LTD = lower tail
distribution, logLik = log-likelihood, AIC = Akaike Information Criterion,
θ1 and θ2 = optimal copula parameters and τ = Kendall tau coefficient.
FIGURE 6. Bi-variate Copula Models: Conditional probability plot of
examination score (EX ) being less than or equal to a certain mark, ex
given that assignment A1 is less than or equal to a certain mark, a1 in the
ENM2600 course in both on-campus and online students.[To interpret
this result, consider an on-campus student who has an Assignment
1 score of 150/150 marks, is expected to have a 60% probability to score
a 300/600 examination score (or a pass in the examination).
Figure 10 in Appendix A are examples of EX predictions
given the conditional outcomes A1 for both study mode. More
precisely, the figure shows the probability that the EX is less
than or equal to a specific score given A1 is less or equal to
a specific score. To observe the difference in the probability
over the distribution, the values of conditioning variables
(A1) are set to a wide range, from very low score to very high
score (i.e., representing different quantiles).
An interpretation of these plots is relatively straightfor-
ward. For example, if a student studying ENM2600 gets a
low score for A1 = 20 (out of 150), the probability that
a student has EX = 250 (out of 600) is approximate 77%
without knowing the result of A2 for both course offer modes.
conditional on student performance in continuous assess- This probability is especially higher or ≈88 % if the student
ments by using D-vine regression model. Figure 6 and takes the ENM1600 (see the Appendix) but study through the
45122 VOLUME 10, 2022T. Nguyen-Huy et al.: Student Performance Predictions for Advanced Engineering Mathematics Course
(and Appendix A for the case of ENM1600), are illustrations
showing the probability of an EX being less than or equal
to a specific score, ex given A1 and A2 is less than or equal
to a specific score a1 and a2. For example, students taking
ENM2600 ONC course with low scores in both A1 = 20 and
A2 = 30 are likely to have a probability of ≈84% to get
EX score lower than the average. This probability is slightly
higher for ONL students as 87%, and these results are also
confirmed for the case of ENM1600 (see Appendix A).
For the bivariate model, students studying under the
ONC (ONL) course mode who have also attained, for exam-
ple, A1 = 80 or A1 = 60 will have estimated probabil-
ity of ≈76% (74%) or ≈77% (70%) to attain EX = 300
(i.e., a borderline pass) for ENM2600 or ENM1600 (see the
Appendix), respectively. However, when lower assignment
marks are considered, for example A2 = 30 or A2 = 20,
these figures elevate to ≈84% (86%) or ≈83% (83%). These
findings are expected when a student attains an average score
for A1 and also get the lowest score for A2, in which the
probability of these students will have a low score for EX is
higher. In addition, students who have the same performance
in A1 = 130 for ENM2600 or A1 = 100 for ENM1600 can
have a higher chance to attain a high EX score if they have
better results in A2.
To further corroborate these findings, we note that, for both
study modes in ENM2600 course, students with a good score
in A1 but a low score in A2 (e.g., A1 = 130 and A2 = 30)
are expected to have a higher probability of getting an EX
that is lower than a specific threshold, compared to those
with low score in A1 but a high score in A2 (e.g., A1 =
40 and A2 = 120). Furthermore, the conditional probability
of the ONL course mode is more spread than that of the
FIGURE 7. Tri-variate Copula Models: Conditional probability plot of EX ONC course mode. This implies that there appears to be a
being less than or equal to a certain mark given that A1 and A2 are less larger difference in the probability of achieving an EX score
than or equal to a certain mark (a1 and a2) for ENM2600 course in both
on-campus and online students. [To interpret this result, consider an between the student groups who have low scores and those
on-campus student with A1 = 20/150 marks and A2 = 30/150 marks, who have good scores in both A1 and A2.
expected to have 80% probability to score an EX = 250/600 marks.
In the next stage, the performance of newly developed
copula-statistical predictive models was evaluated by split-
ONL course offerings. Clearly, a higher score for continuous ting the entire dataset into two separate parts: one for training
assessment can lead to a lower probability that the student and another for testing purposes so the generalisation skill of
can have EX lower than the average value (300/600). It is also the model can be benchmarked. To implement this strategy,
worth pointing out that ENM1600 represents an opposite pat- ≈25% of the data are randomly selected for testing and ≈75%
tern to ENM2600 (see Figure 10 in Appendix A), as indicated for building these models. This procedure is also repeated
by the fact that if a student doing ENM1600 ONL mode has 100 times to account for any stochastic variations among
a low score for A1 = 40, the probability that the student will input and target sets. Note that this newly proposed algorithm,
have EX = 250 is ≈66%. This is lower than that of ≈74% for elaborated in Figure 2, was applied to select the most parsi-
the ONC course offer. While for ENM2600, these figures are monious D-vine copula model in each of the training phases.
≈78% for ONL mode and ≈70% for the ONC course mode. Table 3 and the material in Appendix A, summarize
From an education decision-making perspective, it is of the most optimal PDVR and NPDVR models was built
prime interest to our study to see how the predicted EX can for the prediction of EX and WS based cll and cAIC
vary given the joint effect of A1 and A2 as this information can using continuous assessment marks as the predictors. Evi-
be practically useful in investigating the relative contribution dently, the NPDVR models appear to exhibit a greater
of the students’ continuous learning towards their final exam- degree of parsimonious behaviour relative to the PDVR
ination. This can be done by extending the bivariate copula model. For example, this model utilizes fewer predictor
models to the case of multivariate copula models. For the variables to produce the same quality student performance
tri-variate copula models, Figure 7 for the case of ENM2600, predictions.
VOLUME 10, 2022 45123T. Nguyen-Huy et al.: Student Performance Predictions for Advanced Engineering Mathematics Course
FIGURE 8. Boxplots showing the root mean squared error produced in the prediction of EX and WS using an ensemble of
100 simulations using the proposed parametric D-vine regression (i.e., PDVR) and the non-parametric D-vine regression (i.e., NPDVR)
models against a traditional linear regression (LR) method.
In Table 4, we show the selected D-vine copula model The results of the predicted mean values of EX and WS in
created with joint structure EX -A1-Q2-A2-Q1 for ENM2600 the testing phases are presented in Figure 8 and the materials
ONC student cohort. In the first tree, the edge 1, 2 denotes in Appendix A, together with traditional method using linear
the pair-copula between the response EX and predictor A1 regression (LR) are shown for comparison. The predicted
(i.e., the most influential variable) and the corresponding cop- mean values are obtained by setting the quantile level α ∈
ula function, which is constructed through the survival BB1 (0, 1) in 100 repetitions of the model. The box plot reflects
(BB1180) algorithm. The next edge 2, 3 is the pair-copula the stochastic property of three regression models at different
between A1 and Q2, and so forth. The importance of each quantiles represented by the values of the median, interquar-
predictor added into the copula model in each step is also tile range (IQR) (i.e., from 25th percentile Q1 to 75th per-
included for comparison purposes. The results indicate the centile Q3, the minimum (Q1 – 1.5 × IQR), maximum
importance of predictor EX to the response WS variable. (Q3 + 1.5 × IQR) and the outliers.
Interestingly, the performance of assignments in ENM2600 In the above, we also show the root mean square
appears to have the most influence on the EX, except for error (RMSE) indicating that when there is a very high asso-
ENM1600 ONL (see Appendix A) where quiz scores are ciation (or high correlation coefficient) between response and
more important to predict EX. The cause of this discrep- predictors (i.e., WS and EX in this case), the LR model yields
ancy is not clear yet, but plausible reasons could include a better prediction than the vine copula-based model. How-
the difference between the two courses (i.e., advanced versus ever, in case that associations between response and predic-
intermediate) in terms of level of complexity of problems in tors (i.e., EX and continuous assessments) has larger scatter
quiz/assignments, or others that warrant a further comparative or have a low correlation coefficient, the vine copula-based
investigation. models provide a very competitive advantage, performing
45124 VOLUME 10, 2022You can also read