Status of PM emission measurement methods and new developments
←
→
Page content transcription
If your browser does not render page correctly, please read the page content below

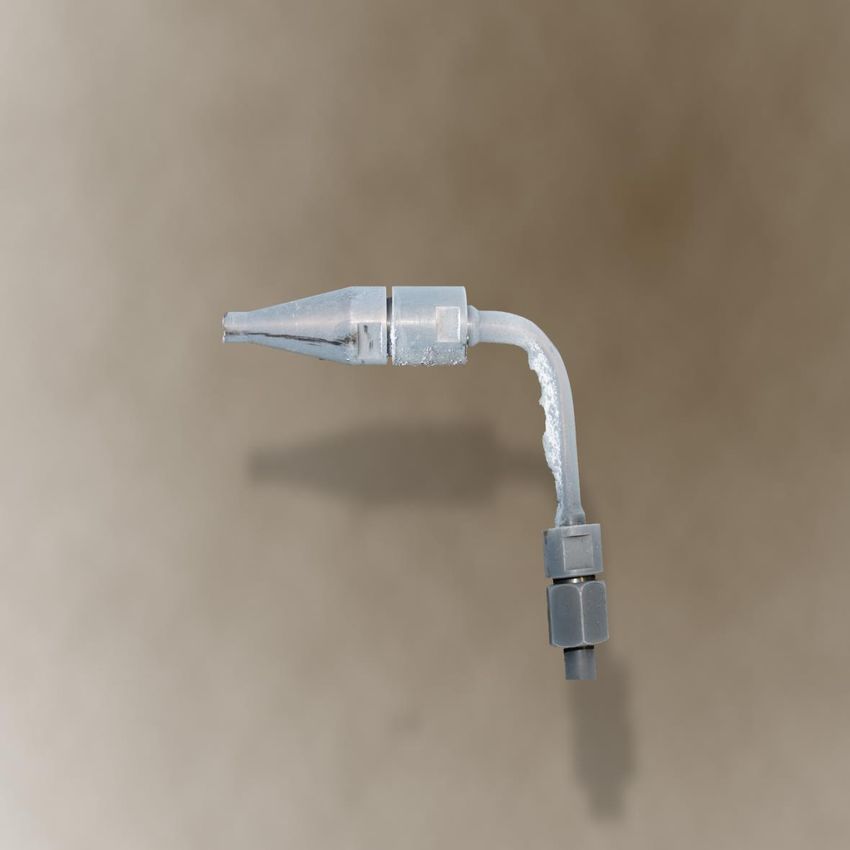
Status of PM emission
 measurement methods
 and new developments
 Technical report

 Claudia Schön and Hans Hartmann

A sampling nozzle removed from a flue gas
duct after collection of particulate matter
Photo: TFZ

IEA Bioenergy: Task 32: July 2018

IEA Bioenergy, also known as the Technology Collaboration Programme (TCP) for a Programme of Research, Development and Demonstration
on Bioenergy, functions within a Framework created by the International Energy Agency (IEA). Views, findings and publications of IEA Bioenergy
do not necessarily represent the views or policies of the IEA Secretariat or of its individual Member countries.

Status of PM measurement methods and new developments
Technical report

Claudia Schön, Hans Hartmann

Technology and Support Centre in the Centre of Excellence for Renewable Resources (TFZ)

with contributions from several IEA Task 32-members and other experts

Straubing, July 2018

Copyright © 2018 IEA Bioenergy. All rights Reserved

Published by IEA Bioenergy

 IEA Bioenergy, also known as the Technology Collaboration Programme (TCP) for a Programme of Research, Development and Demonstration
 on Bioenergy, functions within a Framework created by the International Energy Agency (IEA). Views, findings and publications of IEA Bioenergy
 do not necessarily represent the views or policies of the IEA Secretariat or of its individual Member countries.

Preface
Accurate determination of particulate matter emission (PME) from solid fuels is an ambitious task
which is quite insufficiently assisted by technical standards, as they are sometimes inadequate or
not sufficiently comprehensive. In this vast field of many methods and high diversity of
measurement devices there is still too much room for interpretation and adaptation of procedures.
Thus, researchers and testing bodies often have to create their own rules for good laboratory
practice, sometimes assisted by internal validation routines. But results from such internal quality
assurance efforts are usually never disclosed, if at all documented. Furthermore, the target audience
for emission measurements is usually more fascinated by the actual results than by the way these
results are generated, and this audience is simply not aware of the manifold uncertainties which can
sometimes make spectacular scientific findings doubtful. This is why actions on method
development, their onward elaboration or international harmonization need to struggle for attention
or institutional support.

By nature, there is thus an immanent lack of information on quantitative effects on measured PM
emission. This deficit was tackled when a group of European research institutions decided to form a
temporary and quite loose network, the "EN-PME project". This project made use of existing
nationally funded programs to focus on joint activities towards a common goal, the elaboration of a
harmonized European PM determination method. This EN-PME Network with 15 partners from 10
European countries was coordinated by INERIS/France and by CATSE/Switzerland. Among other
actions, it enabled an exchange of existing or still to be created technical knowledge on method
performance which forms a basis of this IEA report.

But further knowledge and experience was collected via a specific questionnaire which had been
sent out to the members of IEA Task 32 (Combustion) and their national partners. This
questionnaire aimed at providing published or unpublished documentation about experience on
influencing factors on measurement accuracy. As a result, the response from 7 institutions from 6
countries is regarded and compiled in this report.

However, it can be assumed, that much relevant information is yet undiscovered, and thus the
impacts and effects displayed in this report remain fragmentary. In view of growing market
integration and internationally harmonized environmental goals, a continued discussion and
common international approach towards harmonizing measurement methods is more than ever
required in the future.

 1
Abbreviations for names of institutions mentioned in this report

BIOS – BIOS Bioenergiesysteme GmbH, Graz, Austria
CATSE – Centre of Appropriate Technology and Social Ecology, Switzerland
CTSB – Scientific and Technical Centre for Building, France
DBFZ - Deutsches Biomasseforschungszentrum, Leipzig, Germany
DTI – Danish technology Institute, Denmark
FHNW - Fachhochschule Nordwestschweiz, Windisch, Switzerland
INERIS – French National Institute for Industrial Environment and Risks, France
LERMAB – University of Nancy, Laboratory for Studies and Research on Wood
Material, France
SP – Technical Research Institute of Sweden (now renamed to "Rise"), Gothenborg,
Sweden
TFZ – Technology and Support Centre, Germany
UEF – University of Eastern Finland, Finland
VSB-TUO – VSB Technical University of Ostrava, Energy Research Center, Czech
Republic

 2

Content

 1 Introduction ....................................................................................................................... 5

 Problem definition ............................................................................................................. 5

 Aim of this report .............................................................................................................. 5

 Particle formation pathways ............................................................................................. 6

 2 Overview of existing PM determination standards and methods ..................................... 9

 PM Sampling in the hot flue gas ....................................................................................... 9

 PM sampling in the diluted flue gas ................................................................................ 11

 3 Impact on measured PM emission ................................................................................. 15

 Data collection and procedure ........................................................................................ 15

 Influences assessed ....................................................................................................... 17

 3.2.1 Filter material .................................................................................................................. 17

 3.2.2 Isokinetic and anisokinetic sampling .............................................................................. 17

 3.2.3 Nozzle orientation ........................................................................................................... 21

 3.2.4 Nozzle size ..................................................................................................................... 24

 3.2.5 Filtration temperature during particle sampling and filter treatment temperature after
 sampling ......................................................................................................................... 24

 3.2.6 Different dilution strategies ............................................................................................. 28

 3.2.7 Contribution of rinsing to particle emission ..................................................................... 31

 3.2.8 Sampling flow rate and deposition in the sampling line ................................................. 31

 Conclusions regarding influencing factors ...................................................................... 32

 4 Harmonized European method approach – EN-PME method ...................................... 34

 Introduction and requirements ........................................................................................ 34

 Equipment and boundary conditions .............................................................................. 34

 Experience and validation campaigns ............................................................................ 36

 5 Summary and conclusions ............................................................................................. 42

 6 Literature......................................................................................................................... 45

 3

4

1 Introduction

 Problem definition
Particulate matter emissions (PME) from biomass combustion have always been in the focus of air
pollution control. And attention is still rising while regional or international emission limits tighten
and requirements defined in international product standards become stricter. Furthermore, particles
discharged from solid fuel burning appliances and boilers usually contain soot and organic
components which are known for their potential to be specifically harmful for health and
environment. Due to their small size (mostly below 1 µm aerodynamic diameter) they can easily
pass through the nose and throat into the lungs. Additionally, many such PM-enriched flue gases
also carry organic gaseous carbon species (OGC) which act as precursors for secondary organic
aerosols (SOA). Via photo-oxidation under the influence of UV-radiation these organic species can
also contribute to the total PM concentration in an atmosphere.

However, to evaluate the magnitude at which a biomass based PME source contributes to
atmospheric pollution is not an easy task. Many different methods have historically been used to
measure PME from the flue gas of residential appliances and boilers for biomass (mostly wood).
Confusion has arisen in the market as different and conflicting results are quoted in literature and
test reports. Even within Europe, where common market rules should apply, several national
measurement standards are living side by side, and compatibility of reported PME levels is not given.
In a worldwide consideration such differences are even higher, and manufacturers cannot access
new markets without providing additional test results based on the respective measurement
standard applied in the region.

But even where there is an agreement about using a specific test standard, there is usually still
quite some room for its interpretation. Knowledge about the impact of given variation concerning
suitable measurement equipment, the materials used, or the operational settings during a test is
quite low, or at least little attempt has yet been made to compile such knowledge as a basis for
further specification of measurement rules. And beyond these difficulties there is one more
challenge: Other than for measurements of gaseous emissions, PME measurements suffer from the
fact that there is no system for calibration which could validate the full PM-sampling and
measurement process under realistic conditions. Therefore, uncertainty about research data for PME
is always relatively high.

 Aim of this report
It is the aim of this report to stimulate an international approach towards one (or few) method(s)
for determining particle emissions from biomass based combustion. Thereby, the focus is set only
on the actual PM-measurement technique while disregarding the way how an appliance is operated
during a test. This goal is approached by three key activities:

• to provide an overview on the diversity of existing measurement strategies in order to
 emphasize the need for a harmonized approach;

• to provide knowledge on the influence of method variations (e.g. equipment, test rig design,
 operational parameters, materials used, deposits, etc.) on measured PME results. Where
 possible, quantitative results from published and unpublished documents are cited and

• to present and to describe the recently developed EN-PME method which was suggested as
 common European measurement strategy. This is to raise discussion about its suitability for an
 international approach within and beyond European boundaries.

 5

Particle formation pathways

From the moment when gaseous, liquid and solid compounds are created during combustion until
their appearance as particulate matter in atmosphere, particles and their precursors pass though
several stages of transformation which need to be understood in order to evaluate possible impacts
on the chosen measurement method. Therefore, this chapter shall provide the basic knowledge.

An overview of PM formation pathways in flue gas and ambient air is summarized in Figure 1.
 EN-PME-TEST

 minerals and salts (inorganic matter, IM) soot (EC or BC) organic matter (OM) H2O / CO2
 combustion process

 combustion process

 CO / SO2 /
 NOx/HCl
 salt, carbonates (CC), sulfates, oxides C/H ratio > 8 volatility
 low high

 SVOC VOC VVOC

 POA
 (OC)
 (tar)
 partitioning depending
 TC on flue gas temperature
 w/o CC
 flue gas

 flue gas

 aerosol processes:
 agglomeration / nucleation / homogeneous
 / heterogeneous condensation
 flue gas

 OGC
 tailpipe measurement
 flue gas sample COC SOA others
 PA (tailpipe) precursors (CH4 etc.)

 environment
 (chemical and physical processes)

 ambient PM (ambient)
 PM-measurement

Figure 1: PM formation pathways in flue gas and ambient air and classification of products. Graph
 October 26, 2015 | page 1

developed by Christian Gaegauf (CATSE) with input by DBFZ, TFZ and other partners within EN-PME
Test. The abbreviations used are defined in Table 1

 6

Table 1: Definition of the acronyms in Figure 1.

Acronym Term Remark

BC black carbon soot fraction of particulate matter emissions (identical EC)

CC carbonates carbonates formed from ash components and carbon in
 fuel
EC elemental carbon soot fraction of particulate matter emissions (identical BC)

IM inorganic matter minerals and salts (carbonates, sulfates, oxides, etc.) as
 inorganic fraction of particulate matter emissions
NMOGC non-methane organic gaseous potential SOA precursors
 carbon
OC organic carbon organic carbon fraction of particulate matter emissions
 resulting from incomplete combustion
OGC organic gaseous carbon

OM organic matter tar, SVOC, VOC, VVOC, OGC

PA primary aerosols salt, minerals, soot, tar, SVOC, VOC, VVOC released with
 the flue gas as solid or condensed particulate matter to
 the atmosphere (identical PME)
PM particulate matter in ambient
 air
PME particulate matter emissions PME = PA, solid and condensed particulate matter
 in the flue gas (identical PA)
POA primary organic aerosols organic fraction of PME

SOA secondary organic aerosols OGC transformed in the atmosphere to particulate matter
 as a result of UV exposure
soot elemental carbon soot (C/H > 8), carbon particles fraction of particulate
 matter emissions resulting from incomplete combustion
 (identical EC or BC)
SVOC semi volatile organic boiling range: > 250 °C
 compounds
tar tar condensed low volatile organic compounds

TC total carbon carbonaceous particle fraction of particulate matter
 emissions
 TC = EC + OC (without carbonates, CC)
VOC volatile organic compounds boiling range: 100 – 250 °C

VVOC very volatile organic boiling range: < 100 °C
 compounds

One important parameter regarding the determination of particle emission is the temperature
dependency of the condensation processes of organic aerosol forming elements in the flue gas duct.
Figure 2 illustrates schematically the temperature dependent behaviour of particle forming elements
after passing the flue gas socket of a boiler or stove. Particle forming elements originating from
inorganic aerosols and heavy metals (KCl, K2SO4, K2CO3, ZnO, etc.) as well as soot are not affected
by the flue gas cooling. But other organic gaseous compounds can be grouped into three categories
each describing a different behaviour during flue gas cooling.

• Methane and other none-condensable compounds. They will not contribute to particle formation.
• Condensable organic compounds. They do contribute to particle formation as lower flue gas
 temperatures forming the so-called primary organic aerosols (POA). This process occurs in the
 flue gas duct and in the chimney.

 7
• Secondary organic aerosol precursors. They are compounds that form particles after leaving the
 chimney into the atmosphere by formation of secondary organic aerosols (SOA) which will not
 be determined with the particle determination method considered in this report.

 boiler/stove outlet chimney top
 sampling point filter temperature
 temperature

 organic gaseous
 compounds

 organic aerosols
 PM soot
 inorganic aerosols
 PM at the PM measured PM emission
 sampling point

Figure 2: The influence of the flue gas temperature on the measurement of primary PM emissions
(Source: T. Brunner, BIOS, UltraLowDust-Project)

No number concentration measurements will be discussed in this paper.

 8
2 Overview of existing PM determination standards
 and methods
Worldwide there are different methods available for the determination of particulate matter (PM)
emission. These methods include

• determination (sampling) in the hot flue gas,

• determination (sampling) in the diluted (cooled) flue gas and

• determination via electrostatic precipitators which are integrated in the hot flue gas section in
 order to achieve complete PM collection from the full flue gas flow for gravimetric mass
 determination.

In this chapter an overview of existing European and International Standards regarding the
determination of PM is given while differentiating between determination in the hot flue gas and the
diluted flue gas. Only in the United Kingdom the PM emission is determined via electrostatic
precipitator following the British Standard PD6434 [1] this method shall not be further discussed
here.

 PM Sampling in the hot flue gas
During the combustion of solid biofuels in stoves or boilers flue gases are emitted at elevated
temperatures depending on the technology applied. In some countries, the particulate matter
emission is directly determined in the hot flue gas without any further treatment of the flue gas
itself. Special measurement sections are installed in order to make sure that a representative sample
is withdrawn from the flue gas.

United States. In the United States the method described in US EPA Method 5H [2] is applied for
wood heaters from a stack location. This method includes the following boundary conditions.

• The flue gas sampling is done against the flue gas flow with a nozzle orientation of 180° (i. e.
 with nozzle opening pointing upstream).

• Use of two glass fibre filters where the first filter has a temperature below 120 °C and is followed
 by a series of impingers and the second glass fibre filter is kept at temperatures below 20 °C in
 order to collect also the condensable fractions of PM.

No further specification on filter treatment procedure or issues regarding isokinetic sampling is
made.

Germany and Austria. For measurements at test stands the VDI directive 2066-1 [3] is mostly
referred to. It describes the gravimetric determination of dust loads applied in Germany. The
following boundary conditions are specified.

• Isokinetic flue gas sampling is done parallel to the flue gas flow with a nozzle orientation of
 180° (i. e. with nozzle opening pointing upstream). Only one plane filter is used. The inner
 diameter of the nozzle shall be 8 mm at minimum. At high dust load also a stuffed cartridge can
 be used.

• The filtration temperature during PM sampling shall be at 160 °C.

 9
• The pretreatment of the filter media is set to 180 °C while the filter media has to be thermally
 treated after sampling at 160 °C, always for 1 hour, and then be stored in a desiccator for at
 least 8 hours.

• The plane filter should be made of quartz fibre or in cases of low SO3 concentrations in the flue
 gas also glass fibre filters are suitable.

• The filter media retention has to be 99.5 % on a test aerosol with a mean particle diameter of
 0.3 µm (or 99.9 % on a test aerosol with 0.6 µm mean diameter).

• The deposition in the probe is collected via rinsing with water (twice) and acetone (once). The
 mass of dry deposits shall be added to the mass collected on the filter.

European method (draft). The final draft of the European Standard FprEN 16510-1 [4] is a
comprehensive document for testing residential solid fuel burning appliances. Apart from the method
mentioned above it also describes an alternative method for particle emission determination in the
hot flue gas. The main specifications are as follows.

• Flue gas sampling from constant flow is stated and it should be withdrawn using a nozzle having
 an orientation of 180° (i. e. with nozzle opening pointing upstream) while only one filter is used.
 The inner diameter of the nozzle shall be 10 mm.

• The filtration temperature during PM sampling shall be at temperatures of minimum 70 °C and
 maximum 160 °C.

• Before weighing the retrieved filter media shall be thermally treated (dried) at a temperature
 level which is 35 K higher than the filter holder temperature during sampling (but not more than
 180 °C). The duration of the thermal treatment is 1 hour. Then the filter is stored in a desiccator
 for at least 4 hours before weight determination.

• It is recommended to use quartz fibre filter (which does not contain any organic binders). If
 more than 100 mg/m³ on PM is expected a quartz wool pre-filter can be used additionally.

• The filter media retention has to be 99.95 % on a test aerosol with a mean particle diameter of
 0.3 µm.

• There are some suggestions on the probe specifications itself. The internal diameter should be
 at approx. 8 mm and should have a maximum length of 1000 mm.

• Deposits in the probe are removed by washing the filter holder with acetone once a day.
 However, the mass of these deposits is not determined and thus not considered as total PM
 collected.

• In addition to PM measurement, the determination of OGC in the hot flue gas is required which
 is important if qualitative comparisons with measurements in the diluted flue gas at “poor”
 combustion situations are performed.

Table 2 summarizes the main differences of the methods for PM determination in the hot flue gas.

 10
Table 2: Overview of PM determination in the hot flue gas

 Standard VDI 2066-1 US EPA Method 5H FprEN 16510-1
 (Germany & Austria) (USA) (suggested for
 Europe)

 Nozzle 180°, against gas flow 180°, against gas flow 180°, against gas
 orientation flow

 Nozzle size At least 8 mm Not stated 10 mm

 Isokinetic Yes Not stated Not stated
 sampling

 Filter material Quartz fibre or glass fibre Glass fibre Quartz fibre filters;
 stuffed quartz wool cartridge if more than
 at high dust load (above 100 mg/m³ use a
 50 mg/m³) quartz wool pre
 filter

 Filter retention 99.5 % für 0.3 µm und Not stated 99.95 % with a
 99.9 % für 0.6 µm mean particle
 diameter of 0.3 µm

 How many 1 plane filter 2 plane filters 1 plane filter
 plane filters? At high dust load: additional
 stuffed cartridge

 Diameter of instack (50 mm), outstack Not stated Not specified
 plane filter 50-150 mm

 Filtration At least 160 °C First filter at below 120°C, Maximum of 160°C
 temperature second filter below 20°C,
 impingers below 20°C

 Temperature at Pretreatment at 180°C for 180°C for 1 h and at
 filter treatment 1 h, after treatment at 160°C least for 4 h in
 for 1 h, always storage in desiccator
 desiccator for at least 8 h

 Rinsing Yes, done twice with water Not stated Yes, with acetone,
 considered? and once with acetone. Mass but mass of
 of deposits is regarded as PME deposits is not
 regarded

 PM sampling in the diluted flue gas
In some countries the particulate matter emission is not to be determined in a hot flue gas because
some of the organic components may not be condensed at elevated sampling temperatures and
could therefore pass the filter in gaseous state. In this case the OGC determination is an essential
part of the PME measurement. Flue gas dilution is therefore applied to achieve cooling and
condensation, this is typically done by diluting with filtered air. Mostly this will cause a temperature
drop to a level below 52 °C, thus transforming the flue gas into a state which comes closer to
conditions as prevailing at or behind the chimney outlet. Consequently, such cooling of the flue
gases will result in higher PM emissions measured, compared to the hot flue gas sampling, especially
at more incomplete combustion.

In principle, flue gas dilution can either be performed by full flow or by partial flow dilution. Partial

 11
flow dilution is a process where a small portion of flue gas is mixed with dilution air before the
mixture is being conducted over a filter media for measurement. In full flow dilution the complete
flue gas is diluted prior to the sampling of flue gas. Full flow dilution is usually required in standard
measurement procedures, while partial flow dilution is applied for research purposes or for field
measurements, where a full flow dilution cannot easily be realized.

A possible experimental setup using a dilution tunnel for full flow dilution is shown in Chapter 3
(Figure 3). Typical diameters of a dilution tunnel range between 150 to 300 mm.

Apart from the full flow dilution also different methods using partial flow dilution are available on
the market, mainly for research purposes. There are different partial flow diluters such as the ejector
diluter, perforated tube diluter, rotating disk diluter, concentric tube diluter, porous tube diluter and
combinations, and they are further described by MIETTINEN et al. [19]. Some parameters of interest
such as dilution ratio, residence time or dilution temperature were also studied and summarized by
MIETTINEN et al. [19] without any main conclusions. In most studies a moderate dilution ratio of
below 40 was applied leading to higher PM emission compared to the measurements performed in
the hot flue gas. The optimum dilution system strongly depends on the focus of measurement which
is typically a research issue on health and environmental aspects using partial flow dilution systems.
Due to the fact that no systematic evaluation of the different systems has been done, the only
method described in standards is the full flow dilution tunnel, which introduces disadvantages as
the large space requirement or the relatively high construction and maintenance costs; furthermore
they are not suitable for field testing. For the full flow dilution no influence on PM emission was
observed at various sampling conditions (dilution ratio, sampling temperature and dilution tunnel
residence time) [20].

Norway. Norway is one of the European countries that require the PM emission to be determined
in the diluted flue gas, following a Norwegian Standard Method NS 3058-2 [5]. The main
specifications are as follows.

• The partial flow sample is taken isokinetically from the dilution tunnel with a nozzle orientation
 of 180° (with nozzle opening pointing upstream).

• The temperature during PM sampling shall be below 35 °C.

• The filter media is made of glass fibre and shall be stored in a desiccator for at least 24 hours
 at ambient temperature, and it shall have a nominal pore diameter of 1.0 µm.

• In the sampling train, two plane filters are used in series for PM determination and their diameter
 is approximately 100 mm. Filters are positioned not more than 100 mm apart from each other.

• Deposits in the probe are considered as PME and are quantified. Therefore, the filter holders are
 washed and brushed with acetone for at least three times.

Australia/New Zealand. In both countries a dilution tunnel is used. It is described in the Standard
AS/NZS 4013 [6]. The main specifications are as follows.

• A partial flow is taken using a nozzle orientation of 90°; no specifications are made concerning
 the sampling speed.

• The temperature of the sampling train during PM determination shall be between 15 and 32 °C.

• The temperature in the dilution tunnel has to be above 25 °C.

 12
• The filter media shall be desiccated for 24 h at ambient laboratory temperature and pressure.

• The filter media is made of glass fibre and has a diameter of 50 mm. The collection efficiency is
 above 99.95 % on 0.3 µm particles.

• Two plane filters are used in sequence for PM determination. They have a diameter of approx.
 50 mm and are not more than 100 mm apart.

• The probe shall have a length of 450 mm and an internal diameter of 9.5 mm.

• Deposits are considered as PM and are quantified by washing the sampling line with acetone.
 The liquid is desiccated at ambient conditions of not more than 30 °C.

European method (draft). The final draft of the European Standard FprEN 16510-1 [4] describes
also a PM test method for sampling in diluted flue gas, this method is used for residential solid fuel
burning. The main specifications are as follows.

• The partial sampling flow is taken at constant flow from the dilution tunnel with a nozzle
 orientation of 180° (i. e. with nozzle opening pointing upstream). The nozzle has a diameter of
 10 mm.

• The temperature of the diluted flue gas during PM sampling shall be in the range of 25 to 50 °C.

• Filter media is used which is made of glass fibre having a collection efficiency of 99.95 % on
 0.3 µm particles.

• Before initial weighing, the filter media shall be dried for 24 h at a temperature which is 35 K
 higher than the filter holder temperature during sampling (but not more than 180 °C).

• After filter loading and before weighing, the filter media shall be stored in a desiccator for at
 least 8 hours at ambient temperature.

• In the sampling train, two plane filters are used in sequence for PM determination and are
 positions not more than 100 mm apart from each other.

• There are some suggestions on the probe specifications itself. The internal diameter should be
 at approximately 8 mm and should have a length between 300 mm and 600 mm.

• Deposits in the probe are removed by washing the filter holders with acetone once a day.
 However, the mass of these deposits is not determined and is thus not considered as total PM
 collected.

A short overview of PM determination performed in the diluted flue gas is given in Table 3.

 13
Table 3: Overview of PM determination in the diluted flue gas

 Standard CSA - B415.1- AS/NZS 4013 NS 3058-2 US EPA prEN 16510-1
 10 (Australia/ (Norway) Method 5G (suggested for
 (Candada) New Zealand) (USA) Europe,
 alternatively)

 Nozzle 90°, vertical 90°, vertical 180°, against 90°, vertical 180°, against
 orientation to flow to flow gas flow to flow gas flow

 Nozzle size Not stated Not stated Not stated Not stated 10 mm

 Isokinetic Yes No. Sampling proportionally, Yes Not stated
 speed set to 0.015 m³/min
 0.33m³/h at mean
 velocity of
 3.33 m/s in
 tunnel

 Filter material Glass fibre Glass fibre Glass fibre Glass fibre Glass fibre

 Filter retention 99.95 % on 99.95 % on nominal pore 99.95 % on 99.95 % on
 0.3 µm 0.3 µm diameter of 0.3 µm 0.3 µm
 1.0 µm

 Filters - how a front 2 filters in 2 filters in 2 filters in 2 filters in
 many? (primary) series not series not series which series which
 filter and rear more than more than are 25- are not more
 (backup) filter 100 mm apart 100 mm apart 100 mm apart than 100 mm
 with distance apart
 of 25-100 mm
 between them

 Diameter of 47 mm 50 mm approx. minimum of
 filter 100 mm 100 mm

 Filtration below 32 °C 15-32 °C below 35 °C below 32 °C filter housing
 temperature between both at ambient air
 filters temp, but
 above 20°C

 Temperature desiccated at for at least desiccator for desiccator for desiccator for
 filter 20±5.6 °C at 24 h at 24 h-36 h at 24 h, 24 h at 35 K
 treatment ambient ambient ambient alternatively: above
 pressure for laboratory temperature oven dried at sampling T,
 at least 24 h temperature 104 °C for 2- but not more
 and pressure 3 h and cooled than 180 °C
 (no desiccator in desiccator
 mentioned)

 Rinsing Yes, weighing Yes, probe Yes, three Yes, three Yes, with
 considered? the probe and filter times with times with acetone
 assemblies holders shall acetone and acetone and
 be weighed brushed brushed
 directly or
 cleaned using
 acetone

 14
3 Impact on measured PM emission
This chapter deals with different method-based influences on measured particle emission from wood
combustion in stoves and boilers. This includes the isokinetic sampling, filtration temperature during
PM sampling, the post treatment temperature of the filter media after PM collection, nozzle
orientation in the flue gas duct, nozzle size, dust deposition in the sampling probe as well as different
dilution strategies of the flue gas.

 Data collection and procedure

Much of the data and findings presented in this chapter are collected from work done within the
European EN-PME project which was conducted during March 2012 until December 2014. In addition
to this largely unpublished and internal data source, a questionnaire was created and sent out to
the IEA Task32-members and their national partners. This questionnaire aimed at providing
published or unpublished documentation about experience on influencing factors on measurement
accuracy. As a result of this action the response from 7 institutions from 6 countries is regarded and
compiled in this report.

It should be noted, that several measurement results shown in the graphs in this chapter sometimes
display very high emission levels, which were deliberately caused by improper fuel choices or
unfavourable boiler settings. In no way these levels shall be interpreted as typical for practice, nor
do they reflect today's state of technology in the regions where these furnaces are applied. This
unusual trial management was however necessary to test the effects of different measurement
strategies under worst case conditions.

Several of the results concerning the influencing factors in the following chapters were investigated
on the test stand at TFZ with a full flow dilution tunnel as shown in Figure 3. PM measurements
were conducted with sampling probes and equipment fulfilling the requirements of the German
Standard VDI 2066-1. In total up to 4 different sampling ports (TSP1 to TSP4) were used within this
investigation. TSP1 to TSP3 were used in the hot, undiluted flue gas while TSP 4 was only used in
the diluted flue gas. Not all ports were used for each combustion trial.

 15
Figure 3: Experimental setup with full flow dilution tunnel as used for the parameter study at TFZ

After PM sampling all filter media (typically quartz fibre plane filter and stuffed cartridge if necessary)
were usually thermally treated at 120 °C unless something else is stated. A large variety of sampling
probes exist in Europe and some examples are shown in Figure 4. Moreover, furnace type (different
firewood stoves and boilers) as well as fuel type (different log wood, wood chips) varied depending
on the task and its availability. All presented concentrations refer to 13 vol-% O2.

 SINTEF

Figure 4: Sampling probes from different institutes such as from CSTB in France, TFZ in Germany,
SINTEF in Norway and SP in Sweden. (Source: TFZ)

 16
Influences assessed

3.2.1 Filter material

Most of the current standards recommend the use of either glass fibre or quartz fibre plane filters.
Both filter types were compared in a combustion trial with a firewood stove while sampling in the
undiluted flue gas simultaneously. TSP1 was equipped with a quartz plane filter (Munktell MK 360)
and TSP2 was equipped with a glass fibre filter (Munktell MG 160), both having a diameter of 45 mm.
Stuffed cartridges were not applied. Values between 80 and 300 mg/Nm³ on PM emission were
detected. The results are shown in Figure 5, no significant influence of chosen filter media could be
observed leading to the conclusion that both filter media are equally suitable for particle sampling
in the given case.

The only reported drawback of glass fibre filter is their higher reactivity with acid flue gas
components. Another study performed at a firewood stove came to the conclusion that quartz fibre
filter detected about 50 % less particle emission compared to the glass fibre filter type [7]. But this
investigation was done at different flue gas conditions (not the same batch, no simultaneous
measurement) and could therefore be misleading.

 350

 mg/Nm³
 300
 (13 % O2) y = 1.0162x
 R² = 0.9991
 Particle emission (glass fibre filter)

 250

 200

 150

 100

 50

 0
 0 50 100 150 200 250 mg/Nm³
 300 350
 (13 % O2)
 Particle emission (quartz fibre filter)
Figure 5: Comparison of two different filter media. Furnace: Austroflamm Chester Xtra, Fuel: beech
logs with bark. Source: TFZ

3.2.2 Isokinetic and anisokinetic sampling

Isokinetic sampling is typically recommended for reliable determination of particle emission during
biomass combustion. This is of particular relevance for particles larger than 1 µm because they do
not behave like a gas and can thus not follow the gas flow easily. For higher sampling velocities
than present in the flue gas duct, some of the larger particles will not be sampled whereas at lower
sampling velocities a higher share of coarse particles will be collected. Table 4 shows the pathways
of smaller and larger particles according to [16].

 17
Table 4: Examples for isokinetic and anisokinetic conditions, according to [16]

 100 % Isokinetic sampling 200 % Isokinetic sampling 50 % Isokinetic sampling

 Small particles Small particles Small particles

 Nozzle
 Nozzle Nozzle

 Flow
 Flow Flow

 Large particles Large particles Large particles

Figure 6 shows the direct effect of sampling velocity on particle concentration as a function of the
square root of the Stokes number based on Hinds [21]. The Stokes number can be used since this
parameter is directly proportional to particle size (particle size increases with increasing Stokes
number). It is also known that if the Stokes number is much smaller than 1 then the particles follow
the gas streamslines perfectly [21]In Figure 6 C0 is the particle concentration in the flue gas whereas
C is the concentration of particles measured at different sampling speeds. Moreover, U0 is the
velocity in the flue gas duct and U is the sampling speed.

 5.0
 U0/U=4.0
 lower sampling speed

 2.0
 2.0
 Concentration C/C0

 1.5

 1.0
 1.0
 0.75

 0.50

 higher sampling speed
 0.25

 0.2
 0.1 1 5.0
 SQRT(Stokes number)

Figure 6: Concentration ratio versus the square root of the Stokes number for different velocity
ratio, according to [21]. C0 – particle concentration in flue gas, C – determined particle
concentration, U0 – velocity of flue gas in the duct, U – sampling velocity. The particle diameter was
added according to [13].

The particle concentration will be more affected with increasing particle size indicated by increasing
Stokes number, but this should be of minor importance during wood combustion since typically more
than 90 % of the particles are smaller than 10 µm as shown in several reports e. g. [17] [22]. Based
on this experience it can be concluded that the influence of the sampling speed should not be of

 18
great importance. Further proof was expected to be given in combustion tests, as reported in the
following.

The influence of sampling speed was also investigated at different laboratories and the results from
two laboratories are shown here. The first campaign using a wood chip boiler was performed at TFZ
using three parallel particle measurements with two sampling ports for isokinetic particle sampling
(TSP1 and TSP3 for accuracy determination, Figure 3) and one sampling port at TSP2 for isokinetic
± 50 %. A nozzle diameter of 10 mm was selected having a nozzle orientation of 180°. During the
combustion of wood chips representing "good" combustion conditions low gaseous emissions (CO
between 71 and 80 mg/Nm³, OGC between 1 and 5 mg/Nm³) were released. The diagrams in Figure
7 prove a high accuracy of the particle measurements (TSP1 and TSP3) at "good" combustion
conditions. The deposits in the sampling line are not considered in this study. At a reduced sampling
speed compared to the flue gas tunnel (i.e. isokinetic - 50 %) an average increase of 7 % in particle
emission was detected. For higher sampling velocities indicated by isokinetic - +50 % neither an
increase nor a decrease in particle emission was determined for TSP2. From these trials it can be
concluded that a high repeatability of particle emission is possible at good combustion conditions.
Moreover, it can be recommended that particle sampling should be done either isokinetically or at
higher sampling velocity due to the fact that the particles are typically smaller than 10 µm.

 100 100
 TSP 1 (isokinetic) TSP 2 (isokinetic - 50%) TSP 3 (isokinetic) TSP 1 (isokinetic) TSP 2 (isokinetic + 50%) TSP 3 (isokinetic)

 mg/Nm³ mg/Nm³
 80)
 (13 % O 802)
 (13 % O
 2
 Particle emission

 Particle emission

 56 59 58
 60 60
 54 51 52 52 52
 47 52 48 48 51 47 50 50 51 51 48 48 50 50 51 51

 40 40

 20 20

 0 0
 1 2 3 Average 1 2 3 Average
 Measurement Measurement

Figure 7: Influence of isokinetic at TSP1 and 3 and isokinetic - 50 % (TSP2, left) and isokinetic +
50 % (TSP2, right) on particle emission during good combustion conditions. Furnace: Guntamatic
Powerchip, Fuel: dry spruce wood chips (M = 18 %). Without rinsing. Source: TFZ

At "poor" combustion conditions with wet wood chips (M = 60 %) CO emissions of up to
12,500 mg/Nm³ and OGC emissions of up to 1,900 mg/Nm³ occurred. The parallel measurements
at TSP1 and TSP3 showed a lower repeatability of PM emission, Figure 8. At a lower sampling speed
(isokinetic – 50 %) an increase in particle emission of 13 % was observed, a similar trend as
observed for "good" combustion conditions. At higher sampling speed (isokinetic + 50 %) a slight
increase in PM emission was detected, but this was less pronounced than for lower sampling speeds.
The deposits in the sampling line are not considered here.

 19
700 700
 TSP 1 (isokinetic) TSP 2 (isokinetic - 50%) TSP 3 (isokinetic) TSP 1 (isokinetic) TSP 2 (isokinetic + 50%) TSP 3 (isokinetic)
 mg/Nm³
 600 mg/Nm³
 600
 (13 % O2) 559 o
 (13 % O2)
 Filter treatment at 120 C Filter treatment at 120oC
 477
 500 500
 465
 Particle emission

 Particle emission
 422 421
 380 370 374
 400 400
 325
 309 283 276 300 279
 300 300
 243 246 252
 232 225 236
 205 215
 183 197
 200 200

 100 100

 0 0
 1 2 3 Average 1 2 3 Average
 Measurement Measurement

Figure 8: Influence of isokinetic at TSP1 and 3 and isokinetic - 50 % (TSP2, left) and
isokinetic + 50 % (TSP2, right) on particle emission during "poor" combustion conditions. Furnace:
Guntamatic Powerchip, Fuel: wet spruce wood chips (M = 60 %). Without rinsing. Source: TFZ

From the variation of sampling speed using the same nozzle size it can be concluded that lower
sampling speed should be avoided. The same trends were reported in [12].

In contrast to these presented results considerable influence on the isokinetic sampling was reported
in [13], see Figure 9. There was an almost 80 % reduction on PM emission if the sampling speed
was increased by the factor of 5 compared to the flue gas velocity. This may be due to the fact that
a considerable amount of coarse particles larger than 10 µm were released during combustion in
the investigated firewood stove. No further information on boundary and combustion conditions was
given in the report. It is also not known if the measurements were performed simultaneously.

 90

 80
 mg/Nm³
 Isokinetic sampling speed
 70
 Particle emission

 60

 50

 40

 30

 20

 10

 0
 0 1 2 3 4
 m/s 5
 Sampling velocity

Figure 9: Influence of sampling speed on particle emission using a firewood stove. The lowest
sampling velocity represents isokinetic sampling [13]

 20
3.2.3 Nozzle orientation

In cases of isokinetic sampling also the nozzle orientation itself has an influence on the measured
particle concentration. A misaligned probe will underestimate the particle concentration as discussed
in [21] and presented in Figure 10. Within this figure C0 is the particle concentration in the flue gas
and C is the particle concentration determined at different nozzle orientations. Once again the
concentration reduction is presented depending on the Stokes number which is proportional to
particle size while depending on flue gas composition, velocities and flue gas temperature. An angle
of 90° represents a rectangular position of the nozzle in the flue gas duct. A small misalign of only
15° will only result in a slight reduction of the concentration of particles.

 1.0
 15°

 30°
 0.8
Concentration C/C0

 45°
 0.6

 60°

 0.4

 0.2 90°

 0.0
 0.1 1 5.0
 SQRT(Stokes number)

Figure 10: Concentration ratio based on nozzle orientation according to [21], C0 – particle
concentration in flue gas, C – determined particle concentration. The particle diameter was added
according to [13].

Data on the influence of nozzle orientation was provided by two different laboratories. At TFZ three
different nozzle orientations were compared at “good” combustion conditions using a 10 mm nozzle
and isokinetic sampling of flue gas from a wood chip boiler. The nozzle on TSP1 was facing upstream
(180° orientation) as it is required in VDI 2066 [3]. At TSP2 the nozzle was in a 90° orientation
towards the flue gas flow. And the nozzle of TSP3 was facing downstream (0° orientation). Only
plane filters were used and thermally treated at 120°C after dust collection. All TSPs were
simultaneously determined and rinsing was considered.

The highest particle concentration was determined with the nozzle facing upstream (180°
orientation) with 91 mg/Nm³ on average. For the other two nozzle orientations lower particle
emission were determined, average values of 81 mg/Nm³ were achieved for the 90° and 0° nozzle
orientation, Figure 11. This 10 % PM reduction indicated that both nozzle orientations could lead to
the same level of measured particle emission, as the impact on the particles' cut-off sizes (i. e. not
collected particle diameters) may be similar.

 21
350 150
 326
 CO OGC Nozzle orientation: 180° 90° 0°
 mg/Nm³
 300
 (13 % O2) mg/Nm³
 120
 (13 % O2) 111
 250 100
 99 95
 Gaseous emission

 Particle emission
 210 207 91
 182 90 85
 200 80 79 77 77 80 81 81 81
 74 76 75 75
 161 157
 150
 60

 100
 30
 50
 12 15 8 9
 6 5
 0 0
 1 2 3 4 5 Average 1 2 3 4 5 Average
 Measurement Measurement

Figure 11: Gaseous emission (left) and particle emission (right) at "good" combustion conditions
depending on nozzle orientation. Furnace: Guntamatic Powerchip, Fuel: dry spruce wood chips
(M = 18 %). Source: TFZ

Further investigations regarding nozzle orientation were performed at the combustion laboratory at
FHNW and the data were provided for this report. Parallel measurements were conducted using the
Gothe probe (by Paul Gothe GmbH) as well as a probe by Wöhler Technik GmbH (the SM 96 probe).
The following nozzle orientations were investigated as shown in Table 5. The Gothe probe is
indentified by the thicker sampling nozzle.

Table 5: Nozzle orientation for combustion tests, pictures provided by FHNW [15].

 Wöhler 180°, Gothe 180° Gothe 90°, Wöhler 180° Wöhler 0°,
 Gothe 180°

Three different measurement campaigns were conducted during wood combustion using a firewood
stove. The first three measurements were performed in order to prove the suitability of the Gothe
probe and Wöhler SM 96 probe for PM measurement using the same nozzle orientation of 180°
(pointing against the flue gas flow). The same sampling velocity of 4 m/s was selected while the
nozzle size of Gothe was 16 mm and the standard nozzle size of Wöhler is 10.3 mm. For the second
set of measurements (measurement number 4 to 7 in Figure 12) the nozzle orientation of the Gothe
probe was 90° with a nozzle size of 12 mm. For the last four measurements the Gothe probe was
pointing against the flue gas flow (180° orientation) while the nozzle orientation of the Wöhler probe
was at 0°. The results are summarized in Figure 12 indicating that the Gothe and Wöhler probe lead
to comparable results if the nozzle orientation was at 180°. Only about 70 % of PM emission was
detected if the nozzle orientation was set to 90° for the second case study. An even further loss of
particle emission was observed when the nozzle of the Wöhler probe was at 0° orientation causing
a "loss" of 45 %.

These deviations are clearly more severe than in the TFZ study presented above. The differences
may be attributed to the different combustion technologies which had presumably generated
different particle size ranges. However, a week point in the second study may also be seen in the

 22
fact that other influencing factors could not be kept consistent for both devices (i. e. sampling speed, filter media, sampling temperature, pre- and post-filter treatment temperatures) since no information regarding these issues were reported. Wöhler 180 , Gothe 180 Gothe 90 , Wöhler 180 Wöhler 0 , Gothe 180 200 2.0 Gothe 180 mg/Nm³ 1.8 Ratio (Orientation/Reference at 180°) Wöhler SM 96 160 1.6 Particle emission ratio (Orientation/ 140 Reference at 180°) 1.4 120 1.2 Ratio = 0.97 Ratio = 0.72 Ratio = 0.61 100 1.0 80 0.8 60 0.6 40 0.4 20 0.2 0 0.0 0 1 2 3 4 5 6 7 8 9 10 11 12 Measurement Figure 12: Influence of nozzle orientation investigated by FHNW at a firewood stove. Data provided by FHNW TSUJI et al [11] investigated the impact of variable operational conditions on the particles' cut-off sizes (i. e. not collected particle diameters) when downstream nozzle orientation (0°) is performed during sampling of particles from pulverized coal combustion and developed a mathematical model. The equation includes the velocity in the flue gas duct (U), velocity at the nozzle (U0), particle density (P), nozzle diameter (DS), cut-off-size (x), the dynamic gas viscosity (µ), particle concentration in the main flow (C0) and the measured particle concentration (C): 0 ∗ 0 ∗ 2 = exp(−5.09 ∗ ∗ ) 0 9 ∗ ∗ The authors assume a cut-off efficiency of 50 % (aspiration efficiency) leading to C/C0 = 0.5. The cut-off-size for the particles can now be calculated as follows: ln(0.5) ∗ ∗ 9 ∗ ∗ =√ −5,09 ∗ 02 ∗ Furthermore, the particle density is estimated to be 1000 kg/cm³ and the dynamic viscosity for ambient air (simplified flue gas composition) at around 150 °C is µ = 292.65 * 10-7 Pa s. This simplifies the equation above to ln(0.5) ∗ ∗ 9 ∗ 292.65 ∗ 10−7 Pa s ∗ =√ −5,09 ∗ 02 ∗ 1000kg/m³ Now the cut-off-size x can be estimated assuming a nozzle diameter of 12 mm, an average flue gas velocity in the duct of 4 m/s and a sampling velocity at the nozzle inlet of 2 m/s: ln(0.5) ∗ 2m/s ∗ 9 ∗ 292.65 ∗ 10−7 Pas ∗ 0,012m =√ −5,09 ∗ (4m/s)2 ∗ 1000kg/m³ All these assumptions in this example predict a cut-off size for particles larger 2.44 m. 23
3.2.4 Nozzle size

The influence of nozzle size on particle emission was investigated by DBFZ using a dust tunnel at
VSB-TUO in Ostrava, Czech Republic. The nozzle size varied between 4 and 18 mm in diameter. As
it can be seen in Figure 13 there is a strong negative influence on the particle concentration with
decreasing nozzle size [14]. Therefore, it is recommended to use nozzle diameters that should not
be much smaller than 10 mm in diameter in general. It is not clear whether the sampling was done
isokinetically, and there is no information regarding the particle size distribution. More research on
this issue seems highly recommendable.

 100

 90
 %

 80
 Relation Sample/ Reference

 70

 60

 50

 40

 30
 DBFZ VSB-TUO
 20

 10

 0
 0 5 10 15 mm 20
 Diameter of nozzle
Figure 13: Influence of nozzle size on the deviation of measured particle concentration. Trials
performed at the dust tunnel at VSB-TUO in Ostrava using dust collected from an electrostatic
precipitator leading to larger particles as released during wood combustion (data provided by DBFZ,
measurements performed at VSB-TUO)

3.2.5 Filtration temperature during particle sampling and filter treatment
 temperature after sampling

Further impact on measured particle emission was expected by the filtration temperature as
prevailing over the sampling period. Comparative tests on this impact were performed applying
isokinetic sampling using nozzles with 10 mm in diameter pointing upstream to the flue gas flow
(180° orientation). The filtration temperature of the first TSP1 was set to 180 °C, while for TSP2 a
temperature of 120 °C and at TSP3 a temperature of 70 °C was set. The highest filtration
temperature of 180 °C was selected as the reference case as it is required in VDI 2066. The lowest
filtration temperature of 70 °C was chosen since this temperature is used by some chimney sweeper
devices for field inspection such as the Wöhler SM 500.

During "good" combustion conditions using a wood chip boiler only 64 to 96 mg/Nm³ of CO were
released. The right diagram in Figure 14 shows the obtained results on particle emission for the
three selected filtration temperatures as well as the influence on filter treatment (120 °C +
desiccator and 180 °C + desiccator and direct drying only in desiccator alone) after sampling. Almost

 24
no differences between all particle measurements were detected, the values range from 49 to
51 mg/Nm³ (average of 5 measurements) compared to a sample conditioning in a desiccator alone.
This observation is within expectations, as no OGC emission was detected which could have
influenced the results by evaporation or condensation. Moreover, an elevated temperature for post
treatment did not affect these results from "good" combustion conditions.
 200 100
 Filttration temperature set to: 180°C 120°C 70°C Flue gas Filter treatment: Desiccator 120°C 180°C
 o
 180C
 mg/Nm³
 80
 Filtration temperature (measured)

 160 (13 % O2) Without rinsing
 140 53 53

 Particle emission
 60 53 53
 51 51 49 50 50
 120

 100 40

 80
 20
 60

 40
 0
 20 n=5 n=5 n=5
 set 180°C set 120°C set 70°C
 0 real 152°C real 111°C real 77°C
 1 2 3 4 5 TSP 1 TSP 2 TSP 3
 Measurement Filtration temperature

Figure 14: Influence of selected filtration temperature (left) and the thermal treatment after
sampling on PM emission (right) at good combustion conditions. Furnace: Guntamatic Powerchip,
Fuel: dry spruce wood chips (M = 17 %) (Flue gas temperature is given as red marks). Source: TFZ

During "poor" combustion conditions using wet wood chips from spruce having a moisture content
of 59 % clearly higher CO and OGC emissions were detected (left diagram in Figure 15). During
these five parallel measurements the flue gas temperature dropped down to only 70 °C.
Consequently also the measured filtration temperature was drastically reduced despite of the
existing probe heating, particularly for TSP1, where filtration was then performed at only 125 °C
instead of 180 °C as desired. Obviously it was not possible to maintain the set filtration temperature
with the equipment used in this comparison. Technical solutions for maintaining and monitoring the
set filtration temperature seem crucial for further development of particle measurement devices, a
suitable technical approach is presented in Chapter 4.

 18,000 200
 16,598 Filttration temperature set to: 180°C 120°C 70°C Flue gas
 mg/Nm³ 16,250
 16,000 14,988 o
 180C
 (13 % O2)
 CO OGC
 160
 Filtration temperature (measured)

 14,000
 11,712 11,279 140
 Gaseous emission

 12,000
 120
 10,000
 100
 8,000
 80
 6,000
 60
 3,412
 4,000 40
 2,789 2,752
 2,151 1,902
 2,000 20

 0 0
 1 2 3 4 5 1 2 3 4 5
 Measurement Measurement

Figure 15: Gaseous emission (left) and filtration temperature (right) at poor combustion conditions
applying different filtration temperatures. Furnace: Guntamatic Powerchip, Fuel: wet spruce chips
(M = 59 %) (Flue gas temperature is given as red marks), Source: TFZ

The results on particle emission measurement using different filtration temperatures at "poor"
combustion conditions are summarized in Figure 16. The first diagram (top left) shows the results
on particle emission with a set filtration temperature of 180 °C for all five measurements performed
at TSP1. Initially each loaded filter was treated only in a desiccator (first column), then at 120 °C
followed by a treatment at 180 °C. Between the different temperature levels all plane filters were
stored in a desiccator for at least 12 hours and weighted. Only a small influence on thermal
treatment was noticed for TSP1 with a mass loss of about 12 %. In contrast to that a clear increase

 25
You can also read