Solar on Superstores How Commercial Rooftops Can Boost Clean Energy Production in North Carolina - Frontier Group
←
→
Page content transcription
If your browser does not render page correctly, please read the page content below
Solar on Superstores How Commercial Rooftops Can Boost Clean Energy Production in North Carolina

Solar on Superstores
            How Commercial Rooftops
        Can Boost Clean Energy Production
                in North Carolina

                            Written by:

          Jordan Schneider and Judee Burr, Frontier Group

Elizabeth Ouzts, Environment North Carolina Research & Policy Center

                           February 2014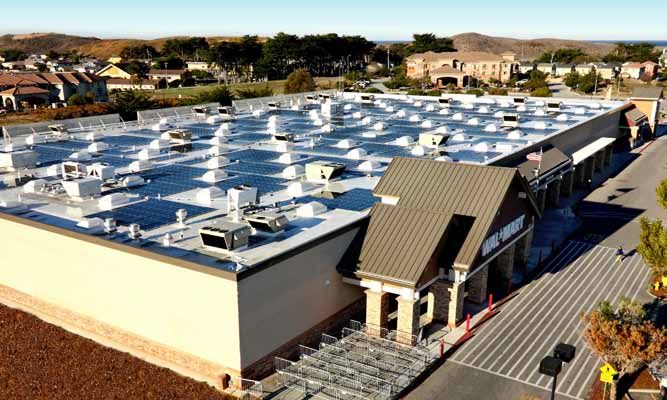
Acknowledgments
The authors wish to thank Kacey Hoover, policy analyst at the North Carolina Sustainable Energy
Association and others for their review and insightful comments on drafts of this report. Thanks to Tony
Dutzik and Benjamin Davis of Frontier Group for their editorial assistance.

The generous financial support of Fred and Alice Stanback made this report possible.

The views expressed in this report are those of the authors and do not necessarily reflect the views
of our funders or those who provided review. The recommendations are those of Environment North
Carolina Research & Policy Center. The authors bear responsibility for any factual errors.

© 2014 Environment North Carolina Research & Policy Center

                         Environment North Carolina Research & Policy Center is a 501(c)(3)
                         organization. We are dedicated to protecting North Carolina’s air, water and
                         open spaces. We investigate problems, craft solutions, educate the public and
                         decision-makers, and help North Carolinians make their voices heard in local,
state and national debates over the quality of our environment and our lives. For more information
about Environment North Carolina Research & Policy Center or for additional copies of this report,
please visit www.environmentnorthcarolinacenter.org.

Frontier Group conducts independent research and policy analysis to support a cleaner, healthier and
more democratic society. Our mission is to inject accurate information and compelling ideas into public
policy debates at the local, state and federal levels. For more information about Frontier Group, please
visit www.frontiergroup.org.

Cover photo: Rooftop solar panels on IKEA in Charlotte, NC. (Credit: IKEA Charlotte.)

Layout: To the Point Publications, www.tothepointpublications.com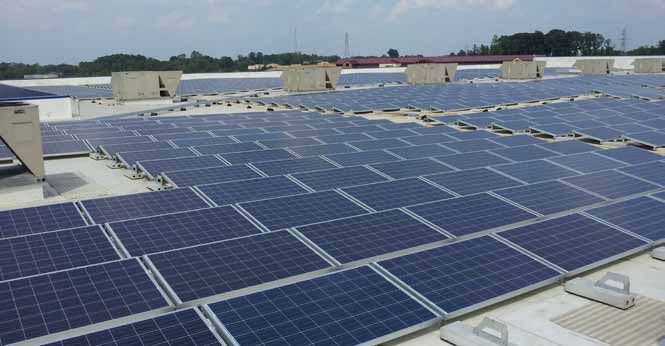
Table of Contents
Executive Summary . . . . . . . . . . . . . . . . . . . . . . . . . . . . . . . . . . . . . . . . . . . . . . 4

Introduction . . . . . . . . . . . . . . . . . . . . . . . . . . . . . . . . . . . . . . . . . . . . . . . . . . . . . 6

North Carolina Has Great Potential for Rooftop Solar Energy  . . . . . . . . . . 8
     North Carolina Has Good Solar Resources . . . . . . . . . . . . . . . . . . . . . . . . . . . . . . . . . . . . . . . . . . . . . . . . 8

     North Carolina Has Millions of Rooftops Suitable for Solar Development  . . . . . . . . . . . . . . . . . . 8

Commercial Rooftop Solar Power Has Untapped Benefits
for North Carolina . . . . . . . . . . . . . . . . . . . . . . . . . . . . . . . . . . . . . . . . . . . . . . 10
     Commercial Rooftops Can Generate Large Quantities of Solar Power . . . . . . . . . . . . . . . . . . . . 10

     Installing Solar Energy Systems Is Cost-Effective . . . . . . . . . . . . . . . . . . . . . . . . . . . . . . . . . . . . . . . .  12

     Solar Power Contributes to a Cleaner and More Reliable Electricity Grid  . . . . . . . . . . . . . . . . .  12

Solar Energy Works for North Carolina’s Environment,
Public Health and Economy . . . . . . . . . . . . . . . . . . . . . . . . . . . . . . . . . . . . . . 14
     Solar Energy Protects Our Environment . . . . . . . . . . . . . . . . . . . . . . . . . . . . . . . . . . . . . . . . . . . . . . . .  14

     Solar Energy Protects Public Health . . . . . . . . . . . . . . . . . . . . . . . . . . . . . . . . . . . . . . . . . . . . . . . . . . . .  15

     Solar Energy Creates Jobs and Strengthens the Economy . . . . . . . . . . . . . . . . . . . . . . . . . . . . . . .  16

North Carolina Can Launch a Market for Commercial Solar Power . . . . 18
     North Carolina Can Improve Its Energy Policies to Boost Its Commercial Solar Market  . . . .  18

Policy Recommendations . . . . . . . . . . . . . . . . . . . . . . . . . . . . . . . . . . . . . . . . . . .20

Methodology  . . . . . . . . . . . . . . . . . . . . . . . . . . . . . . . . . . . . . . . . . . . . . . . . . . . . .  21

Notes  . . . . . . . . . . . . . . . . . . . . . . . . . . . . . . . . . . . . . . . . . . . . . . . . . . . . . . . . . . . . 23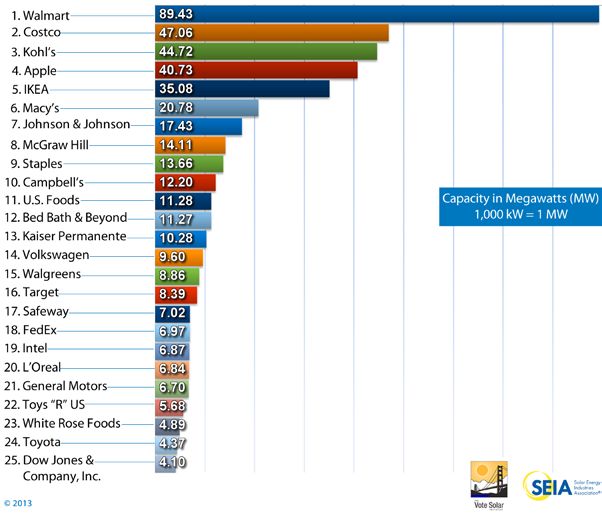
Executive
Summary

W
              ith more than 250 sunny days per year,       • North Carolina has many commercial buildings
              North Carolina has the potential to            that are appropriate for solar energy systems:
              replace much of its electricity from dirty     grocery stores, large supermarkets or supercent-
fossil fuels with clean solar power. North Carolina has      ers, small and large strip malls, enclosed shopping
been a national solar leader, ranking fifth in the coun-     malls and large freestanding “big box” retail stores,
try for cumulative installed solar energy capacity as of     such as IKEA or Best Buy. Big box stores, in particu-
September 2013. However, one of the biggest, largely         lar, are ideal because they are generally surround-
untapped potential markets for solar power is large          ed by several acres of parking space and therefore
commercial buildings, such as “big box” retail stores,       very little tree shading.
supercenters and shopping malls. Tapping into this
solar resource to boost North Carolina’s solar capacity    • North Carolina’s large commercial buildings have
can have substantial benefits for the state’s environ-       approximately 160 million square feet of available
ment, public health and economy.                             and appropriate rooftop space for solar energy
                                                             systems. That amount of rooftop space could
North Carolina has millions of empty rooftops that           support more than 3,000 MW of solar energy
can support solar panels, and much of the state’s            capacity—enough to generate as much electricity
barren land is ideal for large-scale solar energy power      as one medium to large coal-fired power plant.
plants. With the right policies in place, North Caro-
lina could install solar energy capacity equivalent to     Rooftop solar panels can help offset the large
700,000 solar roofs by 2030.1                              electricity demand of big box stores, while con-
                                                           tributing to a cleaner and more reliable electric-
The roofs of large commercial buildings are per-
                                                           ity grid.
fect locations for solar panels—they are flat, largely
vacant, and almost always fully exposed to the sun.        • Installation of 3,000 MW of rooftop solar power at
They also produce energy that can offset the large           big box stores would generate more than 4 million
electricity demand of these buildings while contribut-       megawatt-hours (MWh) of electricity annually—
ing to a cleaner electricity grid.                           offsetting the total annual electricity used by these
                                                             buildings by as much as 60 percent. Replacing this
North Carolina has the potential to install more
                                                             much dirty electricity with solar power would help
than 3,000 megawatts (MW) of rooftop solar pho-
                                                             prevent 3 million metric tons of global warming
tovoltaic (PV) capacity on large commercial build-
                                                             pollution annually—equivalent to that produced
ings—enough to offset the annual energy use of
                                                             by nearly 600,000 of today’s passenger vehicles.
these buildings by as much as 60 percent.

4   Solar on Superstores
• By providing additional power when it is most 3. Improve the state’s net metering laws. Net
needed—such as on hot summer days when air metering helps ensure that small commercial or
conditioner use increases—rooftop solar panels residential customers are fairly compensated for
can reduce the strain that large commercial the solar electricity that they produce. Investor-
buildings place on the electricity grid, increasing owned utilities should be required to reduce
reliability and reducing the need for expensive “standby fees” that deter consumers from
new power plants or transmission lines paid for by installing solar panels, and co-op and municipal
all consumers. utilities should be required to offer net meter-
ing to their customers.
• Rooftop solar energy installations also reduce
energy waste by producing electricity closer to 4. Extend incentives for investing in solar
the customers that will use it. This reduces energy technologies in North Carolina. Current
losses during transmission and distribution from renewable energy tax credits for businesses and
far-away power sources, making rooftop solar residents will expire by the end of 2015. In order
an important supplement to utility-scale solar to build a strong, self-sustaining market for
production. renewable energy in North Carolina, the state
should extend these tax credits and then phase
North Carolina’s policies have played a major role them out in a planned and orderly fashion over
in making the state a leader when it comes to a number of years.
solar. The following policies will help ensure we
5. Reduce siting, permitting, and interconnec-
continue that leadership, and do even more to
tion restrictions that can greatly increase the
develop the state’s rooftop solar market.
total cost of installing solar energy systems.
1. Enable third-party sales of electricity. The state
6. Defend and strengthen the state’s renew-
should allow companies that install rooftop solar
able energy standard to require utilities to get
panels to sell electricity to their customers.
20 percent of their electricity from renewable
2. Fairly compensate large solar energy produc- sources by 2020, and to increase requirements
ers in power purchasing agreements. The rate for solar energy production. The state should
that utilities pay for solar energy from large-scale also require all of the solar power that counts
producers is very low and does not account for towards North Carolina’s renewable energy
many of the unique benefits of solar power for standard to be produced within the state.
both the environment and the electricity grid.
The state should increase the required rate of
compensation to more accurately reflect the true
value of solar power.
Executive Summary 5Introduction
N
orth Carolina’s population has grown 17 Satellite images of the state’s large commer-
percent within the last decade, bringing cial buildings reveal hundreds of thousands of
significant changes to both the state’s square feet of flat, largely empty, sun-drenched
economy and physical landscape.2 Thousands of rooftop space. Installing large-scale solar
new businesses have sprung up or relocated to energy systems on the rooftops of these build-
North Carolina’s cities, resulting in an explosion of ings—or even ground-mounted systems in
commercial development. Demand for cheap real their huge parking lots for shaded parking—
estate drew many of these businesses to suburban could help meet a significant portion of the
and exurban areas, now transformed by hundreds energy demand of these stores while contribut-
of new strip malls, shopping centers and free- ing to a cleaner electricity grid.
standing “big box” retail stores.
North Carolina is already an emerging na-
Stores in these large commercial developments tional leader in solar energy. By tapping into
consume vast amounts of energy for heating, cool- its potential for rooftop solar power, the state
ing and lighting—contributing to increased pollu- can move even faster towards a clean energy
tion from the state’s electricity grid. However, these economy.
stores also represent an unprecedented opportu-
nity to generate clean, renewable solar power.
North Carolina is already an emerging national leader
in solar energy. By tapping into its potential for rooftop
solar power, the state can move even faster towards a
clean energy economy.
6 Solar on SuperstoresIn this report, we estimate North Carolina’s energy installations. By tapping our potential
total potential for rooftop solar capacity on its for solar energy—both on big box stores and
large commercial buildings and offer policy throughout the state—North Carolina can
recommendations to help North Carolina boost its solar energy industry and protect
encourage more large-scale commercial solar our environment.
Photo: Walmart Stores, Inc.
A Walmart location uses solar panels to generate power in Corona, CA.
Introduction 7North Carolina Has Great
Potential for Rooftop Solar Energy
N
orth Carolina is an emerging powerhouse 3,000 MW of distributed solar power—enough to
for solar energy. Aided by excellent solar offset the annual energy use of these buildings by
resources and several large-scale solar as much as 60 percent. 6
farms, North Carolina’s installed solar capacity has
With the right policies in place, North Carolina can start
climbed to 322 megawatts (MW) as of September
developing its potential for rooftop solar energy and
2013, placing it fifth in national rankings for cumula-
speed the state’s transition to a clean energy future.
tive installed solar energy capacity.3 However, North
Carolina’s commercial and residential solar energy
markets are much less developed than other lead- North Carolina Has Good Solar
ing states for installed solar capacity. Boosting and
Resources
diversifying solar power in North Carolina, including
by providing strong support for commercial rooftop North Carolina is ideally positioned to take advantage
solar power, will bring enormous environmental, of solar energy. Solar resource quality at a given loca-
public health and economic benefits to the state. tion can be measured by the average output of a solar
photovoltaic (PV) panel over the course of a year. The
North Carolina can continue to move towards a clean
output—or amount of solar power generated—de-
energy future by tapping into one of its most abun-
pends on the intensity of the sunlight reaching the
dant solar energy resources: empty rooftops. About
panel, which varies from hour to hour with the weather
three-quarters of North Carolina’s currently installed
and the passing of day and night, and from season to
solar energy capacity is in “utility-scale” ground-
season with the angle of the sun and length of the day.
mounted PV installations larger than 1 MW.4 Rooftop
solar energy systems are smaller, but can be installed North Carolina has more than 250 sunny days per year,
on millions of empty rooftops across the state, pro- and the state’s overall solar resources exceed those of
ducing energy closer to where North Carolinians will New Jersey, the nation’s third-largest market for solar
use it and helping North Carolina ramp up its overall power (in terms of total capacity) in 2012.7 (See Figure 1.)
production of clean, renewable solar power.
North Carolina has tremendous potential for rooftop North Carolina Has Millions
solar power, particularly on the large, flat and mostly of Rooftops Suitable for Solar
vacant rooftops of commercial buildings such as
Development
supermarkets, enclosed malls and “big box” retail
stores. Most solar energy systems on big box stores North Carolina has millions of sun-drenched rooftops
or supermarkets can exceed 100 kilowatts (kW) in that are suitable for solar PV systems. Solar PV panels
size, but some of these buildings can support systems produce the most power when they are placed on a
that approach or exceed 1 MW.5 In North Carolina, roof with optimal sun exposure. Appropriate locations
large commercial buildings could support about face south and are not shaded by trees or other objects
8 Solar on SuperstoresFigure 1. North Carolina Has Good Solar Resources
Photovoltaic Solar Resource of the United States
Credit: National Renewable Energy Laboratory
C A A
N A D
N
EA
OC
C
TI
N
A
L
T
A
PA EA
OC
CI N
F
C
I
M
E
Pacific Ocean
X
I
E X I C O
f M
F o
C
Arctic
Ocean L
RUSSIA U
G
O
CANADA
k W h / m 2 / Ye a r
Bering
00
00
00
00
00
00
00
00
00
00
00
00
00
00
00
00
Sea
10
11
12
13
14
15
16
17
18
19
20
21
22
23
24
25
Gulf of
Alaska
This map was produced by
the National Renewable Energy Laboratory
0 250 500 1,000 0 250 500 1,000 Miles for the U.S. Department of Energy.
Miles May 30, 2008
Annual average solar resource data are for a solar collector oriented toward the south at a tilt = local latitude. The data for Hawaii and the 48 contiguous
states are derived from a model developed at SUNY/Albany using geostationary weather satellite data for the period 1998-2005. The data for Alaska are
derived from a 40-km satellite and surface cloud cover database for the period 1985-1991 (NREL, 2003). The data for Germany were acquired from the
Joint Research Centre of the European Commission and is the yearly sum of global irradation on an optimally-inclined surface for the period 1981-1990.
for most of the day. According to the National Re- such as IKEA or Best Buy. The roofs of these build-
newable Energy Laboratory (NREL), North Carolina ings are generally flat, mostly vacant, and almost
has enough properly oriented and available rooftop always fully exposed to the sun, making them ideal
space to install 23 gigawatts (GW) of rooftop solar locations for solar panels. They are also quite large;
capacity—enough to supply the equivalent of 21 grocery stores can take up to 65,000 square feet of
percent of the state’s 2012 electricity use.8 space, while big box retail stores range from 100,000
to 250,000 square feet.9 Enclosed malls can exceed
Commercial Buildings Are Ideal for 500,000 square feet.10 Solar PV systems on these
Rooftop Solar Energy Systems buildings can exceed 100 kW in size—compared to
3 kW to 8 kW for residential systems.11 Solar panels
A large share of North Carolina’s potential for rooftop
could also provide shade in the parking lots of these
solar energy lies on the rooftops of large commer-
stores, some of which span several acres, while tak-
cial buildings, such as supercenters, enclosed malls,
ing up no additional land and reducing vehicle fuel
outdoor shopping centers and “big box” retail stores
consumption for air conditioning use.12
North Carolina Has Great Potential for Rooftop Solar Energy 9Commercial Rooftop Solar
Power Has Untapped Benefits
for North Carolina
C
ommercial rooftop solar power offers unique Installing 3,000 MW of rooftop solar power on
benefits for North Carolina, making it an large commercial buildings would generate more
important addition to the state’s solar energy than 4 million MWh of electricity annually—off-
capacity. setting as much as 60 percent of the annual elec-
tricity used by these commercial buildings and
Rooftop solar PV panels capture the energy in
contributing to a more stable electricity grid.15
sunlight and turn it into electricity, supplying power
Replacing that much dirty electricity with clean, re-
directly to the buildings on which they are installed.
newable solar power would also help the state avoid
Buildings with rooftop solar PV systems are typically
global warming pollution equivalent to that emitted
connected to the electric grid. The grid provides sup-
by nearly 600,000 of today’s passenger vehicles each
plemental power during cloudy weather or at night,
year.16
and during sunny weather it distributes the extra
electricity produced by the panels for use elsewhere.
Producing electricity closer to the customers that will Commercial Rooftops Can Generate
use it also reduces electricity waste during transmis- Large Quantities of Solar Power
sion and distribution from far-away power sources,
making rooftop solar an important supplement to Large commercial buildings represent one of North
utility-scale solar production. Carolina’s best opportunities to expand solar en-
ergy in the state. Between its grocery stores, big box
On commercial buildings, rooftop solar energy sys- retail chains, department stores, malls and shopping
tems can help offset high electricity use for lighting, centers, North Carolina has about 160 million square
refrigeration, heating and cooling, while contribut- feet of available rooftop space to support solar PV
ing to a cleaner and more reliable electricity grid. For installations. (See Table 1.) That amount of rooftop
example, some Walmart stores use more than 28,000 space could support more than 3,000 MW of solar
kilowatt-hours (kWh) of electricity per day—equiva- energy capacity—enough to generate as much
lent to the energy use of 600 North Carolina homes.13 electricity as one medium to large coal-fired
In the South Atlantic region, of which North Carolina power plant.17 Installing 3,000 MW of solar energy
is a part, large grocery stores, malls, big box stores capacity would increase the state’s capacity more
and other retailers are responsible for about 16 per- than nine-fold, and it would produce the equivalent
cent of all commercial energy use.14 of 3 percent of North Carolina’s 2012 electricity use.18
10 Solar on SuperstoresIn other parts of the country, many of the nation’s top So far, North Carolina has developed very little of
retailers are already taking advantage of solar power. its rooftop solar energy resources, particularly in
According to the Solar Energy Industries Association the commercial sector. However, previous research
(SEIA), almost half of the top 25 commercial solar from Environment North Carolina Research & Policy
customers in 2013 were major retailers such as Kohl’s, Center shows that with the right policies in place,
Costco or Staples.20 (See Figure 2.) North Carolina could develop at least 7,000 MW
Table 1. North Carolina Commercial Establishments by Business Category19
Building Size Range
Commercial Building Category Number of Establishments (Square Feet)
Supermarkets and Grocery Stores 1,860 20,000-65,000
Department Stores (includes some “big box” retailers) 253 65,000-200,000
Warehouse Clubs and Supercenters 142 100,000-250,000
Figure 2. The Largest Commercial Solar Customers in 2013 Were Major National Retailers21
Credit: Solar Energy Industries Association
Commercial Rooftop Solar Power Has Untapped Benefits for North Carolina 11of solar energy capacity by 2030—equivalent to Solar Power Contributes to
700,000 small-scale rooftop solar energy systems.22
a Cleaner and More Reliable
More rooftop solar power would not only reduce Electricity Grid
North Carolina’s dependence on dirty fossil fuels
and help clear the air, but also help boost the state’s Solar panels generate the greatest amount of
economy by giving rise to more solar energy busi- electricity at the times when it is most needed—
nesses, like large-scale solar developers such as Strata particularly on hot, sunny summer days, when air
Solar in Chapel Hill and FLS Energy in Asheville, and conditioner use increases and energy demand spikes.
small-scale commercial and residential solar develop- Even though energy demand may only peak two or
ers such as Southern Energy Management based in three days per year, millions of dollars of generation
Morrisville.23 and transmission infrastructure must be in place to
ensure the supply of power meets demand in order
to avoid blackouts or brownouts. During periods of
Installing Solar Energy Systems Is peak consumption, electricity providers must bring
Cost-Effective peaking power plants, which are expensive to oper-
ate, on line to ensure reliability of service.
North Carolina is ideally positioned to start develop-
ing its commercial solar market, particularly given Rooftop solar power’s characteristics reduce the need
the declining cost of solar power. In 2012, the in- to run these peaking power plants or to build more
stalled cost of solar photovoltaic panels declined by power plants or transmission lines. Because rooftop
27 percent in the U.S. compared to the year before, solar panels generate electricity near where they are
according to Greentech Media and SEIA’s annual U.S. used, they reduce the need to invest in new high-
Solar Market Insight Report.24 These declining prices voltage transmission lines and reduce the electricity
are partially a result of increasing economies of scale losses that result from long-distance transmission of
in solar panel production and falling prices for solar power from large, centralized power plants.29
modules.25 Nationwide, the price of solar PV modules
In addition, solar panels provide energy for decades
dropped precipitously in 2012, falling 41 percent from
at a fixed cost, because sunlight is free. Fossil fuels
an average sales price of $1.15/Watt (W) in the fourth
often experience wild price swings. Solar PV can act
quarter of 2011 to $0.68/W at the end of 2012.26 In
as an effective hedge against these price fluctuations,
North Carolina, average installed prices for residential
helping to maintain stable electricity prices.30
and commercial photovoltaic systems fell by 16 per-
cent in 2012.27 No other type of major power genera- Finally, rooftop solar energy requires no additional
tion technology is achieving cost reductions at such a land beyond that already occupied by buildings,
rapid pace.28 parking lots or other developed areas, and consumes
practically no water.
As the market for solar PV grows in North Carolina,
the industry is likely to develop economies of scale
in manufacturing and installation, which will bring
down costs even further.
12 Solar on SuperstoresWalmart: The nation’s largest corporate producer of solar power
Photo: Walmart Stores, Inc.
Thin-film solar panels produce energy on a Walmart location in Marina, CA.
With 89 MW of solar energy capacity installed on its stores at the end of 2013, Walmart is now the nation’s
largest corporate producer of solar electricity.31 (See Figure 2 on page 11.) Worldwide, Walmart has 150
solar PV installations that deliver a total of 71,000 MWh of electricity annually to its stores and distribution
centers; that’s enough electricity to power over 4,000 typical North Carolina homes for a year.32 According
to the company, as of July 2012 renewable energy sources such as solar energy supplied about 4 percent
of the annual energy used in Walmart locations.33
According to Marty Gilbert, Walmart’s energy director, the company decides which store locations receive
solar panels based on how they will improve the bottom line of each store. “The only projects that we
were doing are the ones that economically make sense at the store level,” said Gilbert in an interview with
Bloomberg Businessweek.34
Some of the company’s solar energy projects are in places with high utility rates, such as California, where
at least 75 percent of all Walmart-owned locations will have solar panels by the end of 2013.35 Other proj-
ects are spread across locations in Ohio, Hawaii, Puerto Rico and Connecticut, where utility rates or other
factors have made solar power an attractive investment.36 As of September 2013, there are no installations
at Walmart locations in North Carolina.
Walmart plans to continue building its rooftop solar resources. The company is planning to install solar
energy systems on 1,000 of its store locations by 2020.37
Commercial Rooftop Solar Power Has Untapped Benefits for North Carolina 13Solar Energy Works for North
Carolina’s Environment,
Public Health and Economy
S
olar power protects North Carolina’s public peratures could increase by 2.5°F by 2025 and up to
health and the environment by offsetting the 11°F by 2100.39 Climate scientists warn that higher
state’s reliance on fossil fuels, and creates new temperatures will impact many aspects of North
jobs to strengthen the state’s economy. Commercial Carolina’s environment and economy. For example:
rooftop solar power is an untapped opportunity
• Hotter summers will cause North Carolina’s
for North Carolina to continue its current progress
spruce and fir forests to retreat northward, while
as a solar energy leader and move towards a clean
warmer winters that allow certain pest species
energy future.
to survive for more of the year will increase
the vulnerability of these forests to insect
Solar Energy Protects Our outbreaks.40 Loss of spruce and fir forests will
Environment shrink the habitat available for many birds and
mammals living in these forests.
Increased deployment of commercial-scale solar
energy systems can reduce North Carolina’s depen- • Global warming is likely to exacerbate exist-
dence on fossil fuels and lessen its contribution to ing threats to North Carolina’s rich diversity of
global warming. Solar energy helps reduce fossil aquatic species, including increased pollution,
fuel combustion for electricity generation, reducing alteration of physical habitat and hydrological
emissions of carbon dioxide, the leading pollutant patterns, and increased penetration of invasive
driving global warming.38 In addition, reducing fos- species. These problems already affect 83 of the
sil fuel consumption helps protect the Appalachian state’s fish species, 43 mussel species, 21 crayfish
Mountains from the harmful impacts of coal min- species and 10 snail species, all of which have
ing, as well as the state’s rivers and lakes from water been identified as priorities for conservation.41
withdrawals by power plants.
• By 2080, sea-level rise is expected to erode 14 of
the 17 recreational swimming beaches in south-
Global Warming ern North Carolina. For the southern beaches in
North Carolina’s environment and economy are the state, the lost recreation value is projected to
vulnerable to the impacts of global warming. Cli- be $93 million a year by 2030 and $223 million a
mate models predict global average surface tem- year by 2080.42
14 Solar on SuperstoresIn North Carolina’s regional electricity grid, en- Solar Energy Protects Public Health
ergy sources used to meet daily peak electricity
needs emit more than 1,680 pounds of carbon Replacing electricity from dirty fossil fuels with clean
dioxide pollution for every megawatt-hour of solar power also protects the health of North Carolina
electricity generated. In comparison, solar pan- residents. Fossil-fueled power plants emit ozone-
els emit zero carbon dioxide pollutants. 43 forming compounds that can damage lung tissue and
airbourne mercury that can build up in the food chain
Installing 3,000 MW of solar energy capac- and pose human health threats. Using large com-
ity on the state’s large commercial buildings mercial buildings to increase North Carolina’s solar
would generate enough electricity to pre- energy production can reduce the state’s reliance
vent 3 million metric tons of global warming on dirty energy and help avert these public health
pollution—equivalent to that emitted by hazards.
nearly 600,000 of today’s passenger ve-
hicles. 44 Soot and Smog
Reducing fossil fuel combustion decreases emissions
Land Use and Water Pollution of health-threatening air pollutants, such as soot and
Solar power also reduces the need for coal min- smog. North Carolina’s power plants harm public
ing, which has destroyed large tracts of land health by emitting a variety of pollutants, including
in the Appalachian Mountains. Mountaintop pollution that contributes to ground-level ozone, a
removal methods have scarred some parts of key element of smog. When inhaled, ozone quickly
the Appalachian Mountains with mines, some reacts with airway tissues and produces inflamma-
as big as the island of Manhattan, and afflicted tion similar to sunburn on the inside of the lungs. This
nearby communities with polluted air and poi- inflammation makes lung tissues less elastic, more
soned water. Mines using mountaintop removal sensitive to allergens, and less able to ward off infec-
supply coal to 13 North Carolina power plants. 45 tions.48 Minor exposure to ozone can cause coughing,
When North Carolina and other states are us- wheezing and throat irritation. Constant exposure
ing enough solar power to displace significant to ozone over time can permanently damage lung
amounts of coal power, the pressure to mine tissues, decrease the ability to breathe normally, and
for coal will be reduced. exacerbate or potentially even cause chronic diseases
like asthma.49
Solar power has the additional benefit of con-
serving water. Traditional power plants depend The American Lung Association’s 2013 State of the
heavily on a constant supply of water to pro- Air report awarded air quality grades of “C” or lower
duce steam and cool the plants. 46 North Caroli- to 16 of the 33 North Carolina counties for which it
na’s electric utilities are responsible for over 80 collects data based on those counties’ high levels
percent of the water withdrawals in the state. 47 of ground-level ozone.50 However, with 3,000 MW
In contrast, solar photovoltaic systems gener- of solar energy capacity on commercial buildings,
ate electricity using very little water. Replacing North Carolina could replace 3 percent of its 2012
traditional electric production with solar power fossil fuel-generated electricity use, which would
will relieve some of the stress on the state’s help the state avoid more than 5 million pounds of
water supplies. smog-forming nitrogen oxide pollution from power
plants annually.51
Solar Energy Works for North Carolina’s Environment, Public Health and Economy 15Mercury North Carolina is already home to 121 businesses
that develop, manufacture, sell or install solar panels;
Coal-burning power plants produce more than half of
these businesses employ 1,400 people, according
all emissions of airborne mercury in the U.S., a potent
to SEIA, and they have a significant impact on local
neurotoxicant that is converted by microorganisms
economies.59 For example, Durham-based Semprius
into a form that accumulates up the food chain.52
Energy will hire 250 new employees over the next
North Carolina has 24 coal-burning power plants,
several years to run its recently opened manufactur-
and fish consumption advisories have been issued for
ing facility in Henderson.60 Schletter, Inc., which sup-
more than 50 types of fish and shellfish from rivers,
plies 25 percent of all solar panel mounting systems
lakes and coastal areas due to the threat posed by
produced and delivered in the U.S., announced plans
mercury contamination, especially to children, nurs-
in 2012 to set up its national headquarters in Shelby
ing mothers and pregnant women.53
and hire 300 people by 2016 to run a production and
By reducing the need for electricity from fossil fuel- distribution center in Cleveland County.61 The com-
fired power plants, solar power reduces the threat pany plans to pay its Cleveland County employees
posed by mercury contamination. $41,000 per year plus benefits on average—about
$8,000 higher than the current average annual wage
in the county.62
Solar Energy Creates Jobs and
Strengthens the Economy In addition to their direct impact on local economies
in the form of wages paid to employees or property
North Carolina’s solar energy industry is thriving, taxes paid to local governments, solar energy busi-
and it has more room to grow. Increasing the market nesses contribute indirectly to economic growth as
for commercial-scale rooftop solar power in North well. In Beaufort County, Duke Energy’s largest solar
Carolina would create jobs in manufacturing of solar energy project to date is expected to bring about
panels and other parts of solar energy systems, as $21 million into the local economy by creating local
well as sales and installation, and would boost the construction jobs and increasing spending at local
state’s economy. retailers, motels and restaurants.63
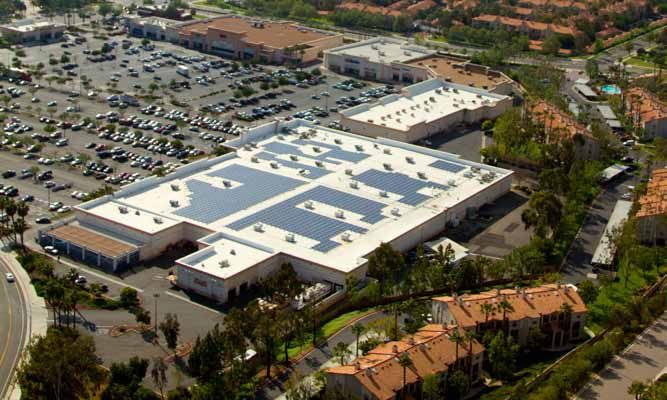
16 Solar on SuperstoresIKEA Charlotte Installs a 1.1 MW Rooftop Solar Energy System
IKEA, the Swedish home furnishings retailer, is putting its rooftop space to work generating clean, renew-
able solar power. Thirty-nine of IKEA’s 44 U.S. locations now have rooftop solar energy installations, with
IKEA Charlotte going online in June 2013.54 The 1.1 MW array at IKEA Charlotte brings total solar capacity
at IKEA stores nationwide to 35 MW—making IKEA the fifth-largest corporate user of solar electricity in
the U.S.55 (See Figure 2 on page 11.) According to IKEA’s website, the company plans to continue to ramp
up its use of solar energy and other renewable energy to produce more energy than it uses by 2020.56
In Charlotte, IKEA was able to use 120,000 square feet of sun-drenched rooftop space for the solar energy
installation.57 The Charlotte solar array is expected to produce 1,300 MWh of electricity annually—or
enough electricity to power 140 homes, according to the company.58
Photo: IKEA Charlotte
Solar panels generate clean power on an IKEA location in Charlotte.
Solar Energy Works for North Carolina’s Environment, Public Health and Economy 17North Carolina Can Launch a
Market for Commercial Solar Power
N
orth Carolina can start taking advantage of its • Eleven of these states also have strong net meter-
potential for commercial rooftop solar now. ing policies, which help support residential
The cost of installing solar PV panels has de- markets for rooftop solar power. In nearly all of
clined significantly in recent years, making investments these states, consumers are compensated at the
in solar energy more attractive. However, up-front full retail rate for the excess electricity they supply
installation costs can still deter many business owners, to the grid. Net metering ensures that consum-
and there are other barriers as well, such as siting and ers receive reliable and fair compensation for the
permitting restrictions, interconnection regulations, electricity they provide to the grid.
and taxes and fees. In addition, businesses often lease
• Ten of the 12 have strong statewide intercon-
commercial space, resulting in a problem of “split in-
nection policies. Good interconnection policies
centives” between tenants interested in installing solar
reduce the time and hassle required for individuals
panels and property owners responsible for capital
and companies to connect solar energy systems to
improvements. These barriers can make solar energy
the grid.
investments less attractive to potential customers.
• The vast majority of the states allow for creative
States with strong solar energy markets have worked financing options such as third-party power
to eliminate financial barriers and simplify the instal- purchase agreements that can significantly lower
lation process. For example, the 12 leading states for the up-front cost of installing solar energy systems.
solar power (including North Carolina) account for only
28 percent of the U.S. population but more than 85
percent of the nation’s total solar electricity generat- North Carolina Can Improve
ing capacity.64 Many of these states have taken similar Its Energy Policies to Boost Its
policy approaches that have helped lead to strong Commercial Solar Market
solar market growth, including the development of a
robust commercial solar energy market. For example, North Carolina has several policies that have helped
according to a recent report by Environment America promote utility-scale solar power in the state, includ-
Research & Policy Center:65 ing a generous solar investment tax credit and other
incentives for manufacturers of solar technologies.66
• All but one of the top 12 states have renewable It is this commitment to utility-scale solar energy that
electricity standards (RES) that set minimum has earned North Carolina its place as the fifth-best
requirements for the share of a utility’s electricity state for cumulative installed solar energy capacity.67
that must come from renewable sources, and nine However, North Carolina’s potential is far from real-
of them have solar carve-outs that set specific ized. While the state ranks fifth nationwide for overall
targets for solar or other forms of clean, distributed installed capacity, the state ranks only 11th on a per
electricity. capita basis.68 Much smaller states, with less attractive
18 Solar on Superstoressolar resources, are outpacing North Carolina when annual scorecard grading states on their net meter-
it comes to solar energy, in large part because their ing and interconnection policies.73 North Carolina can
policies are stronger, and they have done more to improve its net metering policies by limiting these
develop commercial and residential markets. standby fees, and by requiring co-op and municipal
utilities to offer net metering to their customers, in
For example, New Jersey’s RES requires nearly twice
addition to investor-owned utilities.
as much renewable energy as that of North Carolina,
and the state recently increased its solar “carve-out” Another key policy to support rooftop solar energy
to ensure that a significant share of that clean en- growth that is present in other top states but miss-
ergy comes from the sun.69 A stronger RES—with a ing in North Carolina is allowance of third-party sales
stronger solar carve-out—would inspire confidence of electricity. In third-party sales agreements, solar
among consumers and solar businesses and encour- developers lease rooftop space from home or busi-
age more long-term investments in solar energy ness owners for the installation of solar panels. The
installations of all sizes. solar developer retains ownership of the panels, and
customers then sign a “power purchasing agree-
In addition, while North Carolina requires investor-
ment” (PPA) to pay a monthly fee for the electricity
owned utilities to reimburse net metering customers
the panels produce, often at lower rates than those
at the retail rate for the excess electricity they provide
charged by electric utilities. Third-party sales shift the
to the grid, there are several limitations, restrictions
up-front cost of installing solar panels and the cost of
and fees that weaken the policy and reduce incen-
ongoing maintenance to the solar developer, mak-
tives for homeowners and business owners to go
ing the benefits of solar energy more affordable to
solar. For example, residential and commercial cus-
customers and protecting customers against electric-
tomers that use net metering are usually credited for
ity price increases. In North Carolina, however, only
the extra electricity they supply to the grid on their
electric utilities such as Duke Energy are allowed to
next month’s utility bill; however, they must surren-
sell power to customers—if a solar company wants
der all accrued credits to the utility—without com-
to establish a PPA program, state law requires it to be
pensation—at the beginning of each summer billing
regulated as a utility, effectively prohibiting this type
cycle.70 Additionally, businesses with systems over
of financing in North Carolina by non-utilities.
100 kW in size (and homeowners with systems larger
than 20 kW) must pay monthly “standby fees” to the Third-party sales could help make solar energy in-
utility for having to hold backup generation in re- vestments particularly attractive to business owners.
serve in case the solar PV systems ever goes down.71 Because the solar energy company retains owner-
These fees are assessed based on the size of the PV ship of the panels, it shoulders the risk of the invest-
system, rather than on the amount of electricity the ment, greatly reducing the financial burden on the
utility might actually need to provide if the system business owner. Lower up-front costs may also allow
goes down. For small generators for whom utilities business owners to consider installing larger systems
would only need to provide a small amount of back- to displace more of their annual consumption than
up power, standby charges can diminish most, if not they otherwise would have if they had to pay for
all, of the economic incentive that net metering is the installation themselves. The solar company also
intended to provide.72 These and other restrictions typically handles permitting and interconnection
earned North Carolina’s net metering policies a “D” paperwork in addition to ongoing maintenance on
grade in Freeing the Grid 2012, the Interstate Renew- the panels—further simplifying participation for solar
able Energy Council and the Vote Solar Initiative’s energy customers.
North Carolina Can Launch a Market for Commercial Solar Power 19Policy Recommendations
N
orth Carolina’s policies have played a major the solar electricity that they produce. Investor-
role in making the state a leader when it owned utilities should be required to reduce
comes to solar. The following policies will “standby fees” to encourage large commercial
help ensure we continue that leadership, and do even customers to install solar panels, and co-op and
more to develop the state’s rooftop solar market. municipal utilities should be required to offer net
metering to their customers.
1. Enable third-party sales of electricity. Financ-
ing rooftop solar energy systems through third- 4. Extend incentives for investing in solar
party electricity sales significantly lowers the technologies in North Carolina. Current
up-front cost of installing solar PV systems for renewable energy tax credits for businesses
commercial consumers. The state should allow and residents will expire by the end of 2015. In
companies that install solar panels to sell electric- order to build a strong, self-sustaining market for
ity to their customers without subjecting them to renewable energy in North Carolina, the state
the same regulations as large public utilities, such should extend these tax credits and then phase
as Duke Energy. them out in a planned and orderly fashion over a
number of years.
2. Fairly compensate large solar energy produc-
ers in power purchasing agreements. North 5. Reduce siting, permitting, and interconnec-
Carolina currently requires utilities to purchase tion restrictions that can greatly increase the
power from large commercial or utility-scale solar total cost of installing solar energy systems. As
producers in their service territories, but only at much as 23 percent of the total installed cost
a very low rate mostly made up of the utilities’ of solar energy systems is related to permit-
“avoided cost” for not generating and deliver- ting, inspection, interconnection and other
ing the electricity. Because the avoided cost rate non-hardware costs.74 The state should work with
does not account for many important benefits of local governments to streamline these processes
solar power—such as its unique ability to reduce and reduce red tape.
costs at periods of peak demand or to reduce 6. Defend and strengthen the state’s renew-
harmful air pollution—the state should increase able energy standard to require utilities to get
the required rate of compensation for solar devel- 20 percent of their electricity from renewable
opers to more accurately reflect the true value of sources by 2020, and to increase requirements for
solar power. solar energy production. The state should also
3. Improve the state’s net metering laws. Net require all of the solar power that counts towards
metering helps ensure that small commercial or North Carolina’s renewable energy standard to
residential customers are fairly compensated for be produced within the state.
20 Solar on SuperstoresMethodology
Solar PV Technical Potential: Large We then apportioned the total rooftop space on big
box stores in the South Atlantic to North Carolina
Commercial Buildings
according to the percentage of the South Atlantic
To estimate the technical potential for solar PV sys- census region population living in North Carolina in
tems on large commercial buildings in North Carolina, 2003—about 16 percent.77
we used the U.S. Energy Information Administra-
This yielded 245 million square feet of rooftop area
tion’s Commercial Building Energy Consumption Survey
on large commercial buildings in North Carolina.
(CBECS) to determine the square footage of large
We assumed that 65 percent of this rooftop area
commercial buildings in the South Atlantic census re-
is suitable for rooftop solar energy systems, per a
gion.75 We defined large commercial buildings using
2008 study by Navigant Consulting for the National
CBECS microdata and the following selection criteria:
Renewable Energy Laboratory, Rooftop Photovolta-
• Small grocery stores and strip malls—These ics Market Penetration Scenarios.78 In calculating this
buildings are between 25,001 and 100,000 square number, Navigant took into account factors such
feet with the following principal building activities: as tree and other shading on residential and larger
grocery, other food sales and strip shopping malls. buildings, roof tilt and orientation, and the room
needed on roofs between solar panels and taken up
• “Big box” retail stores and large supermarkets by other objects such as chimneys and fan systems.
or superstores—These buildings are between
100,001 and 500,000 square feet with the follow- This yielded 160 million square feet of rooftop area
ing principal building activities: grocery, food sales, available and appropriate for rooftop solar PV sys-
strip shopping mall, retail store and other retail. tems. At 18.5 percent conversion efficiency, installing
solar PV systems on all available and appropriate
• Enclosed shopping malls and large strip rooftop space on large commercial buildings would
malls—These buildings are from 500,001 to yield 3,101 MW of solar energy capacity.79
1,000,000+ square feet with the following princi-
pal building activities: enclosed mall and strip
shopping mall. Energy Output
Then, using Microsoft Access, we used CBECS micro- We calculated the energy output of solar PV panels in
data to divide the total floor space in each building by North Carolina using a population-weighted state av-
the number of floors in each building.76 This gave us erage annual electricity generation estimate of 1,299
an estimate of rooftop space available on each build- kWh per kW, per the National Renewable Energy
ing and of total rooftop space on large commercial Laboratory’s PVWatts tool.80
buildings in the South Atlantic census region.
Methodology 21Estimating North Carolina’s Future Energy Consumed by Large
Electricity Needs Commercial Buildings
Calculations for the equivalent percent of North Caro- To estimate how much electricity is consumed by
lina’s future energy needs that solar output would large commercial buildings in the state, we used
represent were based on the following. CBECS microdata; the selection criteria listed above
(see “Solar PV Technical Potential: Large Commercial
We derived an estimated value for 2030 electricity
Buildings”); and Microsoft Access to estimate electric-
consumption in North Carolina using the actual and
ity consumption by large commercial buildings in the
forecasted annual growth rates for electricity de-
South Atlantic census region in 2003—the last year
mand for 2010-2025 in the service territories of North
of available data from CBECS. We scaled this number
Carolina’s three largest investor-owned utilities:
down to North Carolina according to the percentage
Progress Energy, Duke Energy and Dominion Power
of the population of the South Atlantic census region
Company.81 The 2012 integrated resource plans (IRP)
living in North Carolina.83
of these utilities included projected energy sales in
their service territories through 2025. We applied the
annual rate of growth in energy sales among these Reducing Global Warming Pollution
three utilities to actual statewide electricity consump-
We estimated global warming pollution from electric-
tion in 2010, per Energy Information Administration
ity generation as follows.
State Electricity Profiles, to estimate statewide electric-
ity consumption each year through 2025.82 From 2025 We assumed that energy generated by solar PV
to 2030, we assumed consumption would increase at would primarily replace non-baseload electricity gen-
an average annual rate of 1.6 percent. eration. In the SERC Virginia/Carolina (SRVC) eGRID
subregion, non-baseload electricity sources produce
To be conservative, this calculation assumes that
an average of 1,678 pounds of carbon dioxide per
there are no improvements in the energy efficiency
MWh.84
of residential and commercial buildings (beyond
those assumed in the utilities’ IRPs) in North Carolina For natural gas, we assumed that every million British
before 2030. thermal units (BTU) of avoided natural gas use would
prevent 53 kilograms of carbon dioxide pollution, per
emission coefficients from the U.S. Department of
Energy.85
22 Solar on SuperstoresNotes
1. For the purposes of this report, we assume rooftop 7. 250 sunny days: State Climate Office of North
solar PV systems to be a mix of residential and commercial Carolina, Other Climatic Factors, downloaded from www.
systems averaging 10 kW (DC) in size. nc-climate.ncsu.edu/climate/ncclimate.html, 24 July 2013;
State rankings: Solar Energy Industries Association, 2012
2. Population estimates for 2002 and 2012 per U.S.
Top 10 Solar States, downloaded from www.seia.org/
Census Bureau, State Population Estimates: April 1, 2000 to
research-resources/2012-top-10-solar-states, 19 September
July 1, 2002, released 20 December 2002, and U.S. Census
2013.
Bureau, State and County Quickfacts: North Carolina,
downloaded from quickfacts.census.gov, 24 July 2013. 8. Anthony Lopez, et al., National Renewable Energy
Laboratory, U.S. Renewable Energy Technical Potentials:
3. As of September 2013, the Solar Energy Industries
A GIS-Based Analysis, July 2012; North Carolina’s 2012
Association reported 322 MW of installed solar energy
electricity use: See “Estimating North Carolina’s Future
capacity that ranks North Carolina fifth in the country
Electricity Needs” in the methodology.
for cumulative solar capacity, per Solar Energy Industries
Association, North Carolina Solar, downloaded from www. 9. U.S. Department of the Treasury, Community
seia.org/state-solar-policy/north-carolina, 18 September Development Financial Institutions Fund, “Understanding
2013. the Grocery Industry” in Financing Healthy Food Options:
Implementation Handbook, 30 September 2011, and
4. 322 MW as of November 2013: Ibid. SEIA also
Institute for Self Reliance, How Big Are Big Box Stores?,
reported in September 2013 that the state has 254 MW of
downloaded from www.ilsr.org/how-big-are-bigbox-stores,
operational utility-scale solar installations larger than 1
17 July 2013.
MW per Solar Energy Industries Association, Major Solar
Projects in the United States Operating, Under Construction, 10. Elaine Misonzhnik, “Return of the Mall,” Real Estate
or Under Development (fact sheet), 1 November 2013. Investor, 5 May 2011.
5. IKEA, for example, has several rooftop solar PV 11. Size based on data from the California Solar
arrays on its stores and distribution centers that exceed 1 Initiative: California Energy Commission & California
MW in size, per IKEA, IKEA Powers-Up Solar Panels Atop Public Utilities Commission, California Solar Initiative
Charlotte, NC Store (press release), 4 June 2013; IKEA, IKEA Working Data Set, 7 September 2011, available at www.
Completes Maryland’s Largest Rooftop Solar Array Atop californiasolarstatistics.ca.gov/current_data_files; Systems
Distribution Center in Perryville, MD (press release), 18 take approximately 100 square feet of roof area per kW, per
April 2013; and David Shaffer, “Ikea’s Rooftop Solar Array Solaris Blackstone, Frequently Asked Questions, downloaded
Will Be the Largest in Minnesota,” Star Tribune, 12 January from www.solarisblackstone.com, 20 January 2012.
2012.
12. Will Macht, Urban Land Institute, Greening the Big
6. See methodology. Blue Box, 26 October 2012.
Notes 2313. Walmart daily electricity consumption: Aly 18. More than nine-fold: North Carolina’s cumulative
Courtemanch and Lani Bensheimer, “Environmental installed solar PV capacity as of November 2013 was
Impacts of the Proposed Wal-Mart Supercenter in 322 MW, per note 3; 3 percent of North Carolina’s 2012
Potsdam,” Conservation Biology, 29 April 2005; North electricity use: See note on population-weighted average
Carolina homes use about 17,000 kWh per year, calculated solar radiation in North Carolina, Ibid. For North
by dividing state residential electricity consumption in Carolina’s 2012 electricity use, see “Estimating North
2010 (62,160,000 MWh per U.S. Energy Information Carolina’s Future Electricity Needs” in the methodology.
Administration, State Electricity Profiles 2010, 27 January
19. Number of commercial establishments and business
2012) by number of households in the state (per State and
categories: U.S. Census Bureau, 2007 Economic Census:
County Quickfacts: North Carolina, note 2).
Retail Trade: Subject Series - Misc Subjects: Floor Space by
14. Large commercial buildings in the South Atlantic Selected Kind of Business for the United States and States:
region (as we have defined them in the methodology), 2007, downloaded from factfinder2.census.gov, 17 July 2013;
consume about 42 billion kWh of electricity annually, per Building size ranges: U.S. Department of the Treasury,
U.S. Energy Information Administration, 2003 Commercial “Community Development Financial Institutions Fund,
Buildings Energy Consumption Survey, June 2006. All ‘Understanding the Grocery Industry,’” Financing Healthy
commercial buildings in the South Atlantic region consume Food Options: Implementation Handbook, 30 September
254 billion kWh of electricity annually, according to 2011; See Institute for Self Reliance, note 9; and Chain
CBECS. Store Guide, A Look Into The Top 10 Department Store
Companies, downloaded from www.narms.com/pdf/
15. See methodology. NARMS1285687711.pdf, 26 September 2013. Note: The
North America Industry Classification System (NAICS)
16. See methodology; Passenger vehicles emit about
definition for “department store” used by the 2007
5.2 metric tons of carbon dioxide annually, per U.S.
Economic Census includes “big box” stores selling general
Environmental Protection Agency, Emission Facts:
housewares such as Target or Walmart; however some
Greenhouse Gas Emissions from a Typical Passenger Vehicle,
“big box” stores that sell specific categories of products,
February 2005.
such as electronics, home improvement materials, or office
17. See methodology; calculation assumes a coal-fired supplies, fall under their own “specialty store” categories
power plant to be 500 MW in size with a capacity factor of and therefore may not be listed in Table 1. (See U.S. Census
63.9 percent per U.S. Energy Information Administration, Bureau, 2002 Economic Census—Appendix B, NAICS Codes,
Electric Power Annual 2009, April 2011. Capacity factor Titles, and Descriptions, downloaded from www.census.gov/
for solar panels is assumed to be about 15 percent, based prod/ec02/ec0244i11ab.pdf, 24 July 2013).
on a population-weighted average solar radiation in
20. Solar Energy Industries Association, Solar Means
North Carolina of 1,299 KWh AC per kWDC per year, per
Business: Top U.S. Commercial Solar Customers, 15 October
National Renewable Energy Laboratory, PVWatts Grid
2013.
Data Calculator (Version2), downloaded from www.nrel.
gov, 10 June 2013; Population estimates for Greensboro, 21. Ibid.
Jacksonville, Fayetteville, Charlotte, Greenville, Raleigh,
Winston-Salem and Rocky Mount obtained from U.S. 22. Siena Kaplan, Frontier Group, and Elizabeth Ouzts,
Census Bureau, State and County Quickfacts, revised 10 Environment North Carolina Research & Policy Center,
January 2013. Growing Solar in North Carolina: Solar Power’s Role in
a Clean Energy Future, November 2009. Note: For the
purposes of this report, we assume rooftop solar PV systems
to be 10 kW (DC) in size.
24 Solar on SuperstoresYou can also read