Soil uplift in the Emilia-Romagna plain (Italy) by satellite radar interferometry - OGS
←
→
Page content transcription
If your browser does not render page correctly, please read the page content below

Bulletin of Geophysics and Oceanography                                                    Vol. XX, n. X, pp. xx-xx; Xxx 20XX
DOI 10.4430/bgo00349

               Soil uplift in the Emilia-Romagna plain (Italy)
               by satellite radar interferometry
               P. Severi
               Servizio Geologico, Sismico e dei Suoli, Regione Emilia-Romagna, Bologna, Italy

               (Received: 21 August 2020; accepted: 9 December 2020; published online: 20 September 2021)

ABSTRACT       Satellite radar interferometry (InSAR) data from 1992 to 2016 in Emilia-Romagna plain
               (about 13,000 km2), has been represented in four maps describing vertical ground
               movements. The maps were created by the Regional Agency for Environmental
               Protection and Energy (ARPAE) on behalf of the Emilia-Romagna Region, to discover
               the areas mostly affected by land subsidence, and provide an opportunity to analyse
               its cause and find remedies. This data set is used to study positive vertical ground
               movements (i.e. uplifts) and their nature. Some areas are found to be constantly rising
               from 1992 to 2016 (Piacenza and Parma plain), others have risen in a differentiated
               or intermittent way (Reggio Emilia, Modena, Ferrara and Bologna plain). There are
               no documented uplifts in the Romagna part of the plain (Ravenna, Forlì and Rimini
               plain). Most of the observed uplifts are due to tectonics as they occur above active
               structures present in the subsoil, such as portions of the Emilian folds, Ferrara folds,
               and the Pede-Apennine Thrust front. Differently, the uplift observed in the Bologna
               plain can be considered related to anthropogenic activities, especially the strong
               increase of piezometric levels due to the reduction of groundwater withdrawals.

Key words: vertical soil movements, active tectonics, recovery of piezometric level.

1. Introduction and purpose

    The Regional Agency for Environmental Protection and Energy (ARPAE) has produced, on
behalf of the Emilia-Romagna Region, four maps that describe the vertical soil movement from
1992 to 2016 in the Emilia-Romagna plain (area approximately 13,000 km2, Fig. 1). The maps
were obtained through satellite interferometry (InSAR).
    The Emilia-Romagna plain constitutes the southern part of the Po Plain, the biggest alluvial
plain in Italy. The Po Plain is an active foredeep basin interposed between two chains still in
formation (Fig. 1): the northern Apennines to the south and the Alps to the north (Ori, 1993).
The upper part of the stratigraphic succession of the Emilia-Romagna plain is made of recent
alluvial sediments (Middle Pleistocene-Holocene), which locally exceed 500 m in thickness
(Di Dio, 1998). These sediments are the result of the Po River and its Apennine tributaries
depositional activity, and are mainly made up of fine and unconsolidated sediments (alternation
of sands, silts, and clays). Gravels are present only in the southern part of the plain, along the
northern Apennine - Po Plain morphological margin (Severi and Bonzi, 2015). Because of the
presence of hundreds of metres of unconsolidated sediments, this sector of the region is subject
to natural subsidence, due to the compaction of these sediments (Carminati and Di Donato,
1999). The four maps of soil vertical movement were produced by the Emilia-Romagna Region to

© 2021 - OGS                                                                                                               1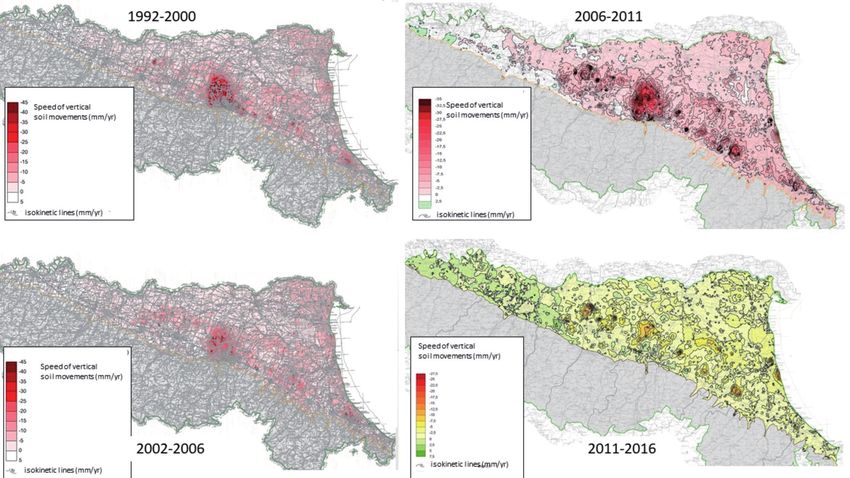
Bull. Geoph. Ocean., XX, XX-XX                                                                                Severi

Fig. 1 - Geographical framework of the Emilia Romagna plain (red boundary: Emilia-Romagna region). In the box at the
top right E-R means Emilia-Romagna region.

understand and deal with subsidence, which in the past has severely affected some parts of the
plain. The main problems related to subsidence are water stagnation or flooding, due to rivers
and canals flow, as well as coastal erosion.
   Subsidence maps highlight the most subsident areas and offer the opportunity to analyse
causes and look for remedies (Strozzi et al., 2001). In addition, during the analysed period,
InSAR data show how some plain sectors were stable or underwent an uplift. The present
work focuses on the analysis of areas without subsidence (stable or rising soil), and on their
evolution over time.

2. Maps of vertical soil movements

    The analysed maps were created by elaborating InSAR data calibrated through precision
topographic levelling or permanent GNSS stations (Bitelli et al., 2000, 2010, 2014, 2015; ARPAE,
2012, 2018a).
    The isokinetic lines on each map show the average speed of the vertical soil movement
during the investigated period. The maps were made in collaboration with the Department of
Civil, Chemical, Environmental and Materials Engineering, University of Bologna and with TRE
ALTAMIRA S.r.l. Milano, Italy (Fig. 2).
    The first map (1992-2000) was created by means of PSInSAR technique [by TRE ALTAMIRA
S.r.l., Ferretti et al. (2001)] using data from the ERS1 and ERS2 satellites in descending
geometry, on a total of 160,000 permanent scatterers (PSs). The InSAR data were calibrated
through a high-precision geometric levelling based on 1,000 benchmarks (ARPAE, 2007). The
second map (2002-2006) was made by PSInSAR technique using ENVISAT images in ascending

2
Soil uplift in the Emilia-Romagna plain (Italy)                                       Bull. Geoph. Ocean., XX, XX-XX

Fig. 2 - Vertical soil movements in the Emilia-Romagna plain (ARPAE, 2007, 2012, 2018a).

and descending geometry (2002-2006), and from RADARSAT-1 acquisitions in ascending
geometry (2003-2005), on a total of 140,000 PSs. The InSAR data were calibrated through
a high-precision geometric levelling, based on 1,000 benchmarks (ARPAE, 2007). The third
map (2006-2011) was created using SqueeSAR technique (by TRE ALTAMIRA) on RADARSAT-1
images acquired in ascending geometry, on a total of 315,000 PSs and distributed scatterers
(DSs). The InSAR data were calibrated with measurements from 17 GNSS permanent stations
(ARPAE, 2012). The fourth map (2011-2016) was created with the SqueeSAR technique using
images from RADARSAT-1 and COSMO-SkyMed ascending geometry, on a total of 1,912,781
PSs and DSs. The InSAR data were calibrated with data from 22 GNSS permanent stations
(ARPAE, 2018a; Bitelli et al., 2020). The evaluations reported in the following are mainly based
on data indicated in the isokinetic lines reported in the cited maps. Explanation of methods
in producing the maps and calibrating InSAR vs. GNSS velocity, evaluation of the errors, kind
of elaborations to detect vertical movement starting from one velocity map in satellite line
of sight (only in ascending geometry) are beyond the scope of the present work, and are
discussed in the cited bibliography.

3. Types of vertical soil movements

   The maps identify areas characterised by different velocities of vertical displacements, i.e. areas
with greater or lesser subsidence, substantially stable areas, and uplift areas. The subsiding areas take
up most of the Emilia-Romagna alluvial plain. Subsidence in the Emilia-Romagna plain is due to natural
and anthropogenic factors (Carminati and Di Donato, 1999; Gambolati et al., 2005; Cenni et al., 2013;
Antoncecchi et al., 2021; Calabrese et al., 2021); the former produce a fairly homogeneously distributed

                                                                                                                  3
Bull. Geoph. Ocean., XX, XX-XX                                                                             Severi

subsidence, while the latter concentrate soil lowering in localised areas (ARPAE, 2008). Natural
subsidence is mainly due to sediment aedometric compaction and tectonics. Natural subsidence
follows the trend of deep plain structures, with lower values on structural highs and higher ones on the
synclines. They generally do not exceed 2-3 mm/yr, with the exception of the active area in the Po Delta
(Fig. 3) where they can reach values over 10 mm/yr (Carminati and Di Donato, 1999; Carminati et al.,
2003; Teatini et al., 2011).

Fig. 3 - Natural land subsidence (in mm/yr) in the Po Plain (modified by Carminati and Di Donato, 1999).

   Anthropogenic subsidence is largely due to underground fluid extractions (water and
hydrocarbons), and can exceed natural subsidence by more than one order of magnitude (Carminati
and Di Donato, 1999). There are some tens of thousands water wells on the Emilia-Romagna plain,
the depth ranging from a few metres up to 500 m (Di Dio, 1998; ARPAE, 2008). Groundwater
is mainly used for drinking, as well as industrial and irrigation purposes. Wells for drinking and
industrial use are generally located in urban areas and are characterised by very high withdrawal
rates, while irrigation wells are distributed over the entire plain with generally low withdrawal
rates (Regione Emilia-Romagna, 2015). Groundwater withdrawals have decreased over the last
decades in favour of surface water use, thanks to water resource management aimed at reducing
anthropogenic subsidence (Regione Emilia-Romagna, 2015).

4. Fluids extraction and soil movements

    When groundwater withdrawal exceeds aquifer recharge, the piezometric level is lowered and
fluid pressure in the subsoil decreases. Consequently, sediments are compact and the soil surface
sinks. Land subsidence is mainly due to inelastic compaction and reduction of porosity of fine
sediments present in the subsoil (Terzaghi and Peck, 1967; Galloway et al., 1999). On the contrary,
the increase in the piezometric level, for instance due to a decrease in water withdrawals, causes an
increase in groundwater pressure, which in turn expands the pores of the aquifer skeleton leading to
soil uplift (Galloway et al., 1999).

4
Soil uplift in the Emilia-Romagna plain (Italy)                                      Bull. Geoph. Ocean., XX, XX-XX

   Irreversible land subsidence is due to inelastic deformation of aquitards caused by the
lowering of the piezometric level; a recoverable subsidence is due to elastic and reversible aquifer
deformation caused by an increase in the piezometric level (Fig. 4). Groundwater withdrawal has
been considered the main cause of subsidence that affected, especially in the past, the western
part of the Bologna plain and other sectors of the Emilia-Romagna plain (Teatini et al., 2006;
ARPAE, 2008, 2018a; Bitelli et al., 2010).

Fig. 4 - Irreversible subsidence caused by inelastic deformation (blue arrow) and recoverable subsidence (black ar-
rows) caused by elastic deformation (Galloway et al., 1999, modified).

    Subsidence due to hydrocarbons withdrawal (especially methane in the Po Plain) is linked with
the loss of pressure produced by gas extraction, which causes reservoir compaction. Reservoir
compaction can produce effects up to the surface causing land subsidence (Geerstma, 1973; van
Hasselt, 1992; Gambolati et al., 1999). Production of methane in the Emilia-Romagna region
reached its peak before the 1990s, therefore the regional subsidence maps do not fully describe
its effects. Some current subsidence areas along the Ravenna coast can be partly attributed to
methane withdrawal still on-going today (ARPAE, 2018a; Severi et al., 2021).

5. Map analyses

    Since natural subsidence does not exceed 2-3 mm/yr, areas where subsidence is greater than,
or equal to, 5 mm/yr have been highlighted to identify places where the anthropogenic component
is certainly present (Salvioni, 1957; Arca and Beretta, 1985) (Fig. 5).

                                                                                                                 5
Bull. Geoph. Ocean., XX, XX-XX                                                                                 Severi

Fig. 5 - Areas with subsidence velocity greater than or equal to 5 mm/yr, from maps of Fig. 2.

    While in the first two maps the extent of these areas remains approximately the same, in the third
and fourth map the surfaces affected by anthropogenic subsidence drastically decrease (Table 1).
    At the same time, maximum subsidence rates significantly decrease, and uplift areas increase.
In each of Fig. 2 maps there are uplifting areas; an increase in total uplift surface is observed over
time, which culminates in 2006-2011 (Fig. 6 and Table 1).

Fig. 6 - Uplift areas, with boundaries and names of Emilia-Romagna provinces (see the text for the explanation of the
colours).

6
Soil uplift in the Emilia-Romagna plain (Italy)                                             Bull. Geoph. Ocean., XX, XX-XX

Table 1 - Extension of areas with subsidence and uplift: A = areas with subsidence rates greater than, or equal to, 5 mm/yr
(Fig. 5); B = uplift areas (Fig. 6).

        Areas/Years                1992-2000              2002-2006              2006-2011               2011-2016

          A (km2)                     4,075                 4,244                   1,935                    637

          B (km2)                      978                  1,142                   1,911                   1,525

    Uplift of the plain is observed in four areas of the Emilia-Romagna region. The western plain
area (Piacenza and Parma provinces) shows an uplift pattern from 1992 to 2016 (red ellipse
in Fig. 6), over time the uplift expands to also affect the Reggio Emilia province in 2011-2016.
The widespread uplift of western Emilia-Romagna is well documented by GNNS measurements
in 2001-2013 (Cenni et al., 2013). Previously (1897-1957) an area characterised by land uplift
was documented west of Piacenza city (Arca and Beretta, 1985). It, therefore, appears that the
uplifting area is expanding eastwards over time. The southern part of Reggio Emilia, Modena and
Bologna plain uplifted from 2002 to 2016 (blue ellipse in Fig. 6). The northern part of Modena
and Reggio Emilia plain and the western sector of Ferrara province uplifted during 2006-2016
(green ellipse in Fig. 6). It should be noted that coseismic elevation changes recorded in the
southern Modena area during the 2012 earthquake are removed from the 2011-2016 map, since
mechanism and amplitude [over 20 cm: Bignami et al. (2012) and Pezzo et al. (2013)] of these
uplifts are different from those normally recorded (ARPAE, 2018a). The south-eastern area of
Ferrara province only uplifted during 2006-2011 (brown ellipse in Fig. 6). The uplifted areas in
Emilia-Romagna plain highlighted during the analysed periods are located above buried tectonic
structures considered active or potentially active (Fig. 7): the Emilia folds, the Pede-Apennine
thrust front at Reggio Emilia, Modena and Bologna plain, and in some sectors of the Ferrara folds
(Emilia-Romagna Region, 2017).

Fig. 7 - Uplifted areas during 1992-2016 (green areas) and active or potentially active structures in the Emilia-Romagna
plain (red lines, from Regione Emilia-Romagna, 2017).

                                                                                                                         7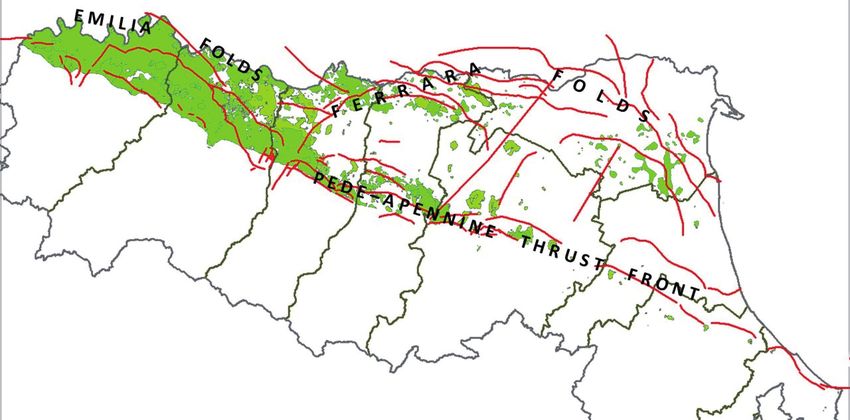
Bull. Geoph. Ocean., XX, XX-XX                                                                                      Severi

    Therefore, the information deduced from the maps shown above seems to indicate that these
tectonic structures produced constant uplifts throughout the 1992-2016 period (the Emilia folds),
or intermittent vertical moments (Ferrara folds, Pede-Apennine thrust front). The uplift in 2006-
2011 in the north part of Modena province and the western part of Ferrara province could indicate
a triggering of the compressive tectonics, which culminated with the 2012 earthquakes. No uplifts
were recorded in tectonic structures in the Romagna portion (Ravenna, Forlì and Rimini plain).
    What is stated above should be considered a first hypothesis. In fact, the variations in velocity
over time that distinguish the uplifted areas and the subsidence areas are very low, and perhaps
further investigations, also with different methodologies, would be needed.

6. The uplifts in the Bologna plain

    The 2011-2016 map indicates uplifted areas in some sectors of the Bologna plain (Fig. 6). Uplifts
were previously observed (Severi et al., 2009, 2010) in some areas of the Reno River alluvial fan
(Fig. 8), which in recent decades has been affected by strong subsidence, recording the highest
subsidence values in the Emilia-Romagna region (Fig. 2). The Reno River alluvial fan is one of the
largest in Emilia-Romagna, and consists of an alternation of coarse gravels passing undercurrent
to sand and fine clay and silt deposits, for a thickness of several hundred metres (Severi et al.,
2009; Severi and Bonzi, 2015). Gravel thickness is maximum at the end of the valley (section L10 in
Fig. 8), and decreases laterally to it (sections L7 and L15 in Fig. 10). Drinking water withdrawal for
the Bologna metropolitan area is concentrated in the Reno River alluvial fan aquifer.
    The most marked decrease of land subsidence rates and the most significant ground
uplifts were observed in areas where fine sediments prevail (sections L7 and L15 in Fig. 8).

Fig. 8 - Reno River alluvial fan (amalgamated with the minor alluvial fans of the Samoggia, Lavino, and Savena rivers), up-
lifted areas in 2011-2016, main water well fields, extensometers and geological sections (as reported in https://ambiente.
regione.emilia-romagna.it/it/geologia/cartografia/webgis-banchedati/sezioni-geologiche-prove-geognostiche-pianura).

8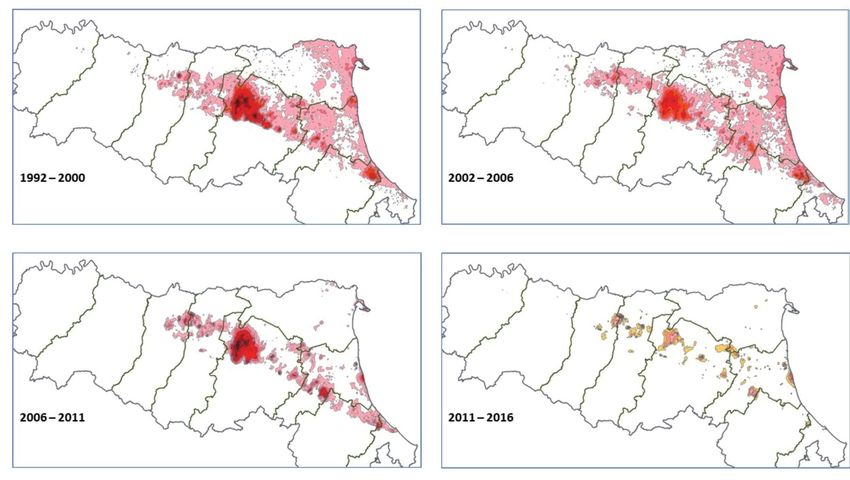
Soil uplift in the Emilia-Romagna plain (Italy)                                     Bull. Geoph. Ocean., XX, XX-XX

   The reversed ground movement trend observed in this area is quite surprising, and is shown
well by the comparison between 2006-2011 and 2011-2016 subsidence maps. The Bologna area
recorded a very strong slowdown in subsidence velocity (Fig. 9), with peaks of decrease of 30
mm/yr (Bitelli et al., 2020).

Fig. 9 - Variation in vertical ground movement rate from 2006-2011 to 2011-2016 (ARPAE, 2018a).

   The sharp land subsidence decrease and the presence of areas characterised by land uplift
were accompanied by a widespread recovery of the piezometric level in the Reno alluvial fan,
as highlighted by the regional groundwater monitoring network (ARPAE, 2018b). Over the last
few decades, total groundwater withdrawal (drinking, industrial and irrigation use) significantly
decreased from over 90 million m3/yr in 1976 to less than 50 million m3/yr at the end of 2010.
The decrease mainly concerned drinking water withdrawal, which accounts for most of the total,
and was largely due to surface water use (from the Setta stream, a tributary of the Reno River)
instead of groundwater. This decrease (Fig. 10) clearly influenced the trend of subsidence in the
Bologna plain (ARPAE, 2018a).
   The largest decrease in groundwater pumping rates occurred over the period 1972-2000, but
slowed in 2000-2011, and increased again in 2011 to 2016. The subsidence velocity trend shows
a very similar pattern, highlighting an evident correlation between groundwater withdrawal and
ground displacements. Thus, the aquifer exploitation can be realistically considered a significant
factor causing the soil subsidence (Fig. 10a).
   The sharp reduction of groundwater withdrawal during 2010 (Fig. 10b), related to the
increase in the use of surface water, resulted in an evident recovery of the groundwater levels
that is clearly visible in the regional groundwater network (Fig. 11). It should be noted that a
previous reduction of the pumping rates (between 1976 and 2000) did not cause any increase in
piezometry. This probably means that only from 2011 the amount of withdrawal become smaller
than the aquifer recharge, favouring the rise of the groundwater levels.

                                                                                                                9
Bull. Geoph. Ocean., XX, XX-XX                                                                                  Severi

Fig. 10 - Trend of groundwater withdrawals in the Reno alluvial fan and simultaneous decrease in subsidence (a). Dif-
ferent components of groundwater withdrawal (b) (ARPAE, 2018a, modified).

Fig. 11 - Piezometer levels versus time in three representative monitoring wells of regional groundwater network (data
in https://www.arpae.it/elenchi_dinamici.asp?tipo=dati_acqua&idlivello=2020).

10
Soil uplift in the Emilia-Romagna plain (Italy)                                            Bull. Geoph. Ocean., XX, XX-XX

  The general rise in piezometric levels in the Bologna plain has also formed a lake in a sunken
quarry area immediately west of Bologna (Fig. 12).

Fig. 12 - Piezometric level rise in the Reno alluvial fan has caused flooding of a former quarry in a sunken area, creating
a lake (note that in 2007 the sunken area contained no water).

7. Relationship between piezometry and soil deformation in Castel Maggiore
   (Bologna province)

    The rise of the groundwater level in the Bologna area was also recorded in a continuous
piezometry monitoring point in Castel Maggiore, a municipality immediately north of
Bologna (underlined in Fig. 13) and one of the formerly most subsident areas in Emilia-
Romagna. A 60-m deep piezometer (Fig. 13) was positioned in the first confined aquifer A1
(Di Dio, 1998) and is located near two 100- and 200-m deep extensometers (Bonsignore et
al., 2010; ARPAE, 2018a). Monitoring started in spring 2005 (extensometers) and autumn
2007 (piezometer).
    The recorded piezometric level shows an evident sinusoidal trend with seasonal
frequency, characterised by lowering in summer-autumn and uplift in winter-spring,
consistent with the recharge and withdrawal regime (purple arrows in Fig. 14). Furthermore,
some minor daily oscillations, due to water well withdrawal near the piezometer are
recorded (orange circle in Fig. 14). The 100-m deep extensometer, which intercepts the
same portion of the sedimentary sequence as the piezometer (Fig. 13), records a similar
sinusoidal trend in phase with the groundwater level, with subsidence in summer-autumn
and uplift in winter-spring (brown arrows in Fig. 14). The extensometer records some
small daily variations, just like those of the piezometer (grey circle in Fig. 14). There is a
clear and immediate relationship between the seasonal trend of the groundwater level
and soil deformation: when the piezometric level decreases the deposits compact, and
when the level rises the soil expands (Galloway et al., 1999).

                                                                                                                       11
Bull. Geoph. Ocean., XX, XX-XX Severi Fig. 13 - Detailed geological section (above) and piezometer and extensometers locations (below). Legend as in Fig. 8 (ARPAE, 2018a, modified). 12
Soil uplift in the Emilia-Romagna plain (Italy)                                            Bull. Geoph. Ocean., XX, XX-XX

Fig. 14 - Piezometric level (green line) and soil movements (red line). Dashed black and blue lines indicate overall trend,
purple and brown arrows seasonality variations, orange and grey circles daily variations (ARPAE, 2018a, modified).

    While the amplitude of seasonal piezometric variations is rather variable, the positive and
negative seasonal variations recorded by the extensometer are very regular, with an amplitude
of about 15 mm. Although the two phenomena are temporally correlated, they do not have
a direct proportionality, that is, the amount of soil deformation is not strictly proportional to
the piezometric variations. In fact, seasonal soil deformation also depends on other factors,
such as soil humidity and the piezometric behaviour within the other aquifers here monitored.
Beyond seasonal fluctuations, similarly to what has been observed in other places in Bologna
plain (Fig. 11), the piezometric level rose over time (about 6 m in 9 years, from October 2007 to
June 2016, dashed black line in Fig. 14). This increase is likely related to the overall decrease in
groundwater withdrawal rates from the Reno aquifer (Fig. 10). The pressure recovery occurred
in two distinct phases, interrupted by a period in which the piezometry decreased (Fig. 14).
The level rises from spring 2008 to spring 2011, and in this period the subsidence rate slows
down to zero. The level decreases from spring 2001 to August 2012, and at the same time
subsidence began to increase again. The level, then, rises from August 2012 to May 2014, and
at the same time the ground expands. The level rises (less quickly than before) from May 2014
to July 2016 and the ground is essentially stable. The level decreases from July 2016 to the end
of the monitoring (January 2018) and subsidence increases. A clear relationship is, therefore,
observed between the piezometric level trend and the soil deformation (black and blue dashed
lines in Fig. 14). As already observed for seasonal oscillations, the piezometric level elevation
is simultaneous with the slowing down and zeroing of subsidence and to ground uplift. It is,
therefore, likely that the general increase in the piezometric level starting from 2010 is causing
the topographical rises highlighted in the Bologna plain in the 2011-2016 map (Figs. 6 and 9).
The uplift of Bologna plain would seem to have, at least in part, a man-induced cause because

                                                                                                                       13
Bull. Geoph. Ocean., XX, XX-XX Severi
of the reduction of groundwater withdrawal. This raising of the Bologna plain has, therefore,
an anthropogenic cause, different from those described above (see Fig. 7) whose origin is of
tectonic nature.
8. Conclusions
InSAR-based measurements are available from 1992 to 2016 in the Emilia-Romagna plain
(about 13,000 km2). The data set, once properly processed and calibrated with precision
topographic levelling and GNSS, represent significant and good information to analyse ground
movements. Four maps of the average rate of land displacement over the periods 1992-2000,
2002-2006, 2006-2011, and 2011-2016 have allowed making some interesting considerations
on positive ground vertical movements (i.e. uplifts) and their nature. Some areas are constantly
rising from 1992 to 2016 (Piacenza and Parma plain), while others show intermittent uplift
(Reggio Emilia, Modena, Ferrara and Bologna plain). Most of the observed uplifts are due to
tectonics, with the uplifts recorded above active structures present in subsoil, such as portions of
the Emilian folds, of the Ferrara folds, and of the Pede-Apennine Thrust front. The uplift recorded
in the north-western part of the Ferrara fold, in 2006-2011 could indicate the triggering of the
compressive tectonics, which, then, culminated with the May 2012 earthquakes. There are no
documented uplifts in the Romagna part of the plain.
The uplift observed in the Bologna plain (NW of Bologna city) can instead be considered man-
induced, owing to a significant recovery of piezometric levels due to a reduction in groundwater
withdrawals.
Since these statements derive exclusively from INSAR data, they should be considered a first
hypothesis that could be verified with different methodologies and approaches.
Acknowledgements. This paper was presented by the author at the meeting “Strutture geologiche profon-
de e superficiali dell’Appennino Settentrionale: dal contesto sismo-tettonico alla geologia strutturale ed alle
loro possibili applicazioni”, Bologna, 10 June 2019. A special thank goes to Giuseppe Pezzo (INGV) and to an
anonymous reviewer for their careful revision of the manuscript.
REFERENCES
Antoncecchi I., Ciccone F., Rossi G., Agate G., Colucci F., Moia F., Manzo M., Lanari R., Bonano M., De Luca
C., Calabrese L., Perini L., Severi P., Pezzo G., Macini P., Benetatos C., Rocca V., Carminati E., Billi A. and
Petracchini L.; 2021: Soil deformation analysis through fluid-dynamic modelling and DInSAR measurements:
a focus on groundwater withdrawal in the Ravenna area (Italy). Boll. Geof. Teor. Appl., 62, 301-316, doi:
10.4430/bgta0350.
Arca S. and Beretta G.P.; 1985: Prima sintesi geodetica-geologica sui movimenti verticali del suolo nell’Italia
Settentrionale. Boll. Geod. Sci. Affini, 44, 125-156.
ARPAE (Agenzia Prevenzione Ambientale Energia Emilia-Romagna); 2007: Rilievo della subsidenza nella pianura
emiliano-romagnola. Analisi interferometrica anno: 2007. .
ARPAE (Agenzia Prevenzione Ambientale Energia Emilia-Romagna); 2008: Analisi preliminare degli effetti dei
prelievi di acque sotterranee sulla evoluzione recente del fenomeno della subsidenza in Emilia-Romagna
anno: 2008. .
ARPAE (Agenzia Prevenzione Ambientale Energia Emilia-Romagna); 2012: Rilievo della subsidenza nella pianura
emiliano-romagnola - seconda fase anno: 2012. .
14Soil uplift in the Emilia-Romagna plain (Italy) Bull. Geoph. Ocean., XX, XX-XX
ARPAE (Agenzia Prevenzione Ambientale Energia Emilia-Romagna); 2018a: Rilievo della subsidenza nella
pianura emiliano-romagnola - seconda fase, Bologna, 2018. .
ARPAE (Agenzia Prevenzione Ambientale Energia Emilia-Romagna); 2018b: Valutazione dello stato delle acque
sotterranee 2014 - 2016. .
Bignami C., Burrato P., Cannelli V., Chini M., Falcucci E., Ferretti A., Gori S., Kyriakopoulos C., Melini D., Moro
M., Novali F., Saroli M., Stramondo S., Valensise G. and Vannoli P.; 2012: Coseismic deformation pattern of
the Emilia 2012 seismic sequence imaged by Radarsat-1 interferometry. Ann. Geophys., 55, 789-795, doi:
10.4401/ag-6157.
Bissoli R., Bitelli G., Bonsignore F., Rapino A. and Vittuari L.; 2010: Land subsidence in Emilia-Romagna Region,
northern Italy: recent results. Proc. Int. Assoc. Hydrol. Sci., 339, 307-311.
Bitelli G., Bonsignore F. and Unguendoli M.; 2000: Levelling and GPS networks for ground subsidence monitoring
in the southern Po Valley. J. Geodyn., 30, 355-369, doi: 10.1016/S0264-3707(99)00071-X.
Bitelli G., Bonsignore F., Del Conte S., Novali F., Pellegrino I. and Vittuari L.; 2014: Integrated use of advanced
InSAR and GPS data for subsidence monitoring. In: Lollino G., Manconi A., Guzzetti F., Culshaw M., Bobrowsky
P.T. and Luino F. (eds), Engineering Geology for Society and Territory, Springer, Berlin, Germany, Vol. 5, pp.
147-150, doi: 10.1007/978-3-319-09048-1_29.
Bitelli G., Bonsignore F., Pellegrino I. and Vittuari L.; 2015: Evolution of the techniques for subsidence monitoring
at regional scale: the case of Emilia-Romagna Region (Italy). Proc. Int. Assoc. Hydrol. Sci., 372, 315-321, doi:
10.5194/piahs-372-315-2015.
Bitelli G., Bonsignore F., Del Conte S., Franci F., Lambertini A., Novali F., Severi P. and Vittuari L.; 2020:
Updating the subsidence map of Emilia-Romagna Region (Italy) by integration of SAR interferometry
and GNSS time series: the 2011-2016 period. Proc. Int. Assoc. Hydrol. Sci., 382, 39-44, doi: 10.5194/
piahs-382-39-2020.
Bonsignore F., Bitelli G., Chahoud A., Macini P., Mesini E., Severi P., Villani B. and Vittuari L.; 2010: Recent extensometric
data for the monitoring of subsidence in Bologna (Italy). Proc. Int. Assoc. Hydrol. Sci., 339, 333-338.
Calabrese L., Luciani P. and Perini L.; 2021: A review of impact of subsidence induced by gas exploitation on costal
erosion in Emilia-Romagna, Italy. Boll. Geof. Teor. Appl., 62, 279-300, doi: 10.4430/bgta0356.
Carminati E. and Di Donato G.; 1999: Separating natural and anthropogenic vertical movements in fast subsiding
areas: the Po plain (N. Italy) case. Geophys. Res. Lett., 26, 2291- 2294.
Carminati E., Doglioni C. and Scrocca D.; 2003: Apennines subduction-related subsidence of Venice (Italy).
Geophys. Res. Lett., 30, 1717, doi:10.1029/2003GL017001.
Cenni N., Viti M., Baldi P., Mantovani E., Bacchetti M. and Vannucchi A.; 2013: Present vertical movements in central
and northern Italy from GPS data: possible role of natural and anthropogenic causes. J. Geodyn., 71, 74-85.
Di Dio G. (a cura di); 1998: Riserve idriche sotterranee della Regione Emilia-Romagna, scala 1:250.000. Regione
Emilia-Romagna, Ambiente, Geologia, Sismica e Suoli and ENI-AGIP, Bologna, Italy, 119 pp.
Ferretti A., Prati C. and Rocca F.; 2001: Permanent scatterers in SAR interferometry. IEEE Trans. Geosci. Remote
Sens., 39, 8-20, doi: 10.1109/36.898661.
Galloway D.L., Jones D.R. and Ingebritsen S.E.; 1999: Land subsidence in the United States. U.S. Geological
Survey, Circular 1182, 185 pp., doi: 10.3133/cir1182, .
Gambolati G., Teatini P. and Tomasi L.; 1999: Stress-strain analysis in productive gas/oil reservoirs. Int. J. Numer.
Anal. Methods Geomech., 23, 1495-1519.
Gambolati G., Teatini P. and Ferronato M.; 2005: Anthropogenic land subsidence. In: Anderson M.G. (ed),
Encyclopedia of Hydrological Sciences, John Wiley & Sons Ltd., Chichester, UK, Vol. IV, Chap. 158, pp. 2444-
2459, doi: 10.1002/0470848944.hsa164b.
Geerstma J.; 1973: Land subsidence above compacting oil and gas reservoirs. J. Pet. Technol., 25, 734-744.
Ori G.G.; 1993: Continental depositional systems of the Quaternary of the Po Plain (northern Italy). Sediment.
Geol., 83, 1-14, doi: 10.1016/S0037-0738(10)80001-6.
Pezzo G., Merryman Boncori J.P., Tolomei C., Salvi S., Atzori S., Antonioli A., Trasatti E., Novali F., Serpelloni
E., Candela L. and Giuliani R.; 2013: Coseismic deformation and source modeling of the May 2012 Emilia
(northern Italy). Seismol. Res. Lett., 84, 645-655, doi: 10.1785/0220120171.
15Bull. Geoph. Ocean., XX, XX-XX Severi
Regione Emilia-Romagna; 2015: DGR 1781/2015 - Aggiornamento del quadro conoscitivo di riferimento (carichi
inquinanti, bilanci idrici e stato delle acque) ai fini del riesame dei Piani di Gestione Distrettuali 2015-2021.
Regione Emilia-Romagna, Ambiente, Acque, Bologna, Italy, Allegato 2 - Bilanci idrici, 112 pp., .
Regione Emilia-Romagna; 2017: Carta Sismotettonica della Regione Emilia-Romagna e aree limitrofe (2016).
Regione Emilia-Romagna, Geologia, Sismica e Suoli, Bologna, Italy, 93 pp.
Salvioni G.; 1957: I movimenti del suolo nell’Italia centro - settentrionale. Boll. Geod. Sci. Affini, 16, 325-366.
Severi P. and Bonzi L.; 2015: Gli acquiferi della pianura emiliano-romagnola. In: Farina M., Marcaccio M. and
Zavatti A. (a cura di), Esperienze e prospettive nel monitoraggio delle acque sotterranee. Il contributo
dell’Emilia-Romagna, Pitagora Editrice, Bologna, Italy, pp. 19-34, doi: 10.13140/RG.2.1.3927.2725.
Severi P., Martelli L., Caporale L., Benini A. and De Nardo M.T. (a cura di); 2009: Note illustrative della Carta
Geologica d’Italia, foglio 220, Casalecchio di Reno. ISPRA, Servizio Geologico d’Italia - Regione Emilia-
Romagna, Servizio Geologico, Sismico e dei Suoli, Bologna, Italy, 123 pp.
Severi P., Martelli L., Amososi A. and Cazzoli M.A.; 2010: Note illustrative della Carta Geologica d’Italia, foglio
221, Bologna. ISPRA, Servizio Geologico d’Italia - Regione Emilia-Romagna, Servizio Geologico, Sismico e dei
Suoli, Bologna, Italy, 107 pp.
Severi P., Mazzoni R. and Martelli L.; 2021: Oil and gas activities in Emilia-Romagna Region (Italy): land
deformation and territory protection. Boll. Geof. Teor. Appl., 62, 269-278, doi: 10.4430/bgta0327.
Strozzi T., Wegmüller U., Tosi L., Bitelli G. and Spreckels V.; 2001: Land subsidence monitoring with differential
SAR interferometry. Amer. Soc. Photogramm. Remote Sens., 67, 1261-1270.
Teatini P., Ferronato M., Gambolati G. and Gonella M.; 2006: Groundwater pumping and land subsidence in the
Emilia-Romagna coastland, Italy: modeling the past occurrence and the future trend. Water Resour. Res., 42,
W01406, doi: 10.1029/2005WR004242.
Teatini P., Tosi L. and Strozzi T.; 2011: Quantitative evidence that compaction of Holocene sediments drives the
present land subsidence of the Po Delta, Italy. J. Geophys. Res., 116, B08407, doi: 10.1029/2010JB008122.
Terzaghi K. and Peck R.B.; 1967: Soil mechanics in engineering practice, 2nd ed. John Wiley & Sons Ltd., New
York, NY, USA, 729 pp.
van Hasselt J.P.; 1992: Reservoir compaction and surface subsidence resulting from oil and gas production. Geol.
Mijnbouw, 71, 107-118.
Corresponding author: Paolo Severi
Servizio Geologico, Sismico e dei Suoli, Regione Emilia-Romagna
Via della Fiera 8, 40127 Bologna, Italy
Phone: + 39 347 9040701; fax +39 051 5274208; e-mail: paolo.severi@regione.emilia-romagna.it
16You can also read