Socioeconomic Disparities in Social Distancing During the COVID-19 Pandemic in the United States: Observational Study
←
→
Page content transcription
If your browser does not render page correctly, please read the page content below
JOURNAL OF MEDICAL INTERNET RESEARCH                                                                                                        Garnier et al

     Original Paper

     Socioeconomic Disparities in Social Distancing During the
     COVID-19 Pandemic in the United States: Observational Study

     Romain Garnier1, PhD, DVM; Jan R Benetka2, MS; John Kraemer3, MPH, JD; Shweta Bansal1, PhD
     1
      Department of Biology, Georgetown University, Washington, DC, United States
     2
      Unacast, Oslo, Norway
     3
      Department of Health Systems Administration, Georgetown University, Washington, DC, United States

     Corresponding Author:
     Shweta Bansal, PhD
     Department of Biology
     Georgetown University
     Reiss Science Building
     37th and O Streets
     Washington, DC, 20057
     United States
     Phone: 1 2026879256
     Email: sb753@georgetown.edu

     Abstract
     Background: Eliminating disparities in the burden of COVID-19 requires equitable access to control measures across
     socio-economic groups. Limited research on socio-economic differences in mobility hampers our ability to understand whether
     inequalities in social distancing are occurring during the SARS-CoV-2 pandemic.
     Objective: We aimed to assess how mobility patterns have varied across the United States during the COVID-19 pandemic and
     to identify associations with socioeconomic factors of populations.
     Methods: We used anonymized mobility data from tens of millions of devices to measure the speed and depth of social distancing
     at the county level in the United States between February and May 2020, the period during which social distancing was widespread
     in this country. Using linear mixed models, we assessed the associations between social distancing and socioeconomic variables,
     including the proportion of people in the population below the poverty level, the proportion of Black people, the proportion of
     essential workers, and the population density.
     Results: We found that the speed, depth, and duration of social distancing in the United States are heterogeneous. We particularly
     show that social distancing is slower and less intense in counties with higher proportions of people below the poverty level and
     essential workers; in contrast, we show that social distancing is intensely adopted in counties with higher population densities
     and larger Black populations.
     Conclusions: Socioeconomic inequalities appear to be associated with the levels of adoption of social distancing, potentially
     resulting in wide-ranging differences in the impact of the COVID-19 pandemic in communities across the United States. These
     inequalities are likely to amplify existing health disparities and must be addressed to ensure the success of ongoing pandemic
     mitigation efforts.

     (J Med Internet Res 2021;23(1):e24591) doi: 10.2196/24591

     KEYWORDS
     COVID-19; SARS-CoV-2; disease ecology; nonpharmaceutical interventions; mobility data; economic; disparity; social distancing;
     equity; access; socioeconomic; infectious disease; mobility

                                                                             the lack of nationwide syndromic surveillance capabilities [2],
     Introduction                                                            nonpharmaceutical interventions represent the only immediate
     Treatment options and vaccines are being developed to address           tools public health agencies can use to limit the size and spatial
     the COVID-19 pandemic [1]. However, while the ability to                scale of the outbreak [3]. In the United States, state and local
     detect new infections remains limited by testing capacity and           governments are primarily responsible for measures such as

     http://www.jmir.org/2021/1/e24591/                                                                   J Med Internet Res 2021 | vol. 23 | iss. 1 | e24591 | p. 1
                                                                                                                        (page number not for citation purposes)
XSL• FO
RenderX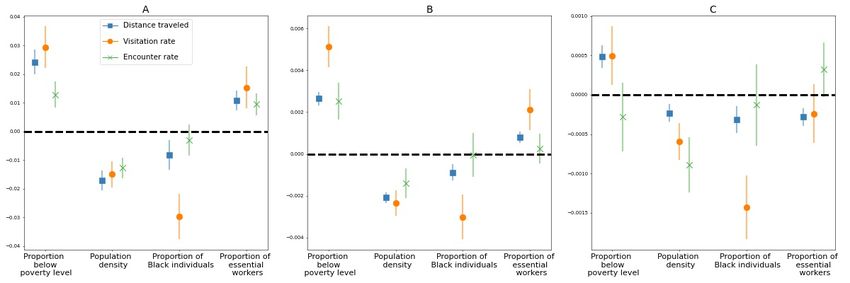
JOURNAL OF MEDICAL INTERNET RESEARCH                                                                                                 Garnier et al

     school or business closures [4]. Historically, similar measures
     have been used to respond to pandemics, including during
                                                                          Methods
     plague outbreaks in the Middle Ages [5] and during the 1918          To measure mobility, we obtained daily county-specific mobility
     Spanish influenza pandemic [6]. Data collected during the early      data for the United States from February 24 to May 14,
     part of the ongoing COVID-19 pandemic, in particular on the          2020—the period during which most of the United States was
     dynamics of the outbreak in China, indicate that                     simultaneously engaged in social distancing—through a
     nonpharmaceutical interventions can be successful in limiting        partnership with Unacast [23]. The data set is based on the GPS
     the size of COVID-19 outbreaks [7] and in delaying large-scale       location data collected from applications installed on tens of
     spread [3].                                                          millions of devices, and it complies with the General Data
     However, social distancing may be adopted differently across         Protection Regulation and the California Consumer Privacy Act
     communities, especially in the United States, where workers in       [24]. The data set was shown to be representative by
     sectors such as transportation and food retail receive lower         geographical location, income level, sex, and age in an analysis
     wages and represent a larger fraction of workers deemed              conducted by Unacast [25]. The fraction of all devices observed
     essential than those in other sectors of the workforce [8,9].        varies by location and time, and this has been captured in our
     Assessing this differential impact requires the use of fine-scale    analysis (details below).
     mobility data, a stream of information that has proven useful        As outcome measures, we considered data on the changes in
     in the early assessment of social distancing measures in the         three measures of mobility provided by Unacast: daily distance
     United States [10], Italy [11], and France [12]. Digital             traveled (hereafter, “distance traveled”), rate of visitation to
     technologies have taken center stage in the response to              nonessential places (hereafter, “visitation rate”), and rate of
     COVID-19 [13], and mobility data in particular have enabled          encounters between devices within a 50-meter radius within an
     assessment of the responses to nonpharmaceutical interventions       hour (hereafter, “encounter rate”). Distance traveled reflects the
     [14,15]. Previous studies report large-scale reductions in           average distance between the home locations of users and
     movement, with numbers quickly reaching values typically             locations visited in 1 day. Visitation rate reflects the number of
     observed during holiday periods [10]. Furthermore, in the United     visits to nonessential locations; the definition of nonessential
     States, changes in mobility were associated with reductions in       venues is based on state-specific guidelines and policies and
     COVID-19 cases [16,17] and in the reproduction number of the         includes all locations other than those deemed essential (eg,
     disease [18], and mobility data also revealed that these changes     food stores, pet stores, and pharmacies; more information can
     were largely already underway when state or county                   be found on Unacast’s website [26]). Encounter rate measures
     stay-at-home orders were issued [16,19,20]. Previous studies         the likelihood of proximity between any two users within 50
     using mobility data have also suggested potential inequalities       meters over a one hour period. Each change is calculated relative
     in the ability to practice social distancing based on income [21],   to a county-specific baseline calculated from values obtained
     race and education [20], or the availability of health care          during a period of several weeks prior to the onset of major
     providers [22]. However, most of these studies consider these        COVID-19–related changes in mobility in the United States
     determinants in isolation and do not allow to disentangle the        (February 10 to March 4, 2020 for distance traveled and
     potential additive effects of the socio-economic make-up of          visitation rate; February 24 to March 4, 2020 for encounter rate).
     counties on the ability of their populations to practice social      The resulting data set covers 3054 counties for the distance
     distancing. These studies have also largely focused on               traveled and encounter rate and 2067 counties for the visitation
     understanding how social distancing was influenced by local          rate. The county-level data on each measure described above
     or regional decisions and whether socioeconomic factors              can be accessed by contacting Unacast [23], and our
     changed the responses to state and local interventions.              model-processed data and the code used for the statistical
     Here, we focus on an ecological understanding of how mobility        analysis are available on GitHub [27].
     varies with socioeconomic characteristics rather than assessing      To summarize the mobility time series, using the `fbprophet`
     what drives these changes. As outlined above, multiple studies       package [28], we first fit a nonlinear model to the county-level
     have aimed to understand the causes of mobility behavior             social distancing time series, including a weekly trend to account
     changes. However, we seek to understand how the patterns of          for workweek variation. This package fits a piecewise regression
     mobility vary across socioeconomic characteristics (regardless       while allowing setting the number of potential changepoints,
     of the cause) during different stages of the pandemic response.      and makes it possible to assess where breaks in the trend occur
     In particular, we ask how quickly, how deeply, and for how           over the course of the social distancing time series. Most
     long mobility changes occurred in locations according to their       counties follow a dynamic similar to that of the mobility
     socioeconomic characteristics. Our approach does not seek to         measures aggregated at the country level (Figure 1). In short,
     differentiate between spontaneous changes in mobility, such as       the underlying trend can be separated into four phases (ie, four
     in response to news coverage, or changes in response to state-       breaks in the trend): phase 1, the baseline period; phase 2, the
     or county-mandated orders. Rather, we focus on the resulting         period of entry into social distancing, measured by the rate of
     changes in mobility and how these differ by location and             mobility decrease; phase 3, the social distancing period,
     socioeconomic status.                                                described by a sustained reduction in mobility outcomes; and
                                                                          phase 4, the period of exit from the social distancing phase,
                                                                          measured by the rate of mobility increase after sustained social
                                                                          distancing. This dynamic is specific to 2020; these four phases

     http://www.jmir.org/2021/1/e24591/                                                            J Med Internet Res 2021 | vol. 23 | iss. 1 | e24591 | p. 2
                                                                                                                 (page number not for citation purposes)
XSL• FO
RenderX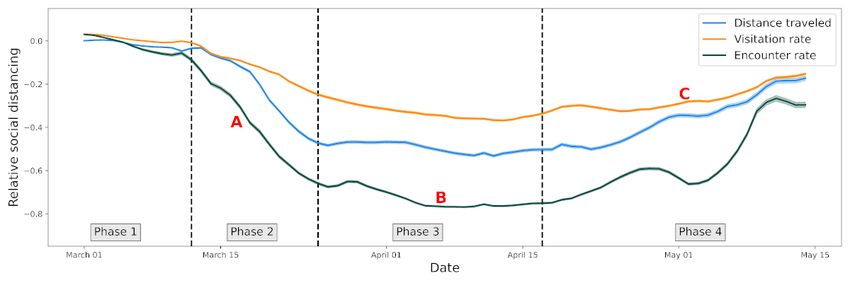
JOURNAL OF MEDICAL INTERNET RESEARCH Garnier et al
are not evident in 2019 (Figure S1 in Multimedia Appendix 1). series was thus summarized by 3 values (or 2 values for the
From these model fits, we extracted several values that enabled counties with no detectable phase 4 increase), which were used
us to characterize the changes in mobility during entry into and in the statistical analysis. We do not distinguish whether these
exit from the social distancing phase, as well as the mobility changes are spontaneous in response to the COVID-19 pandemic
level during the period of sustained mobility reduction (see or occur in response to public health policies; we only define
Figure 1 for details). Counties with no detectable increase in the phases based on changes in mobility rates. That is, we do
mobility after sustained social distancing (ie, where the slope not seek to explain why the mobility changed but rather how it
of the trend at the end of the time series remains nonpositive) changed.
were not included in the phase 4 analysis. Each county time
Figure 1. Time series of three mobility measures aggregated at the country level. We show a 7-day rolling mean of distance traveled (blue), visitation
rate (orange), and encounters rate (green), with the solid line representing the mean and the shaded area two standard errors of the mean. The 4 phases
in the mobility time series are delimited by dashed vertical lines in the figure and were generated from the model fit in each county independently. These
phases allow us to calculate three summary measures for each time series: the slope of decline in phase 2 (A), the mean level of mobility during social
distancing (B), and the slope of increase in mobility during exit from social distancing (C).
Our exposures of interest relate to the socioeconomic distancing summary measures. We also performed a post hoc
composition of each area: racial composition, population density, secondary analysis in which interaction terms between covariates
proportion living below the poverty level, and proportion of the were added to elucidate findings from the main analysis. Finally,
workforce in industries designated as essential. Thus, our as a sensitivity analysis, we fit an alternative linear model with
exposures of interest are area-level features, not individual state as a fixed effect rather than a random effect to adjust for
features. We obtained information on racial composition and any additional unmeasured state-level features. All analyses
population density from the 2018 American Community Survey were conducted in Python 3.6.
[29] and on the proportion of people below the poverty level
The research presented in this paper was approved by the
from the Small Area Income and Poverty Estimate program
Georgetown-Medstar Institutional Review Board (study id
[30]. We estimated the proportion of workers in industries
STUDY00003041).
designated as essential [31] from the Quarterly Census on
Employment and Wages for the fourth quarter of 2019 [32].
Results
We also adjusted for the fractions of devices observed in each
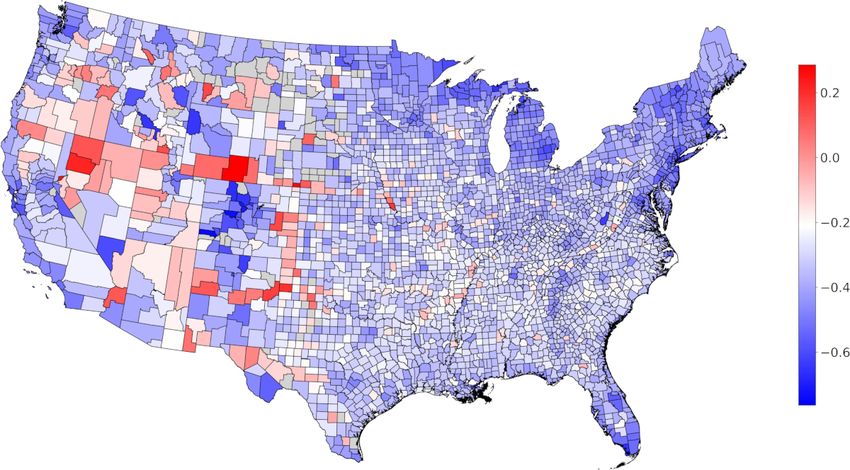
county because sampling of mobile devices tends to vary Social distancing is heterogeneous at the county level (Figure
geographically and over time. 2). In counties with a higher proportion of people in poverty,
social distancing was weaker: mobility was less restricted during
We ran linear mixed models to analyze the associations between the period of sustained mobility reduction, and the change
the social distancing summary values and the socioeconomic occurred more slowly during the period of entry into social
variables with state as a random effect using the standard 0.05 distancing for all three measures of mobility. Additionally, the
significance threshold. In the main analysis, we investigated resurgence in mobility was faster during the period of exit from
independent associations with each covariate, and the resulting sustained reductions in mobility for 2 of 3 measures of mobility
linear mixed model is of the form: (Figure 3). Counties with higher proportions of essential workers
Y = Xiβi + Zμ + ε saw weaker social distancing adoption for all mobility markers
during the period of sustained mobility reduction and a slower
In our case, the response variable Y is one of the social entry into social distancing based on two mobility markers. The
distancing summary measures (the slope in phase 2, mean value rate of exit from the social distancing phase is less predicted by
in phase 3, or slope in phase 4). The socioeconomic predictors the proportion of essential workers. Contrastingly, in counties
are included as the fixed effects Xi and the state as the random with a larger proportion of Black individuals or a higher
effect Z. The ε term captures the residuals. We ran independent population density, social distancing is stronger, with a faster
models for each of the mobility measures (distance traveled, entry into social distancing, lower mobility levels during the
visitation rate, and encounter rate) and for each of the social period of sustained mobility reduction, and a slower resurgence
http://www.jmir.org/2021/1/e24591/ J Med Internet Res 2021 | vol. 23 | iss. 1 | e24591 | p. 3
(page number not for citation purposes)
XSL• FO
RenderXJOURNAL OF MEDICAL INTERNET RESEARCH Garnier et al
during the period of exit from the social distancing phase (Figure variables follow the same qualitative and quantitative patterns
3). The results were not significant for the encounter rate for (Table S2, Multimedia Appendix 1). We found a significant
the proportion of Black individuals in the population. Full positive interaction between the proportion of essential workers
statistical details are provided in Table S1 (Multimedia and the Black population, and we found a negative interaction
Appendix 1). between essential workers and low-income workers. The
interaction between the proportions of Black people and
When interaction effects are added to the model of distance
low-income workers is not significantly associated with
traveled in the period of entry into mobility reductions, all
mobility.
Figure 2. Heterogeneity in mobility during social distancing. The map shows the average mobility during social distancing due to COVID-19 at the
county level in the continental United States relative to the pre–COVID-19 baseline. A positive value indicates an increase in distance traveled, and a
negative value indicates a decrease in distance traveled. Counties for which data are not available are shown in grey. The color map is centered at the
90% percentile of the decrease in mobility.
Figure 3. Regression coefficients of distance traveled, visitation rate, and encounter rate for the 4 socioeconomic factors associated with social distancing:
(A) mobility during social distancing (phase 3); (B) decline in mobility during entry to the social distancing phase (phase 2); and (C) resurgence in
mobility during exit from the social distancing phase (phase 4). The marker denotes the mean coefficient, and the error bars show the 95% confidence
interval. A positive association (above the dashed line) indicates that an increase in a given factor leads to a weaker implementation of social distancing.
A negative association (below the dashed line) indicates that an increase in the given factor is associated with a stronger implementation of social
distancing measures.
Substituting the random effect state with a fixed effect yielded phase and the proportion of low-income workers became
very similar results. There were only three differences of note: nonsignificant, while the associations between the resurgence
the association between the mobility resurgence measure as the in encounter rate in the period of exit from the social distancing
visitation rate in the period of exit from the social distancing
http://www.jmir.org/2021/1/e24591/ J Med Internet Res 2021 | vol. 23 | iss. 1 | e24591 | p. 4
(page number not for citation purposes)
XSL• FO
RenderXJOURNAL OF MEDICAL INTERNET RESEARCH Garnier et al
phase and the proportions of essential and of low-wage workers suffer from poorer health outcomes than their more urban
became significant. counterparts [36].
Importantly, we also found that counties with larger Black
Discussion populations showed stronger adherence to social distancing
The COVID-19 pandemic has highlighted significant health measures during all phases, after controlling for the effects of
disparities in the United States, similar to the health inequities income, occupation, and density. Our finding is supported by
driven by income inequality and racial injustice that previously more local observations of differences between predominantly
existed in the country [33]. Understanding the role of behavioral Black and White neighborhoods, such as Detroit [37]. We also
interventions in driving variations in the COVID-19 burden is found that social distancing remains more limited in populations
crucial to our current and future outbreak response. Our study that combine high proportions of Black individuals with high
shows that changes in interaction in response to the pandemic proportions of essential workers, possibly because minorities
are geographically heterogeneous and are associated with may be overrepresented in certain essential occupations [8].
county-level socioeconomic factors. This is true for both the Despite stronger distancing, there is growing evidence that
level of mobility restriction implemented during the social African American communities experience higher rates of
distancing phase and for the rate at which populations enter infection and death from COVID-19 [17,38,39]. We advocate
(“response engagement“) and exit (“response fatigue”) the social for additional work on the structural racism that is at the root
distancing phase. of these health disparities [40] and on the role of privilege in
the differential burdens imposed by COVID-19 on a variety of
Our analysis reveals that the occupational composition of the communities [22,41].
counties is associated with how deeply and for how long social
distancing is maintained. Populations including more essential There is a risk of the ecological fallacy if our results are
workers, who maintained food services, public transportation, interpreted as applying to individuals with the attributes we
and health care services during the pandemic [8], understandably investigated rather than the share of attributes in communities.
participate less in social distancing and thus experience greater Survey and qualitative studies would help explain how
risk. Additionally, lower-income populations participate less in individual, community, and public policy-level factors explain
social distancing, likely in part because low-wage workers may these associations.
have less access to job protections or paid leave. Our results Without large-scale test-trace-isolate programs or other
provide further nuance to the analysis by Lou et al [9], who interventions, intermittent social distancing will continue to be
found that lower-wage workers were unable to reduce their needed to contain cases and minimize the strain on health
work trips, in large part because businesses classified as essential systems [42]. Technological solutions are being suggested and
tended to pay lower wages. Our results may help explain why to an extent implemented [13-15]; however, these solutions are
lower-income counties have suffered a disproportionately high not without their limitations. The large-scale use of mobility
death burden from COVID-19 [17]; however, these results also data and other digital technologies (eg, for contact tracing) has
need to be taken in light of the more general role that low opened up a debate on the responsible use of these emerging
income plays in negative health outcomes [21]. Reduced access data streams [13,43], for instance to ensure that privacy concerns
to employer-sponsored health care [34] could further limit are properly assessed and addressed. These technologies would
testing and treatment-seeking behavior and potentially worsen also likely be most effective with the implementation of a
outbreaks in these communities. In rural communities (those spatially and socially homogeneous testing strategy. Similarly,
with low population density in our study), the need to travel the long-term success and equity of a mitigation strategy hinges
farther to access essential supplies and services such as food or on paying more attention to the geographic heterogeneity in
health care [35] may also limit social distancing and would outbreak mitigation and focusing on the role of social and
further confirm the existing disparity whereby rural counties employment policies that affect the ability of individuals to
engage in behavioral interventions.
Acknowledgments
The research reported in this publication was supported by the National Institute Of General Medical Sciences of the National
Institutes of Health under Award Number R01GM123007. The content is solely the responsibility of the authors and does not
necessarily represent the official views of the National Institutes of Health. The data and the code used for the statistical analysis
are available at https://github.com/bansallab/SESdistancing.
Conflicts of Interest
None declared.
Multimedia Appendix 1
Supplemental material.
[DOCX File , 230 KB-Multimedia Appendix 1]
http://www.jmir.org/2021/1/e24591/ J Med Internet Res 2021 | vol. 23 | iss. 1 | e24591 | p. 5
(page number not for citation purposes)
XSL• FO
RenderXJOURNAL OF MEDICAL INTERNET RESEARCH Garnier et al
References
1. Dong E, Du H, Gardner L. An interactive web-based dashboard to track COVID-19 in real time. Lancet Infect Dis 2020
May;20(5):533-534. [doi: 10.1016/s1473-3099(20)30120-1]
2. Dyer O. Covid-19: US testing ramps up as early response draws harsh criticism. BMJ 2020 Mar 23;368:m1167. [doi:
10.1136/bmj.m1167] [Medline: 32205342]
3. Chinazzi M, Davis JT, Ajelli M, Gioannini C, Litvinova M, Merler S, et al. The effect of travel restrictions on the spread
of the 2019 novel coronavirus (COVID-19) outbreak. Science 2020 Apr 24;368(6489):395-400 [FREE Full text] [doi:
10.1126/science.aba9757] [Medline: 32144116]
4. Gupta S, Nguyen T, Lozano RF, Raman S, Lee B, Bento A, et al. Tracking public and private response to the COVID-19
epidemicvidence from state and local government actions. NBER Working Paper Series. 2020 Apr. URL: http://www.
nber.org/papers/w27027 [accessed 2020-09-25]
5. Gensini GF, Yacoub MH, Conti AA. The concept of quarantine in history: from plague to SARS. J Infect 2004
Nov;49(4):257-261 [FREE Full text] [doi: 10.1016/j.jinf.2004.03.002] [Medline: 15474622]
6. Markel H, Lipman HB, Navarro JA, Sloan A, Michalsen JR, Stern AM, et al. Nonpharmaceutical interventions implemented
by US cities during the 1918-1919 influenza pandemic. JAMA 2007 Aug 08;298(6):644-654. [doi: 10.1001/jama.298.6.644]
[Medline: 17684187]
7. Tian H, Liu Y, Li Y, Wu C, Chen B, Kraemer MUG, et al. An investigation of transmission control measures during the
first 50 days of the COVID-19 epidemic in China. Science 2020 May 08;368(6491):638-642 [FREE Full text] [doi:
10.1126/science.abb6105] [Medline: 32234804]
8. van Dorn A, Cooney RE, Sabin ML. COVID-19 exacerbating inequalities in the US. Lancet 2020 Apr
18;395(10232):1243-1244 [FREE Full text] [doi: 10.1016/S0140-6736(20)30893-X] [Medline: 32305087]
9. Lou J, Shen X, Niemeier D. Are stay-at-home orders more difficult to follow for low-income groups? Journal of Transport
Geography 2020 Dec;89:102894. [doi: 10.1016/j.jtrangeo.2020.102894]
10. Klein B, LaRock T, McCabe S, Torres L, Privitera F, Lake B, et al. Assessing changes in commuting and individual mobility
in major metropolitan areas in the United States during the COVID-19 outbreak. Northeastern University Network Science
Institute. 2020 Mar 31. URL: https://uploads-ssl.webflow.com/5c9104426f6f88ac129ef3d2/
5e8374ee75221201609ab586_Assessing_mobility_changes_in_the_United_States_during_the_COVID_19_outbreak.pdf
[accessed 2020-09-25]
11. Pepe E, Bajardi P, Gauvin L, Privitera F, Lake B, Cattuto C, et al. COVID-19 outbreak response, a dataset to assess mobility
changes in Italy following national lockdown. Sci Data 2020 Jul 08;7(1):230 [FREE Full text] [doi:
10.1038/s41597-020-00575-2] [Medline: 32641758]
12. Pullano G, Valdano E, Scarpa N, Rubrichi S, Colizza V. Population mobility reductions during COVID-19 epidemic in
France under lockdown. medRxiv Preprint posted online on September 30, 2020. [doi: 10.1101/2020.05.29.20097097]
13. Budd J, Miller BS, Manning EM, Lampos V, Zhuang M, Edelstein M, et al. Digital technologies in the public-health
response to COVID-19. Nat Med 2020 Aug;26(8):1183-1192. [doi: 10.1038/s41591-020-1011-4] [Medline: 32770165]
14. Oliver N, Lepri B, Sterly H, Lambiotte R, Deletaille S, De Nadai M, et al. Mobile phone data for informing public health
actions across the COVID-19 pandemic life cycle. Sci Adv 2020 Jun;6(23):eabc0764 [FREE Full text] [doi:
10.1126/sciadv.abc0764] [Medline: 32548274]
15. Kishore N, Kiang MV, Engø-Monsen K, Vembar N, Schroeder A, Balsari S, et al. Measuring mobility to monitor travel
and physical distancing interventions: a common framework for mobile phone data analysis. Lancet Digit Health 2020
Nov;2(11):e622-e628 [FREE Full text] [doi: 10.1016/S2589-7500(20)30193-X] [Medline: 32905027]
16. Badr HS, Du H, Marshall M, Dong E, Squire MM, Gardner LM. Association between mobility patterns and COVID-19
transmission in the USA: a mathematical modelling study. Lancet Infect Dis 2020 Nov;20(11):1247-1254 [FREE Full text]
[doi: 10.1016/S1473-3099(20)30553-3] [Medline: 32621869]
17. Abedi V, Olulana O, Avula V, Chaudhary D, Khan A, Shahjouei S, et al. Racial, Economic, and Health Inequality and
COVID-19 Infection in the United States. J Racial Ethn Health Disparities 2020 Sep 01 [FREE Full text] [doi:
10.1007/s40615-020-00833-4] [Medline: 32875535]
18. Rubin D, Huang J, Fisher BT, Gasparrini A, Tam V, Song L, et al. Association of Social Distancing, Population Density,
and Temperature With the Instantaneous Reproduction Number of SARS-CoV-2 in Counties Across the United States.
JAMA Netw Open 2020 Jul 01;3(7):e2016099 [FREE Full text] [doi: 10.1001/jamanetworkopen.2020.16099] [Medline:
32701162]
19. Siedner MJ, Harling G, Reynolds Z, Gilbert RF, Haneuse S, Venkataramani AS, et al. Social distancing to slow the US
COVID-19 epidemic: Longitudinal pretest-posttest comparison group study. PLoS Med 2020 Aug;17(8):e1003244 [FREE
Full text] [doi: 10.1371/journal.pmed.1003244] [Medline: 32780772]
20. Huang V, Sutermaster S, Caplan Y, Kemp H, Schmutz D, Sgaier S. Social distancing across vulnerability, race, politics,
and employment: How different Americans changed behaviors before and after major COVID-19 policy announcements
Internet. medRxiv Preprint posted online on June 08, 2020. [doi: 10.1101/2020.06.04.20119131]
http://www.jmir.org/2021/1/e24591/ J Med Internet Res 2021 | vol. 23 | iss. 1 | e24591 | p. 6
(page number not for citation purposes)
XSL• FO
RenderXJOURNAL OF MEDICAL INTERNET RESEARCH Garnier et al
21. Weill JA, Stigler M, Deschenes O, Springborn MR. Social distancing responses to COVID-19 emergency declarations
strongly differentiated by income. Proc Natl Acad Sci USA 2020 Aug 18;117(33):19658-19660. [doi:
10.1073/pnas.2009412117] [Medline: 32727905]
22. Dasgupta N, Jonsson Funk M, Lazard A, White B, Marshall S. Quantifying the Social Distancing Privilege Gap: A
Longitudinal Study of Smartphone Movement. SSRN Journal Preprint posted online on August 11, 2020. [doi:
10.2139/ssrn.3588585]
23. The Social Distancing Scoreboard. Unacast. URL: https://www.unacast.com/covid19/social-distancing-scoreboard [accessed
2020-09-25]
24. Unacast. Archived at the Wayback Machine. URL: https://web.archive.org/web/20200916150140/https://www.unacast.com/
privacy [accessed 2020-09-18]
25. How Accurate is Unacast Data? Unacast. Archived at the Wayback Machine. URL: https://web.archive.org/web/
20200916225140/https://www.unacast.com/resources/how-accurate-is-unacast-data [accessed 2020-09-18]
26. Unacast Updates Social Distancing Scoreboard. Unacast. Archived at the Wayback Machine. URL: https://web.archive.org/
web/20200916174247/https://www.unacast.com/post/unacast-updates-social-distancing-scoreboard [accessed 2020-09-18]
27. Garnier R, Benetka J, Kraemer J, Bansal S. SESdistancing. GitHub. URL: https://github.com/bansallab/SESdistancing
[accessed 2020-09-18]
28. Taylor SJ, Letham B. Forecasting at Scale. Am Stat 2018 Apr 24;72(1):37-45. [doi: 10.1080/00031305.2017.1380080]
29. Annual county resident population estimates by age, sex, race, and hispanic origin: April 1, 2010 to July 1, 2018. US Census
Bureau, Population Division. 2019 Jun. URL: https://www2.census.gov/programs-surveys/popest/technical-documentation/
file-layouts/2010-2018/cc-est2018-alldata.pdf?# [accessed 2020-09-25]
30. Small Area Income and Poverty Estimates (SAIPE). US Census Bureau. 2018. URL: https://www.census.gov/data-tools/
demo/saipe/#/?map_geoSelector=aa_c [accessed 2020-09-25]
31. Tomer A, Kane J. How to protect essential workers during COVID-19. Brookings Reports. 2020 Mar 31. URL: https:/
/www.brookings.edu/research/how-to-protect-essential-workers-during-covid-19/ [accessed 2020-09-25]
32. Quarterly Census of Employment and Wages. United States Bureau of Labor Statistics. URL: https://www.bls.gov/cew/
[accessed 2020-05-11]
33. Zimmerman FJ, Anderson NW. Trends in Health Equity in the United States by Race/Ethnicity, Sex, and Income, 1993-2017.
JAMA Netw Open 2019 Jun 05;2(6):e196386 [FREE Full text] [doi: 10.1001/jamanetworkopen.2019.6386] [Medline:
31251377]
34. Gangopadhyaya A, Garrett AB. Unemployment, Health Insurance, and the COVID-19 Recession. SSRN Journal Preprint
posted online on April 01, 2020. [doi: 10.2139/ssrn.3568489]
35. Bitto EA, Morton LW, Oakland MJ, Sand M. Grocery Store Acess Patterns in Rural Food Deserts. J Stud Food Soc 2015
Apr 27;6(2):35-48. [doi: 10.2752/152897903786769616]
36. Anderson TJ, Saman DM, Lipsky MS, Lutfiyya MN. A cross-sectional study on health differences between rural and
non-rural U.S. counties using the County Health Rankings. BMC Health Serv Res 2015 Oct 01;15:441 [FREE Full text]
[doi: 10.1186/s12913-015-1053-3] [Medline: 26423746]
37. Henry-Nickie M, Hudak J. Social distancing in Black and white neighborhoods in Detroit: A data-driven look at vulnerable
communities Internet. Brookings. 2020 May 19. URL: https://www.brookings.edu/blog/fixgov/2020/05/19/
social-distancing-in-black-and-white-neighborhoods-in-detroit-a-data-driven-look-at-vulnerable-communities/ [accessed
2020-09-17]
38. Yancy CW. COVID-19 and African Americans. JAMA 2020 May 19;323(19):1891-1892. [doi: 10.1001/jama.2020.6548]
[Medline: 32293639]
39. Tai DBG, Shah A, Doubeni CA, Sia IG, Wieland ML. The Disproportionate Impact of COVID-19 on Racial and Ethnic
Minorities in the United States. Clin Infect Dis 2020 Jun 20:ciaa815 [FREE Full text] [doi: 10.1093/cid/ciaa815] [Medline:
32562416]
40. Chowkwanyun M, Reed AL. Racial Health Disparities and Covid-19 - Caution and Context. N Engl J Med 2020 Jul
16;383(3):201-203. [doi: 10.1056/NEJMp2012910] [Medline: 32374952]
41. Brown EA, White BM. Recognizing Privilege as a Social Determinant of Health During COVID-19. Health Equity
2020;4(1):1-4 [FREE Full text] [doi: 10.1089/heq.2020.0038] [Medline: 32908954]
42. Kissler SM, Tedijanto C, Goldstein E, Grad YH, Lipsitch M. Projecting the transmission dynamics of SARS-CoV-2 through
the postpandemic period. Science 2020 May 22;368(6493):860-868 [FREE Full text] [doi: 10.1126/science.abb5793]
[Medline: 32291278]
43. Ienca M, Vayena E. On the responsible use of digital data to tackle the COVID-19 pandemic. Nat Med 2020
Apr;26(4):463-464 [FREE Full text] [doi: 10.1038/s41591-020-0832-5] [Medline: 32284619]
http://www.jmir.org/2021/1/e24591/ J Med Internet Res 2021 | vol. 23 | iss. 1 | e24591 | p. 7
(page number not for citation purposes)
XSL• FO
RenderXJOURNAL OF MEDICAL INTERNET RESEARCH Garnier et al
Edited by M Focsa; submitted 25.09.20; peer-reviewed by C Abbafati, S Gao; comments to author 27.11.20; revised version received
10.12.20; accepted 14.12.20; published 22.01.21
Please cite as:
Garnier R, Benetka JR, Kraemer J, Bansal S
Socioeconomic Disparities in Social Distancing During the COVID-19 Pandemic in the United States: Observational Study
J Med Internet Res 2021;23(1):e24591
URL: http://www.jmir.org/2021/1/e24591/
doi: 10.2196/24591
PMID:
©Romain Garnier, Jan R Benetka, John Kraemer, Shweta Bansal. Originally published in the Journal of Medical Internet Research
(http://www.jmir.org), 22.01.2021. This is an open-access article distributed under the terms of the Creative Commons Attribution
License (https://creativecommons.org/licenses/by/4.0/), which permits unrestricted use, distribution, and reproduction in any
medium, provided the original work, first published in the Journal of Medical Internet Research, is properly cited. The complete
bibliographic information, a link to the original publication on http://www.jmir.org/, as well as this copyright and license information
must be included.
http://www.jmir.org/2021/1/e24591/ J Med Internet Res 2021 | vol. 23 | iss. 1 | e24591 | p. 8
(page number not for citation purposes)
XSL• FO
RenderXYou can also read