Snow Data Collection Methods Related to Tundra Travel, North Slope, Alaska: 2009
←
→
Page content transcription
If your browser does not render page correctly, please read the page content below

Snow Data Collection Methods Related to
Tundra Travel, North Slope, Alaska: 2009

        Field Crew at 2L Pad Snow Measurement Site,
       Kuparuk Operating Field, photo by Michael Lilly.

                             by

Jeff Derry, Michael Lilly, Gary Schultz, and Jessie Cherry

                      December 2009

         Arctic Transportation Networks Project

                  Report GWS.TR.09.05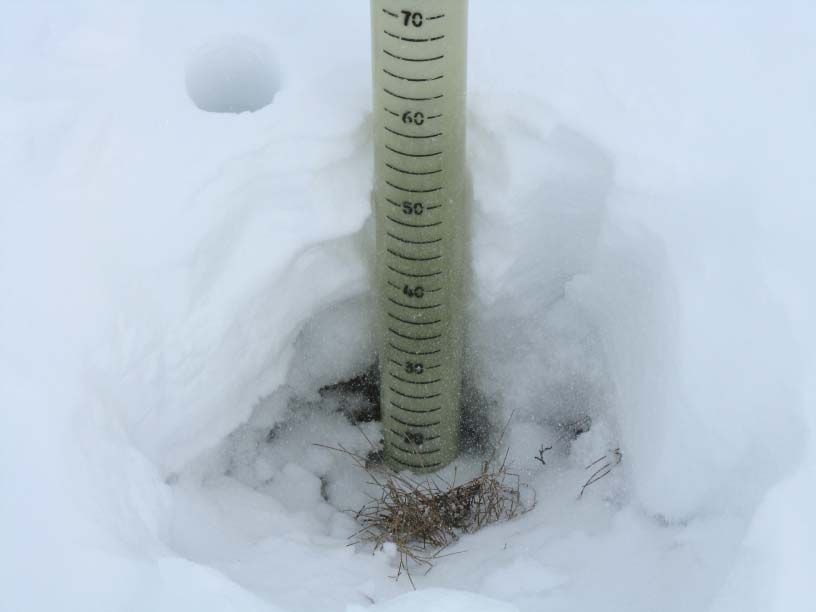
Snow Data Collection Methods Related to Tundra Travel, North

Slope, Alaska: 2009

by

Jeff Derry1, Michael Lilly1, Gary Schultz2, and Jessie Cherry3

A report on research sponsored by:

     • U.S. Department of Energy
     • National Energy Technology Laboratory
     • Alaska Department of Natural Resources.
     • ConocoPhillips Alaska, Inc.
     • Bureau of Land Management
     • Geo-Watersheds Scientific

December 2009
Arctic Transportation Network Project
Report Number GWS.TR.09.05

1
  Geo-Watersheds Scientific, Fairbanks, Alaska
2
  Department of Natural Resources
3
  University of Alaska Fairbanks, International Arctic Research Center
Recommended Citation:
Derry, J.E., Lilly, M.R., Schultz, G., Cherry, J., 2009. Snow Data Collection Methods Related to
Tundra Travel, North Slope, Alaska. December 2009, Geo-Watersheds Scientific, Report
GWS.TR.09.05, Fairbanks, Alaska, 12 pp (plus appendices).

                                       Fairbanks, Alaska
                                        December 2009

For additional information write to:

Geo-Watersheds Scientific
PO Box 81538
Fairbanks, Alaska 99708
mlilly@gwscientific.com
TABLE OF CONTENTS
TABLE OF CONTENTS................................................................................................................. i
LIST OF FIGURES ........................................................................................................................ ii
LIST OF TABLES.......................................................................................................................... ii
UNITS, CONVERSION FACTORS, WATER QUALITY UNITS, VERTICAL AND
HORIZONTAL DATUM, ABBREVIATIONS AND SYMBOLS .............................................. iv
Units................................................................................................................................................ v
1. INTRODUCTION ...................................................................................................................... 1
2. GWs SNOW SAMPLING METHODS...................................................................................... 2
2.1 Site Selection ........................................................................................................................ 2
2.2 Snow-Course......................................................................................................................... 4
2.3 Data Documentation ............................................................................................................. 7
3. DNR SNOW SAMPLING METHODS ..................................................................................... 8
3.1 Site Selection ........................................................................................................................ 8
3.2 Snow Depth, Density, and Hardness Measurements .......................................................... 10
3.3 Data Documentation ........................................................................................................... 11
3.4 DNR Sampling Methods Prior to 2009/10.......................................................................... 11
4. METHOD COMPARISON ...................................................................................................... 12
5. SUMMARY.............................................................................................................................. 12
6. REFERENCES ......................................................................................................................... 13
APPENDIX A. GWS Snow-Course Standard Operating Procedure....................................... 14
APPENDIX B. Example GWS Snow-Course Data Entry Spreadsheet and Filled in
Spreadsheet for Illustrative Purposes........................................................................................ 16
APPENDIX C. Snow Depth Measurement Standard Operating Procedure ............................ 20
APPENDIX D. Example Snow Depth Data Entry Spreadsheet and Filled in Spreadsheet for
Illustrative Purposes.................................................................................................................. 22
iLIST OF FIGURES
Figure 1. Diagram of an “L” shaped transect along which snow depth measurements and density
samples are collected. ............................................................................................................. 3
Figure 2. Jeff Derry collecting snow density samples along snow course, T-handle probe for
measuring snow depth in foreground, Toolik Lake NRCS index site. Photo by Michael
Lilly, November 21, 2009....................................................................................................... 6
Figure 3. Adirondak snow tube inserted to snow/ground interface and snow depth recorded...... 6
Figure 4. Jeff Derry getting ready to invert an Adirondack snow sampler to empty snow sample
into plastic zip-lock bag. Site located due south of Toolik Research Camp. Photo by M.
Lilly, November 21, 2009....................................................................................................... 7
Figure 5. Map of DNR snow sampling and soil temperature sites on the North Slope, Alaska
(DNR, 2009). .......................................................................................................................... 9
Figure 6. Typical layout of DNR snow and soil sampling site. Up to nine snow depth transects
are performed throughout the winter, with the first transect starting at 1-A and final visit
being at 3-C (DNR, 2009)..................................................................................................... 10
LIST OF TABLES
Table 1. Snow slab penetration method and number allocation for each (DNR, 2009). ............. 11
iiACKNOWLEDGEMENT
This material is based upon work supported by the Department of Energy [National Energy and
Technology Laboratory] under Award Number DE-FE0001240.
DISCLAIMER
This report was prepared as an account of work sponsored by an agency of the United States
Government. Neither the United States Government nor any agency thereof, nor any of their
employees, makes any warranty, express or implied, or assumes any legal liability or
responsibility for the accuracy, completeness, or usefulness of any information apparatus,
product, or process disclosed, or represents that its use would not infringe privately owned rights.
Reference herein to any specific commercial product, process, or service by trade name,
trademark, manufacturer, or otherwise does not necessarily constitute or imply its endorsement,
recommendation, or favoring by the United States Government or any agency thereof. The
views and opinions of authors expressed herein do not necessarily state or reflect those of the
United States Government or any agency thereof.
The contents of this report reflect the views of the authors, who are responsible for the accuracy
of the data presented herein. The contents of the report do not necessarily reflect the views of
policies of DOE or any local sponsor. This work does not constitute a standard, specification, or
regulation.
iiiUNITS, CONVERSION FACTORS, WATER QUALITY UNITS,
VERTICAL AND HORIZONTAL DATUM, ABBREVIATIONS AND
SYMBOLS
Conversion Factors
Multiply By To obtain
Length
inch (in) 25.4 millimeter (mm)
inch (in) 2.54 centimeter (cm)
foot (ft) 0.3048 meter (m)
mile (mi) 1.609 kilometer (km)
Area
Acre 43559.826 square feet (ft2)
Acre 0.407 hectare (ha)
square foot (ft2) 2.590 square mile (mi2)
square mile (mi2) 2.590 square kilometer (km2)
Volume
gallon (gal) 3.785 liter (L)
gallon (gal) 3785 milliliter (mL)
cubic foot (ft3) 23.317 liter (L)
Acre-ft 1233 cubic meter (m3)
Velocity and Discharge
foot per day (ft/d) 0.3048 meter per day (m/d)
Square foot per day (ft2/d ) 0.0929 square meter per day (m2/d)
cubic foot per second (ft3/s) 0.02832 cubic meter per second (m3/sec)
Hydraulic Conductivity
foot per day (ft/d) 0.3048 meter per day (m/d)
foot per day (ft/d) 0.00035 centimeter per second (cm/sec)
meter per day (m/d) 0.00115 centimeter per second (cm/sec)
Hydraulic Gradient
foot per foot (ft/ft) 5280 foot per mile (ft/mi)
foot per mile (ft/mi) 0.1894 meter per kilometer (m/km)
Pressure
pound per square inch (lb/in2 ) 6.895 kilopascal (kPa)
Density
Slugs per cubic foot (slug/ft3) 515.464 Kilograms per cubic meter
(kg/m3)
ivUNITS
For the purposes of this report, both English and Metric (SI) units were employed. The choice of
“primary” units employed depended on common reporting standards for a particular property or
variable measured. Whenever possible, the approximate value in the “secondary” units was also
provided in parentheses. Thus, for instance, stream flow was reported in cubic feet per second
(cfs) followed by the value in cubic meters per second (m3/s) in parentheses.
Vertical Datum:
In this report, "sea level" refers to the National Geodetic Vertical Datum of 1929 (NGVD of
1929), a geodetic datum derived from a general adjustment of the first-order level nets of both
the United States and Canada, formerly called Sea Level Datum of 1929.
Horizontal Datum:
The horizontal datum for all locations in this report is the North American Datum of 1983.
Snow Water Equivalent (SWE):
Water content, expressed as water depth, of a given column of snow is determined by knowing
the depth of the snowpack and density.
SWE = ds * ρs / pw
where:
ds = snow depth
ρs = snow density
pw= density of water (pw= 1)
vAbbreviations, Acronyms, and Symbols
AC Actual conductivity
AAS Alaska’s Arctic Slope
ADOT&PF Alaska Department of Transportation and Public Facilities
ADNR Alaska Department of Natural Resources
ASTM American Society for Testing and Materials
atm atmospheres
ATN Arctic Transportation Networks
C Celsius
cm centimeters
DO Dissolved oxygen
DNR Department of Natural Resources
DVM digital voltage multi-meter
F Fahrenheit (oF).
ft feet
GWS Geo-Watersheds Scientific
in inches
kg Kilograms
km2 square kilometers
kPa kilopascal
lb/in2 pounds per square inch
m meters
mg/L milligrams per liter
μg/L micrograms per liter
mi2 square miles
mm millimeters
μS/cm microsiemens per centimeter
mV Millivolt
NGVD National Geodetic Vertical Datum
NRCS Natural Resources Conservation Service
NWIS National Water Information System
ORP oxygen-reduction potential
ppm parts per million
QA quality assurance
QC quality control
Sag Sagavanirktok River
SC25 specific conductance at 25°C
SWE snow water equivalent
UAF University of Alaska Fairbanks
USACE U.S. Army Corps of Engineers, Alaska District
USGS U.S. Geological Survey
WERC Water and Environmental Research Center
WWW World Wide Web
YSI Yellow Springs Instruments
vi1. INTRODUCTION
A majority of oil and gas development and exploration on the North Slope takes place in winter
when the tundra surface is stable (i.e. frozen). Therefore, knowledge of snow accumulation and
its ablation, both temporally and spatially, in the high latitude environment of the Central North
Slope Alaska is of vital importance to both industry and research scientists. DNR requirements
for the opening of tundra travel in the Coastal Tundra Opening Areas is dependent on having
15.24 cm (6 in) of snow on the ground and 23° F (-5°C) soil temperatures at a depth of 30 cm
(11.8 in) (Bader, 2004).
Many projects and participants collect snow data – according to their particular method - along
the North Slope. The purpose of this document is to outline the current snow data collection
methods as practiced by Geo-Watersheds Scientific (GWS) and the Department of Natural
Resources (DNR). Documented sampling methods will allow standardized and consistent snow
data collection practices and documentation to be adhered to between multiple parties. In
addition - within the context of the Arctic Transportation Networks project (ATN) - clear
understanding of sampling protocols is a priori to determine if results vary significantly and
whether or not the data-sets can be integrated.
Accurate field observations of the snowpack are necessary before any assessment for industry or
research applications can be undertaken. Having no method to forecast snow conditions,
opening date is dependent on agency personnel visiting field sites to verify snow and soil
conditions. From a research perspective, understanding and quantifying the role of snow in the
hydrologic cycle and energy budgets is crucial for scientific research and modeling efforts.
Precipitation in the form of snow is temporarily stored in the snowpack during the cold season
with peak discharge for many rivers on the North Slope resulting from snowmelt runoff. The
presence or absence of snow substantially affects the surface energy balance and underlying soil
conditions (Kane et al., 1978). Increased understanding of the temporal and spatial distribution
of snow has multifaceted benefits and applications.
12. GWS SNOW SAMPLING METHODS
GWS snow sampling methods are described in detailed below. Careful site selection, diligent
measurement methods, and consistent documentation are important when interpreting snow data
from various field campaigns and multiple parties.
2.1 Site Selection
Site selection of sampling locations depends on accessibility and purpose of sampling site.
Sampling sites used to ascertain end-of-winter snow accumulation over a particular area of a
study domain are typically visited only once in late Spring – when snow accumulation is near it’s
maximum – and are usually remote and accessible only by helicopter. Sampling sites established
with the intent of being visited multiple times during the winter and spring season are located
within vehicle or foot accessibility. These sites are often co-located with meteorological stations
equipped with a snow depth sensor (SR50 or SR50A) and/or soil temperature sensors so that
observed snow depths from snow-course data (having a relative larger areal extent yet lower
temporal resolution) can be compared to the hourly point data of the station sensor (having a
smaller areal extent yet higher temporal resolution) as well as soil conditions.
A snow-course is a particular location where an established amount of snow depths and snow
densities are collected. A snow survey is defined as a field campaign designed to visit multiple
snow-courses with the intent to estimate snow conditions over a given study domain. A snow
depth transect is where snow depths (quantity dependent on length of transect) are collected
along a linear route.
When establishing a snow-course site:
• Select a location away from the influence of any man made formation or structure.
• Select a site that represents the surrounding natural environment in terms of
underlying ground surface and overlying snow distribution (Figure 1). Take into
consideration vegetation, topography, snow deposition and melt patterns. A location
that will be flooded prior to completion of snowmelt should be avoided.
2• The directions of measurement are chosen somewhat randomly, but with
consideration of snow drift frequency and direction in order to capture natural
variability.
• If the sampling site is located near a meteorological station with a snow sensor,
conduct measurements near station in a representative environment.
• Note coordinates of the location using a Global Positioning System (GPS) that is
WAAS enabled (see GPS settings). Typical coordinate system used is NAD 83.
• When returning to a previously established site, navigate to site using GPS,
landmarks detailed in field-books, and knowledge from previous field trips.
• If the site will be visited multiple times over a season it may be desirable to mark
(with lathe) the beginning, corner, and ending points to ensure consistency between
visits.
• If the site is marked, avoid disturbing the snowpack over multiple visits by
systematically moving measurements approximately 1 m (3.3 ft) in one direction
from the previous.
Figure 1. Diagram of an “L” shaped transect along which snow depth measurements and density samples are
collected.
32.2 Snow-Course
GWS follows snow sampling procedures established in cooperation with the Water
Environmental Research Center (WERC) at the University of Alaska Fairbanks (Derry et al.
2009). A snow-course, which includes collecting snow depth as well as snow density, is a
method referred to as “double sampling”. With this information, the snowpack density
multiplied by the snow depth results in the snow water equivalent (SWE) of that particular
column of snow. To calculate average SWE for a snow-course, the average of 50 snow depths
are multiplied by the average of 5 snow density samples.
Snow water equivalent, in terms of water depth, is defined as:
SWE = ds * ρs / pw (1),
where ρs is the average snow density from 5 snow core samples, and ds is the average of 50 snow
depth measurements, and pw = 1 is the density of water.
The heterogeneous Arctic snowpack is more variable in depth than in density (Benson and
Sturm, 1993); hence, more depth measurements are required relative to density measurements.
Double sampling has been shown to improve SWE estimations, as opposed to solely collecting
snow densities, with the optimum sampling ratio of 12-15 snow depths per each density
measurement (Rovansek et al. 1993). To standardize sampling efforts, a ratio of 10 depths to
one density is used. In total, a snow-course consists of collecting 50 snow depths and 5
densities.
Snow depths are collected at 1 m (3.3 ft) sampling intervals in a 25 m by 25 m (82 ft by 82 ft)
“L” shaped transect, resulting in a total of 50 snow depth values. This method usually accounts
for snowdrifts and topographic features in the sampling area.
Snow-course instructions:
• Select a direction based on mentioned criteria in previous section, take a depth
measurement every meter for 25 meters (Figure 1).
• Turn 90° and take a depth measurement every meter for 25 meters.
4• If the snow-course has been conducted previously at this location, orient the “L”
pattern in the same direction.
• On a staked snow-course, if the 25th sample is not at the corner stake, go to the corner
stake before continuing with the 26th depth measurement.
Typically, depth measurements are done using a T-shaped graduated rod (T-probe) marked in
centimeters. The probe is pushed vertically into the snowpack to the snow/ground interface and
the depth recorded to the nearest 0.5 centimeter. Occasionally with hard packed snow the probe
penetrates the tundra surface, when this happens gently raise and lower the probe until the
surface is detected and then record depth (Figure 2).
Snow density is collected with an Adirondack snow sampler preferably marked at centimeter
intervals (Figure 3). The tube has an inside area of 35.7 cm² (5.53 in²) and has metallic teeth on
the lower end to cut through dense snow layers. The large diameter of the Adirondack, as
opposed to the Standard Federal Sampler, collects a larger sample and introduces less error in the
shallow Arctic snowpack (Berezovskaya and Kane, 2007; Woo, 1997). Five densities are
collected in undisturbed locations equally spaced along the “L” shaped transect. The tube is
inserted vertically until the ground surface is encountered and then the snow depth is recorded.
Once the snow depth has been recorded, there are two methods of collecting the snow sample
which depend on the hardness of ground surface: 1) If the ground surface is not frozen, insert the
tube until the ground is detected and note depth on tube, then insert further into ground thereby
cutting a soil plug, remove tube and, with a zip-lock plastic bag over the top (non-cutting end),
invert tube, thereby emptying the snow into the bag, and remove the soil plug from bag. 2) If
the ground surface is frozen, dig down to the tube/ground interface and, slide a flat object (like a
flat shovel or hand) under the tube so sintered snow particles cannot escape, empty the snow
sample into a zip-lock plastic bag held over the other end of the tube (Figure 4). If possible keep
snow samples below freezing until they are weighed. Remove small debris (e.g. vegetation, soil
clumps) before weighing. Be sure to tare scale to account for the weight of the zip-lock bag.
5Figure 2. Jeff Derry collecting snow density samples along snow course, T-handle probe for measuring snow
depth in foreground, Toolik Lake NRCS index site. Photo by Michael Lilly, November 21, 2009.
Figure 3. Adirondak snow tube inserted to snow/ground interface and snow depth recorded.
6Figure 4. Jeff Derry getting ready to invert an Adirondack snow sampler to empty snow sample into plastic
zip-lock bag. Site located due south of Toolik Research Camp. Photo by M. Lilly, November 21, 2009.
2.3 Data Documentation
Thorough documentation of observed conditions while in the field is critical for reporting data in
an accurate and confident manner.
Procedures for data documentation are as follows:
• Fill in all information (i.e. time, weather conditions, location, personnel), as well as
any relevant conditions or observations in field form “F-012” (see Appendix B)
while on site.
• Ensure all applicable information is noted particularly vegetation type and amount.
Example, “70% tussock tundra, 30% low lying shrubs”.
• Photos are helpful. Each image should be labeled according to location and date
(year, month, day). The first two digits for year, then two digits for month, and the
last two digits for day. As an example, “FrankBluffs_080528.JPG”. This naming
convention helps to keep images organized over multiple years.
7• Include specific notes that will allow future personnel to conduct snow-courses at
the same location, with the “L” pattern oriented in the same direction. Besides
noting cardinal directions, it is helpful to note landmarks on the horizon for
direction. For example, “started just east of L9312 meteorological station, headed
towards Alpine pad for 25 depth measurements, turned 90° to left (away from lake)
and continued for another 25 measurements”.
• Enter all information in excel spreadsheet that evening upon returning to camp, label
spreadsheet keeping form label “F012” with the name, such as
“Shaviovik_F012_080522.xls”.
• After data is entered by person who took observations in field, have a qualified
person QA/QC the entries and verify that it is complete and accurate. Both people
sign their name and date at bottom of formatted spreadsheet.
3. DNR SNOW SAMPLING METHODS
Snow sampling protocols practiced by DNR personnel are detailed below.
3.1 Site Selection
Snow (and co-located soil temperature monitoring) sampling is carried out at pre-established
sites accessible by vehicle throughout the winter season. A total of 20 sites cover an area south
near Slope Mountain and north to the coast (Figure 5).
8Figure 5. Map of DNR snow sampling and soil temperature sites on the North Slope, Alaska (DNR, 2009).
Sites are visited approximately nine times a season with snow sampling performed at a slightly
different location each visit (Figure 6). Note that a station is not visited again once it has met the
criteria for tundra opening.
9Figure 6. Typical layout of DNR snow and soil sampling site. Up to nine snow depth transects are performed
throughout the winter, with the first transect starting at 1-A and final visit being at 3-C (DNR, 2009).
3.2 Snow Depth, Density, and Hardness Measurements
For each site DNR personnel collect snow depth, snow density, and snow hardness data at the
appropriate transect location for each visit. Snow depth measurements are along an 11 meter
transect. Transects are selected based on an assessment of typical areas that equipment would
travel. Areas of large drifts or deep polygon troughs are avoided. Depths are measured every
0.5 meter (1.5 ft) totaling 20 depth values per transect. Two snow densities are collected near
transect with a Federal Snow Sampler. The Sampler is pushed through the snowpack to the
tundra surface and the depth is recorded to the nearest inch. The protocol includes cutting into
the tundra surface, thereby collecting a tundra plug if possible, to ensure the entire snow column
is collected. If the tundra is too hard then a trowel/shovel or hand is placed under the sampler to
prevent snow from falling out while transferring sample into a plastic bag placed in a bucket. It
is later weighed upon returning to the field office so that density can be calculated.
Snow hardness is estimated in the DNR procedures. This is accomplished by digging two snow
pits (one to two meters in length) near the snow depth transect. For each pit, a column of snow is
analyzed and the following items recorded:
10• Total snow depth to the nearest inch from a column of snow selected in the snow pit.
• Loose surface snow presence, strength, and thickness to the nearest inch.
• Slab presence, strength, and thickness to the nearest inch. If there is more than one
slab, record the combined total of slab thickness.
• Depth hoar presence, strength, and thickness to the nearest inch.
• Does the slab cap the tussocks (in tussock tundra only).
Layer strength is estimated using the following table (Table 1). The index applies when firm,
steady pressure breaks through the slab being tested.
Table 1. Snow slab penetration method and number allocation for each (DNR, 2009).
None Fist 3 Fingers 1 Finger Pencil Knife
0 1 2 3 4 5
3.3 Data Documentation
Data collected at DNR sampling locations are recorded in formatted spreadsheets. The
spreadsheet includes multiple tabs, one for each of the 9 visits throughout the season. Each tab
contains data collected from each field location as well as formatted cells to compute density,
SWE, and mean snow depth.
3.4 DNR Sampling Methods Prior to 2009/10
Previous year’s snow data collection methods varied from current methods detailed above. Prior
to 2005, DNR sampled 25 monitoring stations. Variables sampled included snow depth and
ground hardness (using a slide hammer penetrometer) to 30.48 cm (1 ft) depth. In 2005, DNR
stopped measuring ground hardness and installed thermistors to measure soil temperature. At
this time the number of sites was reduced to that currently monitored. From 2005 until 2008, 10
snow depth measurements were taken along a 10 meter (32.8 ft) transect spaced at 1 meter (3.3
11ft) intervals. Density measurements were not collected until the winter of 2008/2009, when
DNR began using the method currently in use.
4. METHOD COMPARISON
In an effort to increase understanding related to the applicability of different snow collection
methods practiced by GWS and DNR, many GWS sampling sites for the ATN project are co-
located with DNR sampling sites. Data from these co-located sites will be analyzed and
compared throughout the season. The objective is to determine if the results vary significantly
between the two methods described herein, and whether the data collected by using the these two
different methods can be integrated, thus allowing for increased temporal and spatial coverage
across the North Slope.
5. SUMMARY
Understanding the timing and amount of snow accumulation and its ablation is essential for
industry, agencies, and scientific investigations. Certain snow conditions are required before
industry can begin tundra travel operations, which is crucial for exploration and logistics. The
snowpack is a major factor of the surface energy balance, soil and vegetation processes, and
most streams experience peak discharge as a result of the snowmelt in spring. The objective of
this document is to report the snow sampling protocol as practiced by GWS and DNR.
Documented sampling methods will seek to improve understanding of procedures to be carried
out in the field and applicability of integration of data from multiple entities.
126. REFERENCES
Bader, H.R. 2004. Tundra Travel Research Project: Validation Study and Management
Recommendations. Betula Consulting. 20 pages.
Benson, C. S. and M. Sturm (1993) Structure and wind transport of seasonal snow on the Arctic
Slope of Alaska. Annals of Glaciol., 18, 261-267.
Berezovskaya, S., and D.L.Kane (2007) Strategies for measuring snow water equivalent for
hydrological applications: part 1, accuracy of measurements. Proceedings of 16th Northern
Research Basin Symposium, Petrazovodsk, Russia, Aug 27 – Sep 2.
Department of Natural Resources (2009) Winter Off-road Travel Conditions Monitoring
Sampling Protocol, Department of Natural Resources, Division of Mining Land and Water,
4 pp.
Derry, J.E., Kane, D.L., Lilly, M.R., and Toniolo, H., 2009. Snow-Course Measurement
Methods, North Slope, Alaska. December 2009, University of Alaska Fairbanks, Water and
Environmental Research Center, Report INE/WERC 2009.07, Fairbanks, Alaska, 15 pp.
Kane, D.L., J.N. Luthin and G.S. Taylor (1978) Heat and mass transfer in cold regions soils.
IWR-65, Institute of Water Resources, UAF.
Rovansek, R.J., D.L. Kane and L.D. Hinzman (1993) Improving estimates of snowpack water
equivalent using double sampling. Proceedings of the 61st Western Snow Conference, 157-
163.
Woo, M-K (1997) A guide for ground based measurement of the arctic snow cover. Canadian
Snow Data CD, Meteorological Service of Canada, Downsview, Ontario, p.30.
13APPENDIX A. GWS Snow-Course Standard Operating Procedure
The following page is condensed snow-course standard operating procedures and is intended to
be printed and inserted into field notebook.
14SNOW-COURSE STANDARD OPERATING PROCEDURES
GW Watershed Scientific
OBJECTIVE: To collect snow depth and density measurements that best represent the surrounding area, in terms
of topography and spatial extent.
METHODS:
Site Selection
• For established, yet unmarked, snow-course sites, navigate to the point using a combination of knowledge
from previous field trips, landmarks detailed in fieldbooks and utilization of coordinates using a Global
Positioning System (GPS). Ensure GPS is WAAS enabled. The typical coordinate system is NAD 83.
• If there is not an established, marked, snow-course site, then select a representative location for the area.
Attempt to capture natural snow variability, taking into consideration vegetation, topography, deposition
patterns, and melt patterns. A location that will be flooded prior to completion of snowmelt should be
avoided. When documenting site location, explicitly state the coordinate system used. Record accuracy
(error) if GPS reports it.
• If there is a meteorological station with a snow sensor, conduct snow-course near sensor and in a
representative environment.
Conducting Snow-course
Snow depth
• Snow depths are conducted in an “L” shaped pattern. Pick a direction (note on snow form), take depth
measurements, then turn 90 degrees and continue (noting direction on form). If this snow-course has been
conducted previously, orient the “L” pattern in the same direction as previously noted.
• Snow depth measurements are taken every meter for twenty-five meters, turning 90 degrees, and
continuing for another twenty-five meters – for a total of 50 depth measurements. On a staked snow-course,
if the 25th sample is not at the corner stake, return to the corner stake before continuing with the 26th sample.
• Record depths to the half centimeter.
Density
• Snow densities are collected with an Adirondack snow sampler, preferably with centimeter depth markings.
Five densities should be collected from undisturbed points along representative locations near, but not on the
“L” shaped transect. Minimize disturbance to the “L” shaped transect so that future measurements will be of
a minimally disturbed snowpack.
• When taking densities, make sure that snow does not fall out of the tube and that all sintered snow is
collected near bottom of snowpack.
• There are two ways to collect snow in a sample bag: 1) Insert tube until it sits on ground surface, note
depth on outside of tube, push tube further into the ground cutting a soil plug, remove tube and, with a
ziplock bag over the top (or none cutting end), invert tube emptying snow into bag, remove soil plug from
bag. 2) If ground surface is frozen, do as in previous instructions but instead of collecting a soil plug, dig
down to tube/soil interface and while holding snow in place with a hand, empty snow into bag that is placed
on opposite end of tube.
• Put snow in plastic bag and weigh whenever convenient, tare the bag weight, record weight in grams.
Densities are averaged to ascertain a representative density.
Field Forms
• Fill in all required information in the most current formatted field form (UAF-WERC F012), i.e. time,
weather conditions, location, personnel.
• Fill in all information while on site.
• Ensure information is noted as to vegetation type and amount. Example, “70% tussock tundra, 30% low
lying shrubs”.
• Photos are helpful. Each image should be labeled according to location and date (year, month, day). As an
example, “FrankBluffs_070528.JPG”.
• Any and all conditions or observations please note on form.
• Include specific notes that will allow future personnel to conduct snow-courses at the same location, with
an “L” pattern oriented in the same direction. Besides noting cardinal directions, it is helpful to note
landmarks on the horizon for direction.
15APPENDIX B. Example GWS Snow-Course Data Entry Spreadsheet and
Filled in Spreadsheet for Illustrative Purposes.
A formatted excel spreadsheet like the one shown below can be downloaded from the Arctic
Transportation Networks Project website. Following the blank spreadsheet is a real, completed
spreadsheet for illustrative purposes. An example spreadsheet can also be requested from the
main author of this report by contacting Jeff Derry at jderry@gwscientific.com.
16Arctic Transportation Networks Project
Form F-012: Snow Survey Form
Project ID: ATN Project Site Location/Lake ID:
Survey Purpose: Determine Snow Depth and SWE Date: Time:
Location
Description:
Survey Weather
objective: Observations:
Latitude: Longitude: Datum:
Elevation: Elevation Reference
Datum: Markers:
Drainage Slope Vegetation
Basin: Direction: Type:
Slope Angle: Access Other:
Notes:
Snow Depth Probe Type:
Snow-Survey Team Names:
Snow Tube Type:
Snow Course Depths (cm)
1 2 3 4 5 (cm)
1 Average snow depth =
2 Maximum snow depth =
3 Minimum snow depth =
4 Standard variation =
5
6 (inches)
7 Average snow depth =
8 Maximum snow depth =
9 Minimum snow depth =
10 Standard variation =
Snow Sample Depths and Weights
Bag # Snow Depth Weight Volume Density Organic Plug
(cm) (g) (cm^3) (g/cm^3) (cm)
Average Density =
Average Snow Water Equivalent (SWE) = cm H2O
Average Snow Water Equivalent = inches H2O
Average Snow Water Equivalent = feet H2O
SWE = avg. snow depth*(density snow/density water)
Data entered by: Date:
Data QA/QC by: Date:
17The Excel entry spreadsheet is formatted to calculate summary statistics. An actual snow-course
form from an ATN project field campaign is shown below. A few items to consider:
• Cells highlighted in light green require information be entry from field person(s)
collecting the data. For some sites, much of this information – site name, survey
objective, coordinates, elevation, drainage basin, vegetation type – can be supplied to
field crew by ATN personnel and this information can be used for all subsequent
sampling for a given location.
• Cells highlighted in peach color are information automatically calculated in the
spreadsheet from the information supplied in the light green cells.
• “Slope Direction and Slope Angle” is intended to communicate if sampling was done
on a hill, and if so then the angle and direction of the slope estimated by field crew.
For sampling in the Coastal Region this will almost always be “Flat”.
• “Weather Observations” is the general conditions while sampling, including actual
temperature and wind values is not required.
• “Snow-Survey Team Names” is needed in case questions or clarification is required
for processing and analyzing the information.
• “Data Entered By and Data QA/QC” cells denotes the person who entered the data in
the spreadsheet and who double checked the entries and verified they are correct
based on what was recorded in the field book.
• “Reference Markers” refers to if the sampling is done at a marked location.
• “Other” is a good location to note anything that may be of interest or informative,
such as condition of snowpack, “snow extremely hard packed”, for example.
18Arctic Transportation Networks Project
Form F-012: Snow Survey Form
Project ID: ATN Site Location/Lake ID: L9312 - Tundra
Survey Purpose: Determine snow depth/SWE Date: 11/19/2009 Time: 9:00
Location On tundra on staked course, adjacent and north of L9312 weather station.
Description:
Survey Determine snow depth and density for application to lake recharge Weather Dark, cold
objective: studies, and tundra travel management. Observations:
Latitude: N 70° 19.995' Longitude: W 150° 56.918' Datum: NAD 83
Elevation: 7 ft Elevation BPMSL Reference Orange stakes
Datum: Markers:
Drainage Colville River Slope Flat Vegetation Lowland Wet Sedge Tundra
Basin: Direction: Type:
Slope Angle: Flat Access snowmobile Other: Snow pack was fairly
Notes: uniform, some slabbing
Snow Depth Probe Type: T-probe Snow-Survey Team Names:
Snow Tube Type: Adirondack Snow Tube
Jeff Derry, Jack (LCMF)
Snow Course Depths (cm)
1 2 3 4 5 (cm)
1 16.0 10.0 21.0 19.0 21.0 Average snow depth = 22.7
2 22.0 9.0 18.0 18.0 35.0 Maximum snow depth = 58.0
3 26.0 9.0 19.0 14.0 58.0 Minimum snow depth = 9.0
4 21.0 15.0 17.0 14.0 56.0 Standard variation = 12.6
5 47.0 18.0 10.0 10.0 51.0
6 22.0 20.0 19.0 21.0 45.0 (inches)
7 14.0 29.0 11.0 17.0 47.0 Average snow depth = 8.9
8 15.0 27.0 11.0 11.0 38.0 Maximum snow depth = 22.8
9 13.0 24.0 29.0 13.0 34.0 Minimum snow depth = 3.5
10 12.0 17.0 21.0 17.0 32.0 Standard variation = 5.0
Snow Sample Depths and Weights
Bag # Snow Depth Weight Volume Density Organic Plug
(cm) (g) (cm^3) (g/cm^3) (cm)
D5 18 197.3 642.6 0.31
D1 16 110.8 571.2 0.19
D2 14 93.4 499.8 0.19
D3 22 205.1 785.4 0.26
D4 55 671.9 1963.5 0.34
Average Density = 0.258
Average Snow Water Equivalent (SWE) = 5.9 cm H2O
Average Snow Water Equivalent = 2.30 inches H2O
Average Snow Water Equivalent = 0.19 feet H2O
SWE = avg. snow depth*(density snow/density water)
Data entered by: Jeff Derry Date: 11/19/09
Data QA/QC by: Michael Lilly Date: 11/19/09
19APPENDIX C. Snow Depth Measurement Standard Operating Procedure
Below is a snow depth measurement procedure and is intended to be printed and inserted into
field notebook.
20SNOW DEPTH COLLECTION PROCEDURE
GW Watershed Scientific
OBJECTIVE: To collect snow depth measurements that best represent the surrounding area, in terms of
topography and spatial extent.
METHODS:
Site Selection
• For established, yet unmarked, sites, navigate to the point using a combination of knowledge from previous
field trips, landmarks detailed in fieldbooks and utilization of coordinates using a Global Positioning System
(GPS). Ensure GPS is WAAS enabled. The typical coordinate system is NAD 83.
• If there is not an established and marked site, then select a representative location for the area. Attempt to
capture natural snow variability, taking into consideration vegetation, topography, deposition patterns, and
melt patterns. When documenting site location, explicitly state the coordinate system used. Record
accuracy (error) if GPS reports it.
• If there is a meteorological station with a snow sensor, conduct snow measurements near sensor and in a
representative environment.
Snow Depth Measurements
• Snow depths are conducted in an “L” shaped pattern. Pick a direction (note on snow form), take depth
measurements, then turn 90 degrees and continue (noting direction on form). Orient the “L” pattern in the
same direction as done in previous visits.
• Snow depth measurements are taken every meter for twenty-five meters, turning 90 degrees, and
continuing for another twenty-five meters – for a total of 50 depth measurements. On a staked snow-course,
if the 25th sample is not at the corner stake, return to the corner stake before continuing with the 26th sample.
• Record depths to the half centimeter.
Field Forms
• Fill in all required information in the most current formatted field form (APPENDIX D), i.e. time, weather
conditions, location, personnel.
• Fill in all information while on site.
• Ensure information is noted as to vegetation type and amount. Example, “70% tussock tundra, 30% low
lying shrubs”.
• Copy and paste two photos of the overall sampling area in the field form. If photos are sent separately in
an e-mail, each image should be labeled according to location and date (year, month, day). As an example,
“FrankBluffs_070528.JPG”.
• Any and all conditions or observations please note on form.
• Include specific notes that will allow future personnel to conduct snow depth measurements at the same
location, with an “L” pattern oriented in the same direction. Besides noting cardinal directions, it is helpful
to note landmarks on the horizon for direction.
21APPENDIX D. Example Snow Depth Data Entry Spreadsheet and Filled in
Spreadsheet for Illustrative Purposes.
A blank formatted excel spreadsheet like the one shown below can be downloaded from the
Arctic Transportation Networks Project website. Following the blank spreadsheet is a real,
completed spreadsheet for illustrative purposes. An example spreadsheet can also be requested
from the main author of this report by contacting Jeff Derry at jderry@gwscientific.com.
22Arctic Transportation Networks Project
Snow Depth Form
Project ID: Site Location/Lake ID:
Survey Purpose: Determine Snow Depth Date: Time:
Location
Description:
Survey Weather
objective: Observations:
Latitude: Longitude: Datum:
Elevation: Elevation Reference
Datum: Markers:
Drainage Slope Vegetation
Basin: Direction: Type:
Slope Angle: Access Other:
Notes:
Snow Depth Probe Type:
Snow Measurement Team Names:
Snow Course Depths (cm)
1 2 3 4 5 (cm)
1 Average snow depth =
2 Maximum snow depth =
3 Minimum snow depth =
4 Standard variation =
5
6 (inches)
7 Average snow depth =
8 Maximum snow depth =
9 Minimum snow depth =
10 Standard variation =
Photographs of Sampling Area
Data entered by: Date:
Data QA/QC by: Date:
23The Excel entry spreadsheet is formatted to calculate summary statistics. An actual snow-course
form from an ATN project field campaign is shown below. A few items to consider:
• Cells highlighted in light green require information be entry from field person(s)
collecting the data. For some sites, much of this information – site name, survey
objective, coordinates, elevation, drainage basin, vegetation type – can be supplied to
field crew by ATN personnel and this information can be used for all subsequent
sampling for a given location.
• Cells highlighted in peach color are information automatically calculated in the
spreadsheet from the information supplied in the light green cells.
• “Slope Direction and Slope Angle” is intended to communicate if sampling was done
on a hill, and if so then the angle and direction of the slope estimated by field crew.
For sampling in the Coastal Region this will almost always be “Flat”.
• “Weather Observations” is the general conditions while sampling, including actual
temperature and wind values is not required.
• “Snow-Survey Team Names” is needed in case questions or clarification is required
for processing and analyzing the information.
• “Data Entered By and Data QA/QC” cells denotes the person who entered the data in
the spreadsheet and who double checked the entries and verified they are correct
based on what was recorded in the field book.
• “Reference Markers” refers to if the sampling is done at a marked location.
• “Other” is a good location to note anything that may be of interest or informative,
such as condition of snowpack, “snow extremely hard packed”, for example.
• Insert two photographs of general sampling environment (e.g. general landscape,
footprints showing sampling directions, drifting, weather conditions, etc) .
24Arctic Transportation Networks Project
Form F-012: Snow Survey Form
Project ID: ATN Site Location/Lake ID: L9312 - Tundra
Survey Purpose: Determine snow depth/SWE Date: 11/19/2009 Time: 9:00
Location On tundra on staked course, adjacent and north of L9312 weather station.
Description:
Survey Determine snow depth and density for application to lake recharge Weather Dark, cold
objective: studies, and tundra travel management. Observations:
Latitude: N 70° 19.995' Longitude: W 150° 56.918' Datum: NAD 83
Elevation: 7 ft Elevation BPMSL Reference Orange stakes
Datum: Markers:
Drainage Colville River Slope Flat Vegetation Lowland Wet Sedge Tundra
Basin: Direction: Type:
Slope Angle: Flat Access snowmobile Other: Snow pack was fairly
Notes: uniform, some slabbing
Snow Depth Probe Type: T-probe Snow-Survey Team Names:
Snow Tube Type: Adirondack Snow Tube
Jeff Derry, Jack (LCMF)
Snow Course Depths (cm)
1 2 3 4 5 (cm)
1 16.0 10.0 21.0 19.0 21.0 Average snow depth = 22.7
2 22.0 9.0 18.0 18.0 35.0 Maximum snow depth = 58.0
3 26.0 9.0 19.0 14.0 58.0 Minimum snow depth = 9.0
4 21.0 15.0 17.0 14.0 56.0 Standard variation = 12.6
5 47.0 18.0 10.0 10.0 51.0
6 22.0 20.0 19.0 21.0 45.0 (inches)
7 14.0 29.0 11.0 17.0 47.0 Average snow depth = 8.9
8 15.0 27.0 11.0 11.0 38.0 Maximum snow depth = 22.8
9 13.0 24.0 29.0 13.0 34.0 Minimum snow depth = 3.5
10 12.0 17.0 21.0 17.0 32.0 Standard variation = 5.0
Photographs of Sampling Area
Data entered by: Jeff Derry Date: 11/19/09
Data QA/QC by: Michael Lilly Date: 11/19/09
25You can also read