Short- and Long-Run Effects of a Sizable Child Subsidy: Evidence from Russia - IZA DP No. 13019 FEBRUARY 2020
←
→
Page content transcription
If your browser does not render page correctly, please read the page content below
DISCUSSION PAPER SERIES

IZA DP No. 13019

Short- and Long-Run Effects of a Sizable
Child Subsidy: Evidence from Russia

Ilia Sorvachev
Evgeny Yakovlev

FEBRUARY 2020

DISCUSSION PAPER SERIES

IZA DP No. 13019

Short- and Long-Run Effects of a Sizable
Child Subsidy: Evidence from Russia

Ilia Sorvachev
University of Wisconsin-Madison
Evgeny Yakovlev
New Economic School and IZA

FEBRUARY 2020

Any opinions expressed in this paper are those of the author(s) and not those of IZA. Research published in this series may
include views on policy, but IZA takes no institutional policy positions. The IZA research network is committed to the IZA
Guiding Principles of Research Integrity.
The IZA Institute of Labor Economics is an independent economic research institute that conducts research in labor economics
and offers evidence-based policy advice on labor market issues. Supported by the Deutsche Post Foundation, IZA runs the
world’s largest network of economists, whose research aims to provide answers to the global labor market challenges of our
time. Our key objective is to build bridges between academic research, policymakers and society.
IZA Discussion Papers often represent preliminary work and are circulated to encourage discussion. Citation of such a paper
should account for its provisional character. A revised version may be available directly from the author.

                                                     ISSN: 2365-9793

                                           IZA – Institute of Labor Economics
Schaumburg-Lippe-Straße 5–9                      Phone: +49-228-3894-0
53113 Bonn, Germany                             Email: publications@iza.org                                    www.iza.org
IZA DP No. 13019                                                                                                             FEBRUARY 2020

            ABSTRACT
            Short- and Long-Run Effects of a Sizable
            Child Subsidy: Evidence from Russia*
            This paper utilizes a large-scale natural experiment aimed at increasing fertility in Russia.
            Motivated by a decade-long decrease in fertility and population, the Russian government
            introduced a sequence of sizable child subsidies (called Maternity Capitals) in 2007 and
            2012. We find that the Maternity Capital resulted in a significant increase in fertility both
            in the short run and in the long run, and has already resulted in an increase in completed
            fertility for a large cohort of Russian women. The subsidy is conditional and can be used
            mainly to buy housing. We find that fertility grew faster in regions with a shortage of
            housing and with a higher ratio of subsidy to housing prices. We also find that the subsidy
            has a substantial general equilibrium effect. It affected the housing market and family
            stability. Finally, we show that this government intervention comes at a substantial cost:
            the government’s willingness to pay for an additional birth induced by the program equals
            approximately 50,000 dollars.

            JEL Classification:               J1, H1, I1
            Keywords:                         fertility, maternity capital, housing

            Corresponding author:
            Evgeny Yakovlev
            Department of Economics
            New Economic School
            Skolkovskoe shosse 45
            Skolkovo
            Moscow 143026
            Russia
            E-mail: eyakovlev@nes.ru

            * We thank David Card, Eric Berglof, Libertad Gonzalez, Piroska Nagy-Mohascji, Judith Shapiro, Hosni Zoabi, and
            seminar participants at the UC Berkeley, Free University of Berlin, LSE, LSE IGA, NES, NU, PSE, UPF, RLMS conference,
            2019 International Symposium on Contemporary Labor Economics, and NES anniversary conference for helpful
            discussions and comments. Tamara Arutyanyan provided outstanding research assistance. Ilia Sorvachev and Evgeny
            Yakovlev gratefully acknowledge financial support from the Russian Science Foundation for the research project No.
            18-18-00466. Part of the work on this paper took place when Evgeny Yakovlev was visiting the Institute of Global
            Affairs at LSE. The hospitality and congenial environment of the Institute are gratefully acknowledged.
1 Introduction
In all European and northern American countries fertility rates are below the replacement level (United
Nations, 2015, 2017). This concern has prompted most developed countries to implement large-scale and
expensive pro-natalist policies.
1 The eectiveness of these measures as well as the design of an optimal
pro-natalist policy remains a challenge.
This paper utilizes a natural experiment aimed at increasing fertility in Russia to address several important
open questions about the evaluation of these programs. The
rst is whether such policies can induce fertility
in the short-run and/or over a longer horizon. Pro-natalist policies may or may not have an eect depending
on whether providing
nancial or other support to families aects their fertility decisions; fertility may or
may not respond to these programs because the opportunity costs of childbearing are too high or because
fertility is driven by other factors like cultural attitudes. Even if a policy has an eect, the next question is
whether it results only in a short-run change in fertility that is driven by re-scheduling the timing of births
or also changes long-run (overall) fertility, i.e., aects the total number of children a woman would like to
have. While both short- and long-run eects are of interest (Bloom et al. 2009), only the latter changes the
future size of the workforce and a country's ability to
nance old-age bene
ts.
The next set of questions deals with further evaluation of the programs: What are the characteristics of
families that are aected by these policies? How costly, i.e. how much is the government paying per birth
that they induce? Finally, what are the non-fertility-related eects of these policies? Most existing studies
that analyze the eect of pro-natalist policies concentrate on fertility and mothers' labor market outcomes.
Due to their scale, however, these policies may have important general equilibrium and multiplier eects that
could in
uence economies both in the short run and long run (Acemoglu, 2010).
Motivated by a decade-long decrease in fertility and depopulation, the Russian government introduced a
sizable conditional child subsidy (called Maternity Capital). The program was implemented in two waves.
The
rst, the federal Maternity Capital program, was enacted in 2007. Starting in 2007, a family that
already has at least one child, and gives birth to another, becomes eligible for a one-time subsidy. Its size is
approximately 10,000 dollars, which exceeds the country's average 18-month wage and the country's minimum
wage over a 10-year period. Four years later, at the end of 2011, Russian regional governments introduced
their own regional programs that gave additional money - on the top of the federal subsidy - to families with
newborn children.
We
rst document that the Maternity Capital program results in a signi
cant increase in fertility rates
both in the short run (by 10%) and in the long run (by more than 20%). To identify the causal eect of
Maternity Capital in the short run, we utilize high-frequency (monthly and quarterly) data and use regression
discontinuity (RD) analysis within a relatively short time interval near the adoption of the child subsidies.
To
nd the long-run eect, we con
rm that the short-run shocks that were identi
ed in our RD analysis are
persistent over time by applying dierence estimators with various time trends. On top of that, we utilize
Dierence-in-Dierences estimators where we
rst employ variation in the levels of regional child subsidies
(regional Maternity Capital programs); and, second, employ dierences in intensity of treatment for second
and third children by parity relative to
rst-parity children. Finally, in a robustness check, we compare the
1 Eighty-four percent of developed countries have implemented various pro-natalist policies that cost on average 2.6 percent
of GDP (Milligan, 2005, Malkova, 2019, United Nations, 2015).
2
post-reform fertility growth in Russia with that of Eastern European countries that showed similar pre-reform
trends in fertility. All regressions show that the Maternity Capital resulted in long-term fertility growth.
The eects of the policy are not limited to fertility. Resulting in a reduction in the share of single mothers and
in the share of non-married mothers it also aects family stability. Additionally, the policy aects the housing
market.
2 In particular, we
nd that the supply of new housing and housing prices increased signi
cantly as a
3
result of the program. Con
rming a close connection between the housing market and fertility, we
nd that
in regions where the subsidy has a higher value for the housing market, the program has a larger eect: the
eect of Maternity Capital was stronger, both in the short and long run, in regions with a shortage of housing
and in regions with a higher ratio of subsidy to price of apartments (i.e., those regions where the real price of
subsidy as measured in square meters of housing is higher). Both results suggest that a cost-bene
t analysis
of such policies should go beyond their eects on fertility.
4 Ignoring general equilibrium issues may result in
substantial bias in the evaluation of both short and long-run costs and bene
ts of the program (Acemoglu,
2010).
Finally, we demonstrate that Maternity Capital is costly: our calculations show that the government pays
approximately 50,000 dollars per additional birth that is induced by the program.
The paper proceeds as follows. In the next section, we discuss the literature. Section 3 describes the
institutional environment of the Russian Maternity Capital program. Sections 4, 5, 6, and 7 present the
data, graphical illustration, short-run analysis, and long-run analysis for Russia. Section 8, 9, and 10 study
general equilibrium eects, changes in mother characteristics, and willingness to pay for an additional child
(WTP). Section 11 provides robustness checks. Section 12 concludes the paper.
2 Related Literature
Following the canonical theoretical model of fertility as an economic decision by Becker (1960), many papers
have tested empirically whether fertility responds to
nancial incentives or not. The evidence is mixed.
Gauthier (1996), Gauthier and Hatzius (1997), Acs (1996), Rosenzweig (1999), and Kearny (2004)
nd no
eect of pro-natalist policies. On the other hand, Malkova (2019), Cohen , Dehejia, and Romanov (2013),
Gonzales (2013), Milligan (2011), Lalive and Zweimüller (2009), and Slonimczyk and Yurko (2014)
nd
evidence that fertility follows
nancial incentives.
Most of these studies document only the short-run response to the policies. Adda, Dustmann, and Stevens
(2017), Sobotka and Lutz (2011), and Schoen (2004) argue that the documented short-run eect overestimates
the impact of pro-natalist policies because it is driven by the rescheduling of birth, but not by the decisions
of families to increase the overall number of children.
5 In particular, Adda, Dustmann, and Stevens (2017)
utilizes German data to show that the long-run eect of the pro-natalist policy is smaller than the short-run
response. In our case, the policy aects both short- and long-run fertility. In this respect, the closest paper
2 The recipients of the subsidy can use it only on three options: housing, the child's education, and the mother's pension.
Eighty eight percent of families use it to buy housing. For more details, see section 3.
3 This result also identi
es those who are penalized by the program: home-buyers who did not plan to have a new baby, suer
from the rising costs of housing.
4 While most of the studies that analyze the eect of pro-natalist policies concentrate on fertility and labor market outcomes,
our study shows that the eect of these large-scale policies may go far beyond this scope.
5 Another potential driver initial short-term eect of the program comes from additional births in a large pool of families that
have parents from older-age cohorts who decided to have one more child.
3
to ours, Malkova (2019), documents the (long-run) rise in second and higher parity completed fertility rates
in response to a maternity program in the Soviet Union. In our study, we provide evidence from the market
environment that allows us to get more external validity of our results as well as to analyze a broader set
of important outcomes that would be impossible in a closed non-market socialistic economy.
6
Second, while most of the previous studies concentrate on the eect of pro-natalist policies on fertility and
mothers' labor market outcomes, ours shows that the eects of these large-scale policies may go far beyond
this scope. We provide an example of the importance of the general equilibrium eects for policy evaluation,
which contributes to the existing discussion (Acemoglu, 2010). Finally, by demonstrating the sizable eect
of the program on the housing market, our paper shows a strong connection between childbearing decisions
and housing (Lovenheim and Mumford, 2013, Dettling and Kearney, 2014).
3 Institutional Environment: The Russian Maternity Capital Pro-
gram
The Russian federal Maternity Capital program became eective on January 1, 2007. Families that adopted
or gave birth to a second or higher birth order child became eligible for a one-time subsidy of 250,000 rubles
(10,000 dollars), an amount that exceeds the country's average 18-month wage. This amount is updated
annually to account for in
ation (see Figure 1 for the ruble and dollar amount of Maternity Capital). Families
do not receive the money in cash. Instead, they receive a certi
cate that can be used only to pay for three
options: improvement to current living conditions, (i.e., for housing, including existing mortgages), their
child's college education, and the mother's pension.
7 The money from this certi
cate is transferred directly
from the pension fund (the administrator of the program) to the education facility or the home seller or
mortgage holder. The subsidy is granted only once per family. According to the initial (2007) version of the
Maternity Capital law, a family could utilize the Maternity Capital certi
cate money only after their child
reaches two years of age. Since December 2008, the family can use the Maternity Capital subsidy to pay for
a mortgage immediately after the birth of a child.
Of the three options (housing, education, pension), 88% of the families spend their subsidy on housing. One
of the reasons for this is that the option of buying a house (or apartment), in contrast to other options,
can be realized shortly after the birth of a child. An important restriction that we will explore further, is
that using the certi
cate to buy an apartment requires that the child automatically becomes it's co-owner.
This makes the apartments less liquid. In particular, if a family decides to sell the apartment, it will need
to comply with the regulations of guardianship and trusteeship bodies. As a result, some families, mainly
buyers of expensive apartments, prefer not to use Maternity Capital.
8 The other important feature of the
Maternity Capital program is that it was unanticipated by the public until October 2006 (see Slonimczyk
6 Russia's socialistic economy has several important distinguishing features. Housing is free in the USSR and the costs of
raising children is low: every family has access to free childcare, healthcare, a high school, and college education. The opportunity
cost (of raising children) is also low: the earning pro
le was
at and women are guaranteed their jobs back following a maternity
leave (Malkova, 2019).
7 In 2014, the option of using Maternity Capital to pay for pre-school also became available (see the comment to Federal Law
14.07.2014 N 648).
8 Also, the government applies additional restrictions to ensure that families use their Maternity Capital to improve current
living conditions, but not to make investments. Thus, although they can use Maternity Capital to buy housing, recipients can
not use it to buy relatively cheap alternatives like, land or a summer house (dacha).
4
and Yurko, 2014), when the bill creating it was introduced to the State Duma (Parliament).
In the
rst 12 years after the adoption of Maternity Capital, 8.9 million families received Maternity Capital
certi
cates, and 5.1 million families used the subsidy in its entirety; 3.3 million families used Maternity
Capital to pay for a mortgage, while more than 1.9 families used it to pay for housing without using a
mortgage.
Since the start of the Maternity Capital program, many Russian regions (states) have also adopted laws that
oer families a subsidy additional to the federal program. Two regions adopted Maternity Capital programs
in 2008. At the end of 2010, Russian President Dmitry Medvedev requested that regional governments adopt
local child support programs. In most of the other regions, laws were passed in the second half of 2011 and
came into force in 2012. By 2012, 87% of the regions had adopted an additional subsidy, averaging about
25% of the federal subsidy. The amounts of regional subsidies vary, from 0 to 108% of the federal subsidy.
The programs also vary across regions in other dimensions: 1) by which children are eligible: most of the
programs (85%) give a subsidy for the third and higher birth order child, yet one region gives it for the
rst child, three for the fourth and two for the
fth child; 2) by restrictions on the use of a subsidy: many
regional programs give unconditional subsidies in cash, some restrict it usage (legitimate expenditures include
housing, education, taxes, pension, medical spending, insurance, rental expenses, and cars); and 3) by which
families are eligible: in some regions only families with an income below a certain threshold are eligible for a
regional subsidy.
Initially, both the federal and regional Maternity Capital programs were set to last for 10 years expiring
January 1, 2017. This timing was unchanged until the very end of program. Hovewer, in 2016, government
extended federal program until 2018. In 2018 federal program was extended again until 2021. Most of the
regional programs were extended initially until 2018, and then until 2021. Also, starting from 2016 the
nominal (ruble) value of subsidy was not updated to account for in
ation.
4 Data
In our study, we utilize several datasets.
First, we use regional (state) level data on various regional characteristics from the Russian Statistical Agency,
Rosstat and the Russian Fertility and Mortality Database (RFMD).
9 This data includes monthly counts of
births at the national and regional level. The Russian Fertility and Mortality Database contains annual data
on age-speci
c birth rates for all Russian regions, and on the birth rates by birth order for a half of the
regions. The Rosstat data provides dierent regional data with an annual and/or quarterly and/or monthly
frequency. In particular, the data on regional birth counts is available monthly, whereas the data on regional
housing prices is available quarterly, and that on the amount of new housing only on an annual basis.
Second, we use the 2010 Russian census and 2015 Russian micro-census provided by Rosstat.
10 Such data
can be obtained in the form of counts of individuals within narrow groups de
ned by a set of demographic
and regional characteristics. For our purposes, we extract several samples. The
rst sample contains counts
of children born in a particular month and year, by a mother of a particular age, and living in a family with k
9 For details see Rosstat web-site (www.gks.ru) and the Russian Fertility and Mortality Database web-site
(http://demogr.nes.ru/en/demogr_indicat/).
10 Data extracts from the Census were executed several times within a period from September, 2017 until April, 2019.
5
children (k =1,2,..). The second sample contains counts of children within a particular county (rayon), born
in a particular month and year, living in a family with k children (k =1,2,..), and living in a family with one or
two parents. The third and fourth samples provide the same counts but aggregated at the state (region) and
national levels, respectively.
11 Thus, rayon-(or region-) level datasets contain monthly data on the number
of children that were born in a particular month and year in families with one, two, three or more children
(including newborns) for families with either a single parent or with two parents for 2,351 of Russian rayons
(or 85 regions) for the period of 2000 to 2010 (2010 is a census year). The obtained datasets contain 2,857,200
and 160,200 cells (observations) in rayon- and region-level data, respectively. In addition to the 2010 Census,
we utilize data on the 2015 Russian micro-census that surveys 1.7 percent of the population. Due to size
limitations, we extract counts not on monthly, but quarterly birth date frequency. Census (micro-census)
data on monthly birth rates are richer compared to Rosstat: in particular, using census data we can calculate
monthly birth counts by parity, by mother age, as well as by other demographic characteristics. However, the
census provides retrospective information on counts of births based on information obtained in 2010 (2015),
thus some births are missing due to child mortality. Consequently, for our regressions, we use both Rosstat
and census data.
12 In addition to aggregate counts discussed above, the 2010 Russian census is available
at the individual level for the sub-sample of 7 million people. Unfortunately this individual-level dataset
does not contain many variables important for analysis so we are restricted to using it only for a supportive
analysis.
Third, we utilize individual-level data from the Russian Longitudinal Monitoring Survey (RLMS).
13 The
RLMS is a nationally-representative annual survey that covers more than 10,000 individual respondents from
1994 to 2015. The RLMS survey contains rich information on demographic and socioeconomic characteristics.
The RLMS has data on the date of birth and birth order, as well as various demographic and socio-economic
characteristics of children and their families. In our analysis, we restrict the time span of the data to the
years 2000-2015. The year of the adoption of Maternity Capital lies in the middle of this period.
Finally, to do a national-level analysis and cross-country comparisons, we use the Human Fertility Database
(HFD) provided by the Max Plank Institute for Demographic Research (MPIDR) and the Vienna Institute
of Demography.
14 The HFD contains annual country-speci
c data on age-speci
c birth rates, on the birth
rates by birth order, as well as monthly counts of births.
The summary statistics of variables used in the analysis are shown in Table 1.
Birth Rates Variables and Data Used. For short-run analysis, we use monthly-level data in the main
speci
cation. Monthly counts of births are available at national and regional level, thus we utilize national
and regional-level data, and use log counts of births in the main speci
cation. In the robustness section, we
construct data on the population of females of childbearing age by smoothing out available annual-level data
and use constructed log fertility rate (log number of births divided by the number of females of childbearing
age) instead of log number of births. For within-country long-run analysis, we use available regional- and
national-level annual data on a log of age-speci
c fertility rates.
15 For a cross-country case-study, we use
11 There are 2,351 rayons and 85 regions in Russia.
12 Results of regressions are similar for all datasets.
13 See https://www.hse.ru/en/rlms/
14 See http://www.fertilitydata.org/ and http://www.humanfertility.org/cgi-bin/main.php
15 Data on age-speci
c births are available monthly only for retrospective 2010 Census data; thus we do not use them in the
short-run main speci
cation, and we do use them in robustness analysis.
6
data on age-speci
c fertility, total fertility rate, cumulative fertility rate, and tempo-adjusted fertility rates
that are available on the country level (for de
nitions, see note 1 in Appendix).
5 Graphical illustration
Figure 2 illustrates the eect of Maternity Capital on birth rates.
Panel A shows monthly data on the number of births using 2010 Census retrospective data. Panel B shows
monthly birth rates using Rosstat data for the 2003 to 2016 period. It shows both rough counts and de-
seasoned data to control for seasonality in birth rates. All graphs indicate jumps in the number of births
in July 2007, nine months after the announcement of the federal program, and in 2012, when the regional
programs were introduced.
Panel C shows annual data on the total fertility rate (TFR) for 2002-2017. It shows an increase in TFR both
in 2007 and 2012. Overall, TFR gew Panel C also shows a drop in fertility rates in 2017 (when program
initially were expected to end)
16 , compared to 2016; yet, the TFR in 2017 exceeds that in pre-reform 2006
by more than 25%.
Panel D shows, perhaps, the most striking illustration of the reform. It shows the eect of Maternity Capital
on the growth of births of second and higher parity children relatively to births of
rst children. Recall that
second and higher parity children are eligible for federal child subsidy, whereas
rst-parity children are not.
In addition, third parity children are those who are eligible for the most regional child subsidies. Panel D
shows
rst that the ratio of births of second and higher parity children relatively to births of
rst children
was stable for a decade before 2007, and then it increases by more than 50%.
6 Short-Run Eect on Fertility
6.1 Short-Run Eect of the Federal Maternity Capital Program
The main challenge in the analysis of the eect of a universal natural experiment like the introduction of
federal Maternity Capital is to choose a credible counterfactual.
17 One credible solution is to employ an
RD design that resembles perfect randomization in the neighborhood of the threshold and does not rely on
a control group. The RD approach estimates the local treatment eect that we interpret as the short-run
eect.
In our RD strategy, we compare fertility rates within a short time interval before and after the introduction
of the Maternity Capital program. For the federal Maternity Capital program, we treat October 2006,
the o
cial date of the announcement of the program, as the threshold date for conception decisions (see
Slonimczyk and Yurko, 2014). This means that we treat July 2007 as a threshold month for realized birth
16 Initially, both the federal and regional Maternity Capital programs were set to last until January 1, 2017. This timing of the
program was unchanged until the very end of program, and thus formed expectations of families regarding timing of subsidy.
17 For example, the option to use Dif-in-Dif approach and families that give birth to their
rst child as a control group would
be an imperfect solution because the program may facilitate birth rates of the
rst child too.
7outcomes.
18 For the regional Maternity Capital programs, we treat January 2012, the start of the majority
of those programs, as the threshold date for realized birth outcomes.
19
To estimate the eect of Maternity Capital in the short run we employ several speci
cations.
Our baseline regression uses the following
exible RD speci
cation
0
Yrt = θI(t ≥ 0)rt + f (t) + g(t) ∗ I(t ≥ 0)rt + Drt Γ + urt (1)
where t is date (year + (month − 1/12)) normalized to be 0 at the threshold dates discussed above, f (t)
and g(t) are the smooth functions of time, g(0) = 0, and Yrt stands for the dependent variable (log births);
because birth rates are seasonal we include the set of controls Drt that contains the month
xed eects to
control for seasonality. In all regressions, we use the triangular kernel; f (t) and g(t) are parametrized to be
rst-order polynomial, and the error terms urt are clustered at the date level. The parameter of interest θ
stands for the eect of Maternity Capital. We estimate the model using monthly data on national-, regional-,
and rayon-level cells. The baseline speci
cation uses data at the national-month level. In addition, we show
results for regional-, and rayon-level cells to be consistent with further elaboration of our results in which we
utilize regional and rayon heterogeneity in the eect of the program. The subscript r in regressions refers to
the cross-sectional dimension (national, regional, or rayon), and the subscript t refers to time (date). The
bandwidth was set to be 3 in the baseline speci
cation.
20
Table 2 shows the results of the RD estimates of the eect of Maternity Capital on birth rates.
21 Panels
A, B, and C display the results of the RD regressions at national×month bins, regional×month bins, and
rayon×month bins, respectively. All panels indicate that Maternity Capital results in a 9% increase in birth
rates. The subsidy aects the birth rates of second and higher birth order children more. While the fertility
rate for the
rst child increased by 7%, fertility rates for second, third and higher birth order children
increased by 12%, and 15% correspondingly.
22 Interestingly, the results suggest that reform increases birth
rates not only for second and higher parity children that are eligible for a subsidy, but also for
rst children.
We see two dierent explanations for this. First, for a family that preferred to be childless before the reform,
it became bene
cial to give birth for two children and thus become eligible for a Maternity Capital subsidy.
As a result, some couples opted to have a
rst child. A second explanation the Maternity Capital program's
massive promotional campaign encouraged some pursued childless couples to start families. Indeed, recent
18 The threshold time point in decisions in the housing market is similar to conception decisions, i.e., the threshold date is
October 2016. In the housing market, one can buy housing using a mortgage before obtaining the Maternity Capital certi
cate
and then, after getting Maternity Capital, use it to pay a mortgage.
19 Recall that information about regional Maternity Capital programs became publicly available within a year before January
of 2012.
20 Figure A1 in Appendix shows RD estimates for dierent bandwidth sizes. The estimates are the same for bandwidths
greater than 1.5. We treat speci
cation (1) as primary because it is more
exible. In particular, in this speci
cation, we can
control for seasonality or can estimate the heterogeneity of the Maternity Capital eects with respect to initial housing prices.
In the robustness section, we use the data-driven bandwidth selector and RD estimator by Calonico, Cattaneo, and Titiunik
(2014) to con
rm our main speci
cation results.
21 Figure 3 shows the short-run eect of the federal Maternity Capital program for the births of dierent parity. Figure A2 in
Appendix and Figure 1 (Panel D) show the eect of Maternity Capital on total fertility rate (TFR) and on the decomposition
of births using annual data for the period until 2017. Both
gures show that Maternity Capital aects births of second and
higher parity children more.
22 Columns 1 and 2 of Panels A and B show results for two data sets, Rosstat (RFMD) and the 2010 Census. Rosstat and
HFD provide monthly counts of births at the date of birth. Census data provide retrospective information on monthly counts
of births based on information obtained in 2010, and thus some births are missing due to child mortality. The results shown in
columns 1 and 2 are similar.
8literature provides many examples in which fertility decisions are sensitive to persuasion (see Bassi and Rasul,
2017, Chong, Duryea, and Laferrara 2012).
It should be noted that the observation that fertility jumps with the introduction of a child subsidy is not
limited to Russia. Section 5.3 provides an example of an increase in fertility after the introduction of a
child subsidy in Ukraine that (importantly) happen in dierent time. Moreover, Gonzales (2013) documents
both a jump in conceptions and drop in abortions after the introduction of a child subsidy in Spain.
23 To
further con
rm that our results are not driven by a choice of regression speci
cation or choice of variables,
in Section 10 we provide various robustness checks where we estimate a model using dierent measures of
fertility, utilizing data on age-speci
c data fertility rates, as well as applying an alternative to our main
speci
cation robust RD estimator by Calonico, Cattaneo, and Titiunik (2014). Results are similar to our
baseline regressions. Finally, in Section 5.3 we use placebo experiment to show that jumps in fertility in
Russia coincides with the introduction of Maternity Capitals.
Yet, there are several possible concerns regarding the use of an RD strategy in this set-up. First, couples
that gave birth before 2007 may try to falsify declared birth date to change it to later time. However, this
concern is not relevant in because jump in fertility occurred in July 2007, half a year after the Maternity
Capital program was initiated.
24 Second, while we have information on dates of birth, exact conception dates
are unknown. Therefore, using the rule that conception occurred nine months before the birth date provides
noisy information on the exact conception dates, resulting in attenuation bias. Third, while one can expect
to see an immediate eect of the program because it encourages conceptions and discourages contraception
use and abortions, many couples are not immediately successful when they try to conceive. In particular,
the literature suggests that it usually takes three to six months for a couple to conceive when actively trying
(see Gonzales, 2013). There is also a chance that general knowledge of the reform is not immediate, resulting
in a transitional period in the implementation of the reform, and then RD regression may underestimate
the short run eect. To deal with this issue, we propose a robustness check where we allow for a narrow
six-month transitional period between the initial announcing date and full realization of the program. This
approach is similar to Clark and Del Bono's (2016) and assumes that there is a sharp increase rather than
jump in the probability of treatment across the borderline dates.
25 The exact speci
cation is as follows:
0
Yrt = θT R(t)rt + f (t) + g(t) ∗ I(t ≥ 0)rt + Drt Γ + urt (2)
The treatment variable T R(t)rt equals one for birth dates after September, 1, 2007, and zero for dates
before March, 1, 2007, and increases linearly from 0 to 1 in a half-year period between March, 1, 2007, until
September, 1, 2007. The set of controls and size of bandwidth are the same as in (1). Error terms are
clustered at the date level.
Panel D shows the results of this regression using national-level data. Compared to RD estimates the
estimated eect in (2) is on average 1.5 percentage points higher: the fertility rate increased by 10.6%, 7.7%,
23 Unfortunately, we do not have access to monthly or quarterly data on abortions, and thus could not provide similar RD
estimates. Annual data (that is available) shows that the abortion rate, which is relatively high in Russia, has been falling
for the whole time span of our analysis. The ratio of abortions to births is 1.8 in 2000, decreases to 1.1 in 2006, and further
decreases to 0.45 in 2015.
24 Also, today it is almost impossible to falsify birth dates for more than a couple of days. Registration of birth date takes
place immediately after birth and directly in hospital where a mother gives birth.
25 The other option is to apply applications RD design to the situation in which the discontinuity point is unknown (see, for
example Card, Mas, and Rothstein, 2008, van der Klaauw, 2002, Porter and Yu, 2015)
913.6%, and 16.5% for all births and for births of
rst, second, third and higher parity children, respectively.
Next, to con
rm a close relationship between the housing market and fertility, we explore the regional (and
rayon-level) heterogeneity in the eect of the Maternity Capital program. The vast majority of families use
federal Maternity Capital to buy housing.
26 Thus, one can expect that in regions with a housing shortage,
the demand for Maternity Capital would be higher. We then compare the eect of the program in regions
with high- and low-priced housing. The average price of apartments varies greatly across Russian regions: in
2007, with Maternity Capital funds one could buy a 20-square-meter apartment in the North Ossetia region,
whereas in Moscow one could buy only 2.4 square meters. Given that buying apartments using Maternity
Capital is accompanied by future legal costs (see Section 3), it is reasonable to expect that the eect of
maternity capital will be greater in places with lower housing prices (or, equivalently, the higher real price of
Maternity Capital). To check the dierential eect, we add pre-reform regional characteristics, the shortage
of housing and housing aordability, and their interactions with the program dummy I(t ≥ 0)rt in regression
(3).
Yrt = θI(t ≥ 0)rt + γI(t ≥ 0)rt (Zrt0 − Zrt0 ) + µZrt0
0
(3)
+f (t) + g(t) ∗ I(t ≥ 0)rt + Drt Γ + urt
In this regression, Zrt0 stands for pre-reform regional characteristics (in 2006), the availability of housing
is de
ned as the average square meters of owned housing per person in the region, and the aordability of
housing is the size of an apartments that can be purchased using Maternity Capital.
Panel A of Table 3 shows the results of the estimation. In regions with a shortage of housing or more
aordable housing, the eect of Maternity Capital is greater. The eect is economically high: in regions
where the price of an apartments and the size of the living area are one standard deviation lower than the
mean, fertility increases by an additional 2.8 and 2 percentage points, respectively (compared to an average
increase of 8 pp). We
nd a similar dierential eect caused by the program when we explore heterogeneity
at the rayon level. Panel B shows that in rayons where the average number of rooms in apartments per
household is one standard deviation lower than the average the growth in fertility is 3 pp higher.
Next, we check whether economic and social factors (average wage, unemployment rate, migration, and
crime) as well as age distribution in the female population do not change discontinuously at the time of the
introduction or announcement of Maternity Capital. This test serves as a validity check for the RD strategy.
If the timing of shocks in income or other factors coincides with the introduction of Maternity Capital, then
factors other than Maternity Capital may drive the results. Figure 5 shows the results of the RD estimates
for dierent placebo threshold dates: there are no statistically signi
cant discontinuous changes in economic
factors in October 2006 (the announcement date of the Maternity Capital program) or in July 2007 (the date
of the increase in birth rates).
6.2 Short-Run Eect of Regional Maternity Capital Programs
We further provide a similar analysis of the short-run eects of the 2012 wave of regional Maternity Capital
programs. We treat January 2012, the starting date of the majority of the programs as the threshold date for
26 Figure 4 plots birth rates over time for various Russian regions. Indeed, it shows that in rich regions such as Moscow there
is no visible eect of Maternity Capital, whereas in less wealthy Russian regions, like Bryansk, Nizhniy Novgorod, Tatarstan
the eect is sizable.
10realized birth outcomes. The speci
cation of the RD regression is similar to (1), where the running variable
t is normalized to be 0 in January 2012.
Table 4 shows the results of the RD estimates of the eect of regional Maternity Capital on birth rates.
Panels A and B display the results of the RD regressions at the national and regional levels. All panels
indicate that regional Maternity Capital results in a further increase in birth rates by 4.7%. The regional
programs primarily aect births of
rst and third order children (by 5.4%, and 5.7%, respectively) because
the majority of these programs were designed to induce births of children of this parity. Similar to the
analysis of the federal program, we provide a robustness check by allowing for a six-month transitional period
of implementation of the reform (see equation (2)). Panel C shows the results of this estimation: that
magnitude of the eects is 1 pp higher.
6.3 Validity Check: Ukraine Case Study
In this section, we discuss the case study of Ukraine, which provides an additional validity check for RD
results. The RD estimates would show a spurious eect if the introduction of Maternity Capital coincides
with some unobservable economic or social shock that also aects fertility. Although we already checked
this possibility by showing that no other factors changed discontinuously around the threshold date, the
Ukrainian case study provides an additional validity check. Facing similar demographic challenges, Ukraine
also introduced a sizable child subsidy, but at a dierent time (one year later than Russia). This allows us to
explore the eect of timing in the introduction of the subsidy to see if fertility responded dierently in the
two countries after the subsidy was introduced.
Ukraine signi
cantly changed its child support policy twice. The
rst policy change was in April 2005, when
the government introduced a one-time child bene
t of 8,500 UAH (1,700 dollars). The second increase in
child bene
ts was introduced in the Ukrainian Rada (Parliament) on October 2007 and became eective in
January 2008. According to the new policy, a family that gives birth to a
rst, second, and third or higher
birth order child receives a child bene
t of 12,240 UAH, 25,000 UAH, and 50,000 UAH (2,500, 5,000, and
10,000 dollars), correspondingly. In contrast to Russia, the subsidy in Ukraine can be used for any purpose.
Figure 6 displays monthly data on the number of births in Ukraine. It shows a jump in fertility rates in
July 2008, nine months after the announcement of the child subsidy. Table A1 shows the results of the RD
estimates of the eect of the subsidy on birth rates. It shows, that the subsidy had a sizable immediate eect
on the birth rate in Ukraine: it resulted in an immediate increase in the birth rate of 8%.
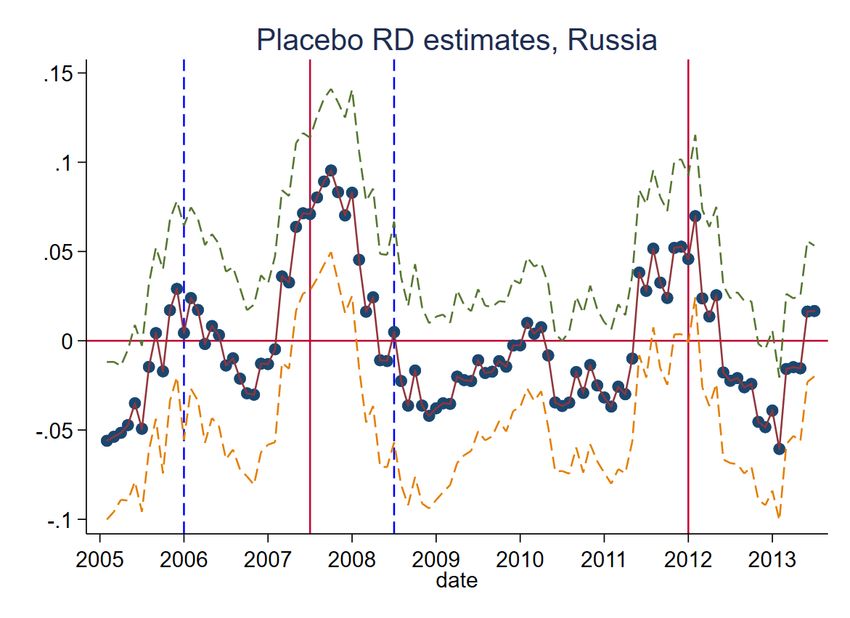
To demonstrate that Ukraine and Russia experienced shocks at fertility at dierent points in time, we run
placebo experiments. We estimate placebo RD coe
cients for a jump in fertility within dierent placebo
threshold dates that vary from January 2006 till 2010. Figure 7 shows the results of placebo experiments for
both Ukraine and Russia. The placebo RD coe
cients plot for Russia shows an inverse U-shape with peaks
in July 2007. The placebo RD coe
cients plot for Ukraine shows two peaks that happen in January 2006
and July 2008.
Thus, we show that the jumps in birth rates in Ukraine and Russia coincided with the changing child policy in
these countries.Since the dates of the initiation of their Maternity Capital programs are dierent, we provide
additional evidence that these increases are driven by the change in child support policies and not by random
economic or social shocks (that would have been likely to hit both neighbor countries at the same time).
117 Long-Run Eect on Fertility
We establish evidence of the long-run eect of the program in several steps.
First, using series of dierence-in-dierence regressions we show that 1) reform resulted in highe long-run
growth in birth rates of second and third children by parity relative to births of
rst-parity children; 2)
total fertility grew faster in regions with a higher regional subsidy. Second, in within-country analysis we
show that an initial short run change in fertility does not vanish, but rather increases over time. Third,
we provide indirect evidence to show that the re-scheduling motive is not a driving force in the observed
change in fertility. We demonstrate that the time between children as well as the age of the mother did not
decreased as a result of the reform, and at that the desired number of children signi
cantly increased. Forth,
for a robustness check, we compare the long-term growth in fertility in Russia with Eastern and Central
European countries that have similar initial trends in fertility and face similar economic conditions. Finally,
using our regression estimates, we simulate the eect of Maternity Capital on completed (long-run) cohort
fertility rates and show that the reform already increased completed cohort fertility for a sizable of Russian
women.
7.1 Dierence-in-Dierence Analysis
7.1.1 Births of second and third children by parity relative to
rst-parity children
Next, we check how the reform aects birth rates for second and third children by parity relative to births
of
rst-parity children. Second and higher parity children are eligible for federal child subsidy, whereas
rst-
parity children are not. In addition, third parity children are those who are eligible for the most regional
child subsidies. Therefore, one would expect these program to aect births of higher parity children more,
and indeed, Panel D of
gure 1 already demonstrated an signi
cant increase in ratio of births of second and
third children by parity relative to
rst children.
Yet, comparing the relative growth of birth rates by parity would not allow us to quantify the net eect of
Maternity Capital because, as we already argued, Maternity Capital could have an indirect eect on births
of
rst children too. Our previous analysis con
rms this argument by showing an increase in births of
rst
parity children as well. However, we still can infer the causal eect of the intensity of the treatment eect
under the assumption that births of second and third parity children bene
ted more from the program than
those of
rst children. To estimate the eect of the intensity of treatment we use national-level data on
age-speci
c birth rates for births of
rst, second or third children and use the following Dif-in-Dif regression:
Yapt = γ21 I(year ≥ 2007)I(parity ≥ 2) + γ22 I(year ≥ 2012)I(parity ≥ 2)
(4)
δt + δap + t ∗ δap + uapt
where Yart stands for the log of the fertility rate of mothers of age a, for children of parity p, at year t.
Parameters of interest γ21 and γ22 remain for a relative (in comparison to births of
rst children) increase in
births of second and third children after the 2007 and 2012 reforms, respectively. δt , δap , and t ∗ δap remain
for time
xed eects, age×parity
xed eects, and age×parity-speci
c time trends. Errors are clustered at
the age∗parity level.
12Panel B of Table 5 reports the results of regression (5). Column 1 shows a sizable relative increase in second
and higher parity children after 2007 and after 2012. Births of second and third children by parity increase
by 12% after 2007 and then further increase by 6% after 2012, resulting in a total increase in fertility rate
by 18%. Column 2 shows no statistically signi
cant dierent in per-reform trends in fertility. In addition,
column 3 reports results of the regression where we estimate relative growth in fertility separately for second
and third-parity children.
27 It shows a relative (to births of
rst children) increase in third parity children
by parity after 2007 and after 2012, and an increase in birth rates of second parity children after 2007. These
estimates are consistent with observation that Federal Maternity Capital program gives a subsidy for the
second and higher parity child whereas most of the regional programs give a subsidy for the third child by
parity.
7.1.2 Cross-regional evidence
To elaborate further on the eect of Maternity Capital programs, we utilize the dierences in regional subsidies
in a Dierence-in-Dierence analysis. As was discussed in Section 3, regional programs vary by size. Besides,
while most of the Russian regions introduced their own Maternity Capital programs in 2012, some were
initiated in 2008, and in some regions, there were no programs at all. Thus, we explore both dierences in
the size of subsidies and timing of the regional programs.
Now, we analyze the eect of the programs over the long-run period rather than immediate eects documented
in Sections 5.1 and 5.2: we estimate the eect of the programs until the last year of available data, 2017. The
demographic literature that analyzes fertility over long-run time horizons suggests accounting for changes in
age distribution among the female population (see, for example, Schoen, 2004).
28 To deal with this issue, we
utilize data on age-speci
c fertility rates and use the mother's age-speci
c time trends to control for possible
demographic changes in the female adult population. We utilize data on birth rates from 2000 to 2017 and
use the following Dif-in-Dif regression:
Yart = γSrt +
0
(5)
+δt + δa + t ∗ δa + δr + t ∗ δr + Drt Γ + uart
where Yart stands for the log of the fertility rate of mothers of age a, in a region r, at year t. To make the
results comparable with Section 5.1, we normalize the regional subsidy by the size of the federal one: Srt
stands for the ratio of the regional child subsidy to the subsidy that is given by the federal Maternity Capital
program. In our data, Srt varies from 0 (region does not give a subsidy) to 1.09 (region gives a subsidy that
exceeds the federal one by 9%). The parameter of interest, γ , shows an additional eect of a regional program
in a region that introduces a subsidy that exceeds the average regional subsidy by an amount equal to the
federal Maternity Capital. Further, δr , δt , δa , t ∗ δa , and t ∗ δr stand for regional, year, mother age
xed
27 The regression speci
cation in this case is following: Yapt = I(year ≥ 2007) ∗ (γ21 I(parity = 2) + γ31 ∗ I(parity =
3)) + I(year ≥ 2012) ∗ (γ22 I(parity = 2) + γ32 I(parity = 3)) + δt + δap + t ∗ δap + uapt . Control variables and error structure
are the same as in regression (4).
28 For example, Figure A3 in the Appendix shows that the size of a young cohort of the female population starts decreasing in
the late 2010s whereas the size of the older cohort increases. If younger women have dierent fertility rates compared to older
women then the change in age distribution may bias aggregate estimates of the eect of reforms. Recall that this concern would
not contaminate the RD analysis because the size of the female population did not change discontinuously at the time of the
introduction of subsidies (see Figure 5). To con
rm this, in the robustness section we show that RD estimates for age-speci
c
birth rates are similar to the main RD speci
cation.
13eects, mother-age-speci
c, and regional time trends respectively. The set of control variables Drt includes
log average income and housing availability in a region. Errors are clustered at the regional×year level.
Next, similar to the short-run estimates, we check that Maternity Capital has a stronger eect on the fertility
rates in regions with a shortage of housing options and the higher relative price of federal Maternity Capital
(relative to the local price of housing). To test this prediction, we use a similar Dif-in-Dif speci
cation and
include the interaction of these variables with I(year ≥ 2007)rt .29 Note that one can interpret variation in
the relative price of Maternity Capital as variation in the real price of federal Maternity Capital (in terms
of housing), and thus treat these estimates as additional Dif-in-Dif estimates of the eect of the real price of
federal Maternity Capital.
Panel A of Table 5 reports the results of the regressions. Column 1 shows the results of the baseline spec-
i
cation. It shows that in a region that gives Maternity Capital of the same size as the federal one, the
average fertility rates grew by 7.3%. Columns 3 to 5 show the results of the regression after excluding time
trends. All columns show an eect that is similar in magnitude.
30 Column 2 shows that, in regions with
lower availability of housing and regions with higher relative prices of Maternity Capital, the eect of the
programs on birth rates is greater: in regions where the housing price and the size of the living area are
one standard deviation lower than the mean, fertility increases by an additional 4.2 and 5 percentage points,
respectively.
Columns 6 to 9 show the results of regressions in which we check the parallel trend assumption. To do so, we
take pre-reform years and regress pre-reform birth rates on the time trend multiplied by the level of a (future)
regional subsidy (controlling for time trends and the same covariates as in (4)). This interaction term, S r ∗ t,
shows the dierential time trends in birth rates in regions that give dierent subsidies. Column 6 shows the
result of a regression where we use a sample of all regions in the 2001 to 2007, before all Maternity Capital
programs started. Column 7 shows the result of a regression where we look at all years, but look only on
those regions and those years where there was no subsidy. Columns 8 and 9 check the robustness of results
where additional time trends included in the regressions. Columns 6 to 9 show no dierence in pre-reform
trends in fertility.
7.2 Cumulative Eect
While previous sections documents separately several eects of the Maternity Capital programs, the cu-
mulative long-run eect of these policies may dier from the simple summation of these eects for several
reasons.
On one hand, the cumulative eect may be smaller than the sum of short-run eects because of a re-scheduling
eect and because of the selection (to compliers) at the initial stage of the program. Parents respond to the
introduction of Maternity Capital by re-scheduling a birth to coincide with the time when the policy is
eective rather than by increasing their total number of children they want to have. Also, the program in
29 The set of additional control variables D includes the same variables as in (4) plus housing aordability and interaction
rt
of log average income with the federal program dummy.
30 In the robustness section, we will also look at births by birth order. Unfortunately, the regional-level data on parity-speci
c
birth rates has an important limitation: while the data on all birth rates (without parity) is available for all regions and for the
whole time horizon 2000 to 2017, the regional-level data on parity-speci
c birth rates is available only for half of the regions,
and the selection process for this pool of regions is unknown (see Section 4 for discussion). Thus, we leave the discussion of
results to the robustness section and treat them as only suggestive.
14its initial stage may aect the large pool of parents from the older cohort, which later stages of the program
would not aect. For example, a couple that gives birth to a second child right before the program became
eective may decide to have a third child after its introduction in order take advantage of the subsidy, whereas
a couple that gives birth to a second child right after the program's initiation may choose not to have more
children because they already got the subsidy for the second child. On the other hand, the cumulative eect
may also be greater for several reasons. First, as discussed earlier, some families do not immediately react to
the campaign by giving a birth to a child. It may take time to conceive and for knowledge of the reform, and
trust in the program, to become widespread. Finally, the policy may have a cumulative (multiplicative over
time) eect, the result of changing in social habits and a preference (see, for example, Maurin and Moschion,
2009, Yakovlev, 2018).
7.2.1 Within-Country Estimates of Long-Run Eect
In this section, we provide a cross-regional analysis of the long-run eect. To do so, we utilize regional data
on age-speci
c fertility rates from 2000 to 2017 and use the following regression:
Yart = θ1 I(year ≥ 2007)rt + θ2 I(year ≥ 2012) + γSrt
0
(6)
+δa + t ∗ δa + δr + t ∗ δr + Drt Γ + uart
where Yart stands for the log of the birth rate of mothers of age a, in a region r, at year t. θ1 and θ2 show
the change in fertility rates across the 2007 to 2017, and 2012 to 2017 periods and γ shows an additional
eect of a relative size of regional subsidy. δa , t ∗ δa ,δr , and t ∗ δr stand for age
xed eects, age-speci
c
time trends, regional
xed eects, and region-speci
c time trends, respectively. The set of control variables
Drt includes log average income and housing availability in a region.
In the main speci
cation, we include both variables that stay for the eect of regional maternity programs,
I(year ≥ 2012) and Srt . While these two variables are collinear, we decide to include both of them for
several reasons. First, while Srt captures the eect of the variation in size of the subsidy, I(year ≥ 2012)
may capture the additional eects of the county-wide expansion of regional programs, like making regional
programs salient, as well as the eect of some other bene
ts and features of regional programs rather than
the size of the subsidy. Yet, for robustness, we estimate the regression (5), where we include only one of the
variables for regional programs, I(year ≥ 2012) or Srt .
Table 6 documents the results of the regressions. Column 1 shows, that after accounting for various time
trends, the federal program results in an increase in birth rates of 12 percentage points, and the regional
programs result in a further increase of 5.9 percentage points.
31 Note that, θ1 and θ2 show an average
increase in birth rates (over the existing trend) for the 2007 to 2017 and 2012 to 2017 periods, while the RD
estimates obtained in the previous section show an immediate (short-run) change. In the absence of post-
reform trends, one should not see any dierences between RD and long-run estimates, however, in case of
rescheduling (see Adda, Dustmann, and Stevens, 2017), the RD estimates should be higher than the average
long-run changes. Indeed, results show that an average long-run increase is slightly higher than the sum of
the short-run changes. Table 6 also shows, that on the top of a countrywide increase in fertility rate, in a
31 Recall that the federal program targeted births of second children, while majority of the regional programs targeted births
of third children.
15You can also read