Saturn chorus intensity variations - Archive ouverte HAL
←
→
Page content transcription
If your browser does not render page correctly, please read the page content below
Saturn chorus intensity variations
    J. Menietti, P. Schippers, Y. Katoh, J. Leisner, G. Hospodarsky, D. Gurnett,
                                             O. Santolík

     To cite this version:
    J. Menietti, P. Schippers, Y. Katoh, J. Leisner, G. Hospodarsky, et al.. Saturn chorus intensity
    variations. Journal of Geophysical Research Space Physics, American Geophysical Union/Wiley, 2013,
    118 (9), pp.5592-5602. �10.1002/jgra.50529�. �hal-02515889�

                                 HAL Id: hal-02515889
                https://hal.archives-ouvertes.fr/hal-02515889
                                    Submitted on 10 Nov 2021

    HAL is a multi-disciplinary open access            L’archive ouverte pluridisciplinaire HAL, est
archive for the deposit and dissemination of sci- destinée au dépôt et à la diffusion de documents
entific research documents, whether they are pub- scientifiques de niveau recherche, publiés ou non,
lished or not. The documents may come from émanant des établissements d’enseignement et de
teaching and research institutions in France or recherche français ou étrangers, des laboratoires
abroad, or from public or private research centers. publics ou privés.
                                              Copyright
JOURNAL OF GEOPHYSICAL RESEARCH: SPACE PHYSICS, VOL. 118, 5592–5602, doi:10.1002/jgra.50529, 2013

Saturn chorus intensity variations
J. D. Menietti,1 P. Schippers,2 Y. Katoh,3 J. S. Leisner,4 G. B. Hospodarsky,1
D. A. Gurnett,1 and O. Santolik 5,6
Received 13 May 2013; revised 30 July 2013; accepted 22 August 2013; published 11 September 2013.

[1] Whistler mode chorus plasma wave emissions have been observed at Saturn near the
magnetic equator and the source region. During crossings of the magnetic equator along
nearly constant L shells, the Cassini Radio and Plasma Wave Science Investigation often
observes a local decrease in whistler mode intensity and bandwidth closest to the magnetic
equator, where linear growth appears to dominate, with nonlinear structures appearing at
higher latitudes and higher frequencies. We investigate linear growth rate using the Waves in
a Homogeneous, Anisotropic, Multi-component Plasma dispersion solver and locally
observed electron phase space density measurements from the Electron Spectrometer sensor
of the Cassini Plasma Spectrometer Investigation to determine the parameters responsible for
the variation in chorus intensity and bandwidth. We find that a temperature anisotropy
(T⊥/T∥ ~ 1.3) can account for linear spatiotemporal growth rate of whistler mode waves,
which provides a majority of the observed frequency-integrated power. At the highest
frequencies, intense, nonlinear, frequency-drifting structures (drift rates ~ 200 Hz/s) are
observed a few degrees away from the equator and can account for a significant fraction of the
total power. Chorus emission at higher frequencies is distinct from lower frequency whistler
mode emission and is sometimes correlated with simultaneously observed low-frequency
electromagnetic ion cyclotron waves. These electromagnetic ion cyclotron waves appear to
modulate a slow frequency drift (~15 Hz/s) which develops into nonlinear growth with much
larger frequency drift associated only with the higher-frequency chorus.
Citation: Menietti, J. D., P. Schippers, Y. Katoh, J. S. Leisner, G. B. Hospodarsky, D. A. Gurnett, and O. Santolik (2013),
Saturn chorus intensity variations, J. Geophys. Res. Space Physics, 118, 5592–5602, doi:10.1002/jgra.50529.

1.   Introduction                                                            emission at Earth and Jupiter appears to be an effective source
                                                                             of pitch angle scattering and consequent stochastic electron
  [2] Chorus emission at the outer planets has been recently                 acceleration, intense dust clouds at Saturn may inhibit the
reviewed by Hospodarsky et al. [2012] and Menietti et al.                    efficiency of the process, as earlier suggested in the work of
[2012], who compare and contrast the wave amplitudes and                     Mauk and Fox [2010]. However, Summers et al. [2012] have
source location at Earth, Jupiter, and Saturn. Chorus emissions              more recently shown that by including relativistic effects in
at Earth are known to have source regions near the magnetic                  the equations, whistler mode emissions seem to play a signifi-
equator and to be a significant source of electron acceleration               cant role in nonlinear wave-particle interactions at Saturn.
in the Van Allen radiation belts. Recent studies at Jupiter                    [3] There are two general types of whistler mode emission
[Horne et al., 2008] have shown that similar processes may                   present in planetary magnetospheres, hiss, and chorus.
be acting there to accelerate electrons. Sphrits et al. [2012] have          Whistler mode emission exists at frequencies less than either
conducted a comparison of stochastic electron acceleration at                the plasma frequency, fp, or the cyclotron frequency, fc,
Earth, Jupiter, and Saturn and have found that while chorus
                                                                             whichever is lower, but close to the magnetic equator in the
                                                                             inner magnetospheric region fp > fc. Hiss has a featureless
   1
     Department of Physics and Astronomy, University of Iowa, Iowa City,     spectrum and is typically at lower frequencies than chorus,
Iowa, USA.                                                                   which often has a banded structure and, at high resolution,
                                                                             displays a fine structure of many frequency-drifting tones or
   2
     LESIA, Observatoire de Paris, Meudon Cedex, France.
   3
     Department of Geophysics, Graduate School of Science, Tohoku            chirps that have larger than typical spectral densities. These
University, Sendai, Japan.
   4
     Physics and Astronomy, University of Leicester, Leicester, UK.          structures are the result of the nonlinear nature of chorus
   5
     Institute of Atmospheric Physics, Prague, Czech Republic.               and resonant wave trapping of electrons as described,
   6
     Faculty of Mathematics and Physics, Charles University, Prague, Czech   for instance, by Nunn et al. [1997], Trakhtengerts et al.
Republic.                                                                    [1996], Trakhtengerts [1999], Omura and Summers [2004,
   Corresponding author: J. D. Menietti, Department of Physics and           2006], and Katoh and Omura [2004, 2006a, 2006b, 2007a,
Astronomy, University of Iowa, 210 Van Allen Hall, Iowa City, IA 52242-      2007b, 2011]. Omura et al. [2007] have extended the work
1479, USA. (john-menietti@uiowa.edu)                                         of Omura and Summers [2006] to describe an extremely
©2013. American Geophysical Union. All Rights Reserved.                      efficient nonlinear mechanism for accelerating high-energy
2169-9380/13/10.1002/jgra.50529                                              electrons (seed electrons of approximately several hundred

                                                                         5592
MENIETTI ET AL.: SATURN CHORUS INTENSITY VARIATIONS
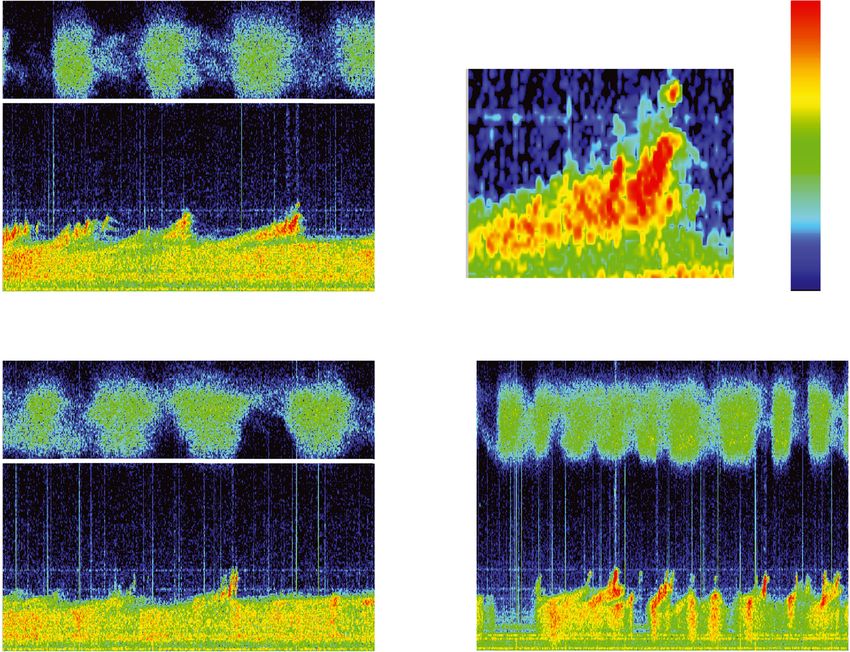
Figure 1. A frequency time spectrogram with magnetic field spectral density color coded. The chorus
data are from the low-rate receiver of the RPWS during an equator crossing at near-constant L shell.
Note the decrease in chorus bandwidth and intensity near the magnetic equator crossing (~17:00 to ~17:20).
keV) to a few MeV in only a few seconds. This process is (RPWS) [Gurnett et al., 2004] magnetic field search coils
called relativistic turning acceleration by the authors and on board Cassini during a high-inclination orbit when the
requires relatively large amplitude chorus emissions and an spacecraft crossed the equator from north to south at near-
initial population of mildly energetic electrons. In addition, constant L shell. This plot shows rather intense chorus and
Summers and Omura [2007] describe an ultrarelativistic
acceleration mechanism for electrons that is possible at the
outer planets. Bortnik et al. [2008] have performed test- (a) Orbit 97 Dec.17, 2008 16:09-18:05 UT
particle modeling for oblique waves as well, finding that
1400
nonlinear phase-trapping leads to rapid, large increase in
Frequency (Hz)
energy and pitch angle for a small portion of test particles. 1200
[4] Santolik et al. [2009] may have been the first to report 10-10
V2 m-2 Hz-1
1000
that terrestrial chorus emission intensity actually increased
with latitude from the magnetic equator. Haque et al. [2012] 800
reported that terrestrial chorus intensities measured by the
Cluster spacecraft generally increased exponentially away 600
10-11
from the magnetic equator according to a constant spatial 400
growth factor. Menietti et al. [2012, 2013] reported a similar UT (HH:MM) 16:20 16:40 17:00 17:20 17:40 18:00
decrease of chorus intensity and bandwidth near the magnetic (b) Orbit 97 Dec.17, 2008 16:22-16:25 UT
equator for Saturn chorus emissions. Summers et al. [2012] 10-9
were the first to analyze the nonlinear evolution and saturation 1400
10-10
Frequency (Hz)
of whistler mode waves away from the magnetic equator.
V2 m-2 Hz-1
They report convective growth due to nonlinear wave trapping 1200
10-11
and a saturation process partly due to a combination of
1000
adiabatic effects and a decreasing resonant current with latitude. 10-12
[5] In the present study we examine examples of chorus
800
intensity near the source region and relate it to in situ electron 10-13
phase space density (PSD) measurements. We note that
600 10-14
nonlinear chorus emission at Saturn appears only after linear UT (HH:MM) 16:22 16:23 16:24 16:25
growth near the magnetic equator. We also report on interest-
ing modulation of chorus power that may be due to low- Figure 2. (a, b) A higher-resolution spectrogram of the
frequency electromagnetic ion cyclotron waves. electric field spectral density obtained by the wideband
receiver (WBR) for the same pass as Figure 1. Discrete
2. Observations and Analysis nonlinear chorus features which extend to higher frequencies
[6] Figure 1 is an example of chorus emission observed by are seen a few degrees away from the magnetic equator.
the Cassini Radio and Plasma Wave Science instrument Some of these are seen at higher resolution in Figure 2b.
5593
MENIETTI ET AL.: SATURN CHORUS INTENSITY VARIATIONS

                                                                    Table 1. Plasma Parameters Near 16:23:13
                                                                                                  3
                                                                    Plasma Component          ne(m )           Vt∥ (m/s)       T⊥/T∥
                                                                                                       6               6
                                                                    Cold                     3.76 × 10        1.73 × 10         1.17
                                                                                                      5                6
                                                                    Warm1                    2.44 × 10        5.52 × 10         0.83
                                                                                                      4                7
                                                                    Warm2                    5.15 × 10        1.86 × 10         1.42
                                                                                                      7                5
                                                                    Core electrons           1.83 × 10        1.33 × 10          1.0
                                                                                                      7                3
                                                                    Core ions                2.24 × 10        3.10 × 10          1.0

                                                                      [7] We have calculated the frequency-integrated power
                                                                    (proportional to B2) of whistler mode emissions over the
                                                                    lower frequencies which are dominated by relatively weak
                                                                    emissions displaying no frequency-drifting signatures and
                                                                    separately over higher frequencies where more intense,
                                                                    frequency-drifting features occur. In Figure 3, we plot the
                                                                    results for the time interval 16:10 to 18:05 for which high-
                                                                    resolution electric field WBR measurements exist. Most
Figure 3. Frequency-integrated power for the time interval
                                                                    power is contained in the lower frequency (typically ≲ 600 Hz)
16:10 to 18:05. Most power is contained in the lower
                                                                    emissions (solid line), but there are periods when the higher
frequency emissions (solid line), but there are periods when
                                                                    frequency nonlinear chorus power is comparable to and
the higher-frequency nonlinear chorus power (dashed line)
                                                                    even exceeds the lower frequency emissions.
is comparable to and even exceeds the lower frequency
                                                                      [8] For specific times, we have investigated the electron
emissions.
                                                                    phase space distribution (PSD) obtained from the electron
                                                                    spectrometer (ELS) which is one of three sensors of the
whistler mode emission at frequencies less than the cyclotron       Cassini Plasma Spectrometer (CAPS) instrument on board
frequency (which covers the range 2500 < fc < 2800 Hz over          the Cassini spacecraft [Young et al., 2004]. In Figure 4, we
the time period). Within about 1.5° of the magnetic equator         display contours of the PSD obtained for a 2 s time period
(16:57 to 17:21), the whistler mode emission intensity and          when the spacecraft was near the magnetic equator and for
bandwidth decrease with the lowest intensity observed               which we have a sufficient pitch angle distribution at
closest to the magnetic equator near 17:10. In Figure 2a, we        17:11:10 and also away from the equator at 16:23:13 during
show a higher-resolution plot obtained by the Cassini RPWS          a time period when we observe nonlinear drifting frequencies.
Wideband Receiver (WBR), which measures electric field               For each of these observed distributions, we have performed a
intensity on one of the three available antennas. Nonlinear,        nonlinear least squares fit to a bi-Maxwellian. Using the Waves
frequency-drifting features are seen at the highest frequencies     in a Homogeneous, Anisotropic, Multi-component Plasma
of the chorus (≳ 800 Hz). In Figure 2b, we show a higher-           (WHAMP) dispersion solver [Rönnmark, 1982, 1983], we
resolution portion of Figure 2a delineating some of the             have calculated the real and imaginary frequencies, f, fi (linear
nonlinear drifting frequency features. The frequency disper-        temporal growth rate) versus wave number, k, for these elec-
sion of the waves is seen as broad banded fine structures.           tron distributions. The modeling parameters for the plasma
These features are absent nearest the magnetic equator and          components are listed in Tables 1 and 2, where ne is the
extend to higher frequency and larger bandwidth with increasing     electron number density and Vt∥ is the parallel thermal velocity.
latitude, peaking in power near ±5°–6°, before they fall off. The     [9] In Figures 5a and 5b, we overplot the observed and
broadband spikes nearest the magnetic equator in Figure 2a are      fitted electron distributions, and in Figures 5c and 5d, we
electrostatic bursts, possibly related to electron beams.           display f and fi versus wave number, k, for the model distri-
                                                                    butions. Both plots show modest linear temporal growth of
                                                                    whistler mode waves over a range ~50 Hz < f < 450 Hz near
 (a)                           (b)                                  the equator (17:11) and ~100 Hz < f < 800 Hz near 5°
                                                                    latitude (16:23) where nonlinear emission is also observed.
                                                                    The weaker “hiss-like” emission near the equator is observed
                                                                    to extend to perhaps 600 Hz, somewhat higher than calcu-
                                                                    lated. Both of the plots indicate growth rates reaching
                                                                    approximately fi/fc ~ 104, but linear growth extends to higher
                                                                    frequency for the distribution near 16:23:13. The frequency
                                                                    extent of the observed nonlinear signatures near 16:23 is
                                                                    approximately 800 Hz < f < 1200 Hz. As shown by simula-
                                                                    tion results of the chorus generation [cf. Katoh and Omura,
                                                                    2007a], the frequency range of the generated chorus is signif-
                                                                    icantly different from that estimated by the linear theory and
Figure 4. Contours of the electron phase space distribution         can extend to higher frequency range. The calculated wave
for a 2 s time period when the spacecraft was (a) near the          normal angle is near zero for each time period as determined
magnetic equator at 17:11:10 and (b) away from the equator          from the dispersion solver and growth rate calculations.
at 16:23:13 during a time period when we observe nonlinear            [10] We have also evaluated the spatial growth, γs = ωi/vg
drifting frequencies.                                               (vg = group velocity) for the whistler mode emissions

                                                                5594
MENIETTI ET AL.: SATURN CHORUS INTENSITY VARIATIONS

Table 2. Plasma Parameters Near 17:10:11                          significantly larger than the observed integrated power
Plasma Component
                             3
                         ne(m )            Vt∥ (m/s)      T⊥/T∥
                                                                  levels. This indicates that spatial growth near the equator is
                                  7               6
                                                                  more than sufficient to provide the observed power as a
Cold                    1.30 × 10
                                 5
                                         2.1 × 10
                                                  6
                                                          1.19    function of latitude, but γs is not constant during the propaga-
Warm1                   1.90 × 10        9.44 × 10        1.08
Warm2                   2.54 × 10
                                 4
                                         3.60 × 10
                                                  7
                                                          1.33
                                                                  tion time. For 200 Hz < f < 450 Hz, vg ≈ 5 × 10⁶ m/s. To
Core electrons          2.69 × 10
                                 7
                                         1.33 × 10
                                                  5
                                                           1.0    propagate 5° in latitude would require ~6 s.
                                 7                3
Core ions               4.01 × 10        3.10 × 10         1.0
                                                                  2.1. Effects of Ion Cyclotron Waves
                                                                    [11] In Figure 8, we display a 10 min interval of wideband
observed near the equator (Table 2 parameters), and               data with an expanded frequency range that includes chorus
plotted the results versus f in Figure 6. The γs decreases by     emissions (f < fc) and electrostatic cyclotron harmonic
about an order of magnitude over the frequency range              (ECH) emissions (f > fc). The ECH emissions show a period-
~125Hz < f < ~450Hz with a peak near 125 Hz. In                   icity of about 14 s, obtained by Fourier analysis, that is not
Figure 7, we plot the calculated spatial growth overlaid with     due to the spacecraft rotation (Cassini has a fixed attitude at
the observed frequency-integrated power for all emission fre-     this time). Figure 9a is a higher-resolution version of
quencies. The frequency-integrated power is evaluated over        Figure 8 where it appears the chorus and ECH emission have
the range 200 Hz < f < 1500 Hz. The minimum frequency             nearly the same period. The drifting frequency chorus
is set by interference observed for f < 200 Hz, and the           emissions at higher frequencies have a distinct morphology.
maximum frequency is chosen to be above all observed              There is a slowly frequency-drifting part with a drift rate
chorus emission. A least squares fit to the peaks of the           of ~ 10–20 Hz/s and a distinct intense fine structure compo-
integrated power is shown (dashed lines). We have used the        nent with a higher drift rate which is consistent with the theory
calculated spatial growth as a function of frequency to deter-    of Omura et al. [2008]. The fine structure of the frequency-
mine the expected frequency-integrated power as a function        drifting signatures with drift rates ~ 200 Hz/s is shown in
of time (latitude). This was done using the observed power        Figure 9a as an inset [cf. Menietti et al., 2013]. In Figures 9a
levels near the magnetic equator and assuming that the spatial    and 9b, we see that the drifting frequency chorus emissions
growth remains constant in time and space along the field line     are most intense near and within the period of time when the
in the direction away from the equator into each hemisphere.      ECH emissions are least intense. In Figure 9c, a 2 min interval
This is plotted as a dash-dotted curve in Figure 7 and is         a few minutes later, the drifting frequency chorus emissions

          Figure 5. Overplots of the observed and model (bold) electron PSD (a) near the magnetic equator and (b)
          near 16:23:13. (c, d) Real f and fi versus wave number, k, calculated for the distributions of Figures 5a and
          5b, respectively.

                                                              5595
MENIETTI ET AL.: SATURN CHORUS INTENSITY VARIATIONS

                        Spatial Growth 2008-352 17:11:10
             10-6
                                                                     we overplot the amplitude of the ion cyclotron waves with the
                                                                     chorus amplitude (in normalized, arbitrary units) averaged
                                                                     over the frequency range 500 Hz < f < 1500 Hz. Unlike the
                                                                     ECH waves, the chorus amplitudes are not well correlated
                                                                     with the EMIC waves; however, there are times when the peak
                                                                     chorus amplitudes at the highest frequencies coincide with
 γs (m -1)

                                                                     peaks in the EMIC wave amplitudes. We note that the ECH
             10-7
                                                                     waves are electrostatic and are therefore generated locally,
                                                                     whereas the source region of the chorus and whistler mode
                                                                     emission is likely not local. It is therefore not surprising to note
                                                                     a poorer correlation between the EMIC waves and the whistler
                                                                     mode emission.
                                                                       [13] Beesho and Menietti [2007] have shown how EMIC
             10-8
                    0   100      200            300   400   500      waves stimulate the growth of terrestrial auroral kilometric
                                       f (Hz)                        radiation (AKR). The latter authors performed particle-in-cell
                                                                     simulations of AKR in the presence of EMIC waves, showing
Figure 6. Spatial growth, γs = ωi/vg, versus f for the               that the AKR growth is stimulated in phase with the energy
whistler mode emissions observed near the equator (17:11).           density of the EMIC electric field. It is conceivable that a
The γs decreases by a factor of about 3 in the approximate           similar process is taking place here with the EMIC waves
frequency range 100Hz < f < 400Hz with a peak near 125 Hz.           stimulating the growth of ECH and possibly chorus emission
                                                                     as well. Chaston et al. [2002] have studied EMIC waves
are seen to vary in phase relative to the ECH emission. The          generated in the terrestrial auroral region by inverse Landau
periodicity of the ECH and probably the chorus emissions as          interaction with upward electron beams with E > 100 eV.
well is due to the presence of very low frequency, moderate          Oscillations of the electron count rate, obtained at high resolu-
intensity electromagnetic ion cyclotron waves (EMICs) that           tion, are seen at the period of the EMIC waves in their
are also observed near the magnetic equator at these radial          Figure 1. More recently, Li et al. [2011] using terrestrial
distances [cf. Leisner et al., 2006; Russell et al., 2006].          Time History of Events and Macroscale Interactions during
These waves have a source region near the magnetic equator,          Substorms (THEMIS) spacecraft data have shown that
where they are actually less intense, and propagate away from        compressional Pc4-5 pulsations modulate the integrated
it as reported by Leisner et al. [2011]. The ability of ion          chorus amplitudes. These authors then determined that linear
cyclotron waves to heat ions and electrons has been shown            growth rates were more effectively modulated by changes in
in the past at Earth [cf. Lysak et al., 1980; Carlson et al.,        the ratio of resonant electrons to the total electrons compared
1998] and at Saturn [Menietti et al., 2011]. In Figures 10a          to changes in the electron temperature anisotropy.
and 10b, we show plots of the magnetic field oscillations
obtained by the Cassini magnetometer [Dougherty et al.,              2.2. Electron Differential Energy Flux
2005] during times that overlap the RPWS data shown in                 [14] In Figure 11, we display plots of differential energy
Figure 9. The 4 Hz magnetometer data were analyzed with a            flux (DEF) obtained by the Cassini CAPS/ELS instrument
512 point running fast Fourier transform, with a 50% overlap         for 2008 day 352 from 16:20 to 16:30. Shown are plots for
between windows. In Figure 10a, we show the average power            three of the eight fan-arranged anodes of the instrument, with
spectrum between 16:19 and 16:25. The dark line labeled              the bottom panel showing the pitch angle coverage for each
“Trans.” is the transverse wave power (perpendicular to
the magnetic field). The lighter line labeled “Comp.” is the
compressional wave power (along the magnetic field). The
vertical line near 0.1 Hz is the O+ gyrofrequency during this
period of time. Figure 10b is a spectrogram of the total ion
cyclotron wave power during this equatorial crossing
(~17:10). The black line marks the O+ gyrofrequency across
the interval. The difference between the peak wave frequency
and the gyrofrequency in the two hemispheres is due to
Doppler shift [Leisner et al., 2011]. The EMIC waves are
due to water group W+ (H3O+, H2O+, HO+, O+) and to O2+
ions [cf. Leisner et al., 2006; Russell et al., 2006]. Thus, the
observed wave periods are variable and appear to be in the
range of 12 to 15 s.
   [12] Although not constant, the period of the EMIC waves is
frequently the same as the modulation of power of the ECH
and chorus emissions shown in Figure 9. The low-frequency
(f ~ 7 × 10² Hz) EMIC waves have ΔB ~ 2nT and modulate
the amplitude of the much higher frequency ECH
emissions seen overplotted (in normalized, arbitrary units) in       Figure 7. Calculated spatial growth as a function of latitude
Figure 10c. The power of the EMIC waves is orders of magni-          (time) overlaid with the observed frequency-integrated
tude larger than the ECH and chorus emissions. In Figure 10d,        power for all emission frequencies.

                                                                  5596
MENIETTI ET AL.: SATURN CHORUS INTENSITY VARIATIONS

         Figure 8. A 10 min interval spectrogram of wideband high-resolution electric field spectral density. The
         frequency range is expanded to include chorus emissions (f < fc, shown by the white line) and electrostatic
         cyclotron harmonic (ECH) emissions (f > fc). The ECH emissions show a periodicity of about 14 s that is
         not due to the spacecraft rotation.

anode as a function of time. The pitch angle coverage             distribution which we previously displayed in Figure 5 and
changes due to the motion of an actuator [cf. Young et al.,       fit to T⊥/T∥ > 1 (the “Warm2” component in Tables 1 and
2004]. In these plots, we see two distinct electron populations   2), and an interesting lower energy population (between
for E > 100eV: a higher energy (1keV) more pancake                100eV and 1keV) which shows a dependence on pitch angle,

         Figure 9. A higher-resolution version of Figure 8 where it appears the chorus emission and ECH emission
         may be correlated. The slowly drifting-frequency chorus emissions often seem to be distinct from lower
         frequency emissions. (a, b) The drifting frequency chorus emissions are most intense near and within the
         period of time when the ECH emissions are most intense. (c) A 2 min interval a little later in time, the
         drifting frequency chorus emissions vary in phase relative to the ECH emission.

                                                              5597
MENIETTI ET AL.: SATURN CHORUS INTENSITY VARIATIONS
Figure 10. Ion cyclotron wave observations on 17 December 2008. (a) Average power spectrum between
16:19 and 16:25. The dark line labeled “Trans.” is the transverse wave power (perpendicular to the mag-
netic field). The lighter line labeled “Comp.” is the compressional wave power (along the magnetic field).
The vertical line near 0.1 Hz is the O+ gyrofrequency during this period of time. (b) Spectrogram of the total
ion cyclotron wave power during this equatorial crossing (~17:10). The black line marks the O+ gyrofre-
quency across the interval. The differences between the peak wave frequency and the gyrofrequency in
the two hemispheres is due to Doppler shift [Leisner et al., 2011]. (c) Magnetic field oscillations (black)
obtained by the magnetometer on board Cassini during a time that overlaps the RPWS wideband data.
Although not constant, the period of the EMIC waves is frequently the same as the ECH emissions. The
envelope of higher-frequency ECH wave power (arbitrary units) is overplotted in red showing the modu-
lation due to the EMIC waves. (d) Chorus power (arbitrary units) integrated over the frequency range
500Hz < f < 1500 Hz is overplotted in red on the EMIC wave oscillations.
5598MENIETTI ET AL.: SATURN CHORUS INTENSITY VARIATIONS
electron populations are seen clearly in plots of the DEF, they
are not clearly discerned in the contour plots of the PSD
(Figure 4). The growth calculations depend on the gradients
of the electron PSD.
[15] As discussed by Gurnett and Bhattacharjee [2005],
the whistler mode resonance energy for an electron plasma
is given by
ω 3 Ωc
W ∥res ¼ W c 1 ; (1)
Ωc ω
where
B2
Wc ¼ ; (2)
ð2μ0 n0 Þ
with ω and Ωc the wave and cyclotron frequency, respectively,
B is the ambient magnetic field intensity, and μo the perme-
ability, no is the electron number density. For fc = 2692 Hz
and fp = 42.5 kHz, we find W∥res ~ 400eV for f = 1.2kHz and
W∥res ~ 3keV for f = 500Hz. It is possible that the observed
chorus at f > 600 Hz, slowly drifting in frequency (~10–20 Hz/s),
may have the lower energy electrons (Figure 11c) as a
free-energy source.
[16] The slow frequency drift rate of this separate higher
frequency component of chorus may be related to the hypoth-
esized modulating energy density of the source electron
population due to the stimulating EMIC wave period (~ 14 s.).
Oscillations of electron energy density with a period of ~ 14 s
would not be observable by CAPS/ELS due to the lack of
sampling time at each pitch angle. It is conceivable that
oscillating electric field energy density of the EMIC waves
modulates the thermal energy of the electrons, which in turn
then resonate with whistler mode chorus. These hypotheses
should be investigated in future modeling studies.
2.3. Wave Threshold and Optimum Intensity
[17] Omura et al. [2009] and Omura and Nunn [2011]
have presented theory for the nonlinear generation of chorus
Figure 11. (a, b, c) Differential energy flux (DEF) is plotted
for three of the eight fan-arranged anodes of the Cassini ELS
instrument, with the bottom panel of each figure showing the
pitch angle range for each anode as a function of time. The
pitch angle range is increasingly closer to field-aligned
proceeding from Figures 11a to 11c. Particularly in
Figure 11c, two distinct electron populations for E > 100eV
are seen: a higher energy nearly isotropic distribution and a
lower energy population which shows a dependence on pitch
angle, with lowest energies at the smallest pitch angles.
with lowest energies at the smallest pitch angles. This is
similar to electron and ion velocity-filtered distributions
reported by Burch et al. [1982] for injected plasma in the
terrestrial cusp region. The higher energy electron population
is the source of the lower frequency hiss-like whistler mode
emissions as discussed above. It contains a temperature
anisotropy that is unstable to linear growth as previously
shown. The lower energy electron population may be the Figure 12. Frequency profiles of the wave amplitudes of
source of the higher frequency chorus seen in Figures 8 and the chorus elements. Colored dashed and dotted lines show
9 that appears to be distinct from the lower frequency the optimum (opt) and threshold (th) nonlinear wave ampli-
whistler mode emission, sometimes showing a small gap in tudes for the listed values of Q and τ. The plots include
emission between the two components. While these two observed wave amplitudes (red) near 16:23.
5599MENIETTI ET AL.: SATURN CHORUS INTENSITY VARIATIONS
Table 3. Parameters for Wave Amplitude Calculations Q = 0.5. This smaller value of Q could be related to the large
Time fc(Hz) Vt∥ (m/s) T⊥/T∥
3
Nc (m ) Nh(m )
3 spatial scale of Saturn’s magnetosphere. The observed rising
7 7 4
chorus tones indicate chorus generated by nonlinear resonant
16:23:13 2692. 1.86 × 10 1.42 2.23 × 10 5.15 × 10 currents, which are created through the formation process of
an electromagnetic electron hole in the wave phase space.
The intensity of resonant currents is related to the depth of
elements that describe the threshold wave amplitude and the hole, represented by Q. While strong resonant currents
optimum amplitude of nonlinear waves propagating away would be required in a relatively smaller system (such as
from the equator source region. Kurita et al. [2012] have the Earth’s magnetosphere) with a large magnetic field
used this theory to favorably compare the nonlinear wave inhomogeneity (or gradient), the small inhomogeneity of
threshold and optimum amplitude of terrestrial chorus obser- Saturn’s magnetosphere makes it possible for nonlinear
vations obtained by THEMIS satellites. Equations (27) and effects to emerge for smaller Q. Recently, Katoh and Omura
(25) of Omura and Nunn [2011] express the threshold wave [2013] have studied the effects of background magnetic field
amplitude and optimum wave amplitude, respectively, as inhomogeneities on the generation processes of whistler mode
!2 ! chorus and broadband hiss-like emissions at Earth. They have
e t∥ e 2R
e th ¼ 100π γ ξ e γ2 V
3 3
as2 U shown that a small spatial inhomogeneity allows the triggering
Ω exp ; (3) process of rising tone elements to emerge easily.
eω
ω e ⊥0 δ5
e 4ph V
5 Q e 2t∥
U
[20] In Figure 13. we show a high-resolution plot of the
!2 ! chorus waveform of By at 16:30:53, the time of data shown
e e ⊥0 δ
e ph V
ω e 2R
γ2 V
e wo ¼ 0:81π 5=2 Q s1 V g
Ω exp : (4) in Figure 12. We find strong amplitude modulation of the
τ s0 ω
eUe t∥ γ 2Ue 2t∥ chorus waveform, which is similar to subpacket structures
of chorus elements [Santolik et al., 2003]. These subpacket
structures are the signature of a series of nonlinear triggering
[18] Details are given in the above articles, but we briefly processes to form a rising tone chorus element [e.g., Katoh
identify the parameters. Q is the depth of the electromagnetic and Omura, 2013]. Figure 13 is evidence that the wave
electron hole in velocity phase space. A value of Q = 1 means element is generated by a nonlinear triggering process occur-
the electron hole is devoid of electrons (strong trapping
h i1=2 ring in the Saturn magnetosphere.
potential). Other parameters include γ ¼ 1 ðv=cÞ2 ;
ξ 2 ¼ ωðΩe ωÞ=ω2p ; with ω ¼ 2πf ; ωp ¼ 2πf p ; δ2 = (1
+ξ 2) 1, τ is the ratio of TN to the nonlinear trapping period
Ttr = 2π/ωtr, ωtr is the trapping frequency [Omura et al.,
2
2008], s0 ¼ V ⊥0 δ=ξc; s1 ¼ γ 1 V R =V g ; V e g ¼ V g =c; ω e
¼ ω=Ωe ; U e t∥ ¼ U t∥ =c ¼ γV t∥ =c; ωe ph ¼ ωph =Ωe ; ωph ¼ ωpe
ðN h =N c Þ1=2 ; Ve ⊥0 ¼ V ⊥0 =c; V e R ¼ V R =c; and V R ¼ 1
k
ðω Ωe =γÞ: V t∥ ; N h ; and N c are thermal velocity of energetic
electrons parallel to the ambient magnetic field, and the
number density of hot electrons and the number density
of cold electrons, respectively. Omura and Nunn [2011]
define TN as the nonlinear transition time for formation
of the nonlinear resonant current. V⊥0 is obtained from
pffiffiffiffiffiffiffiffiffiffiffiffiffi
ffi
the fitting parameters of Table 1, V ⊥0 ¼ V t∥ T ⊥ =T ∥ .
The s2 is defined in Omura and Nunn [2011] in terms of
the above parameters.
[19] We have calculated these nonlinear wave amplitudes
for the case of chorus emission near 16:23 (Figure 12) during
the period of strong nonlinear chorus emission. Parameters
for equations 3 and 4 are presented in Table 3 (derived from
Table 1, except fc). The format of Figure 12 is similar to that
presented by Kurita et al. [2012] for THEMIS results at
Earth. As a function of frequency, for each value of Q, the
threshold nonlinear wave amplitude is plotted and four corre-
sponding curves of optimum amplitude corresponding to
τ = 0.25, 0.5, 1., 2. Superposed on Figure 12 are the observed
wave magnetic amplitudes in red. We have used three-
axis magnetic search coil data obtained from the RPWS
Waveform receiver (WFR) for the wave amplitude. For
Figure 12, the closest available snapshot was 16:30:53. A Figure 13. (a) The 287 ms snapshot of By amplitude
reasonable agreement of the observed chorus threshold and obtained at 16:30:53 by the RPWS WFR. (b) A higher-
optimum frequency occurs for Q > 0.1. Kurita et al. [2012] resolution plot of this data clearly showing the nonconstant
found a good agreement for terrestrial nonlinear chorus for nature of the amplitude.
5600MENIETTI ET AL.: SATURN CHORUS INTENSITY VARIATIONS
3. Summary and Conclusions recent work of Katoh and Omura [2013] suggests that the
[21] We have presented examples of whistler mode and nonlinear triggering process of rising tone elements emerges
chorus plasma wave emissions observed at Saturn near the easily in a smaller background magnetic field inhomogene-
magnetic equator. During crossings of the magnetic equator ity. Since the depth of the hole is related to the intensity of
along nearly constant L shells, the Cassini RPWS observes the nonlinear interaction process, the smaller value of Q
a local decrease in whistler mode intensity and bandwidth may be explained by the larger scale sizes at Saturn. More
closest to the magnetic equator, where linear growth appears definitive statements await further investigations of the influ-
to dominate, with nonlinear, frequency-drifting structures ence of Saturn background magnetic field inhomogeneities,
appearing at higher latitudes and higher frequencies. EMIC waves, modulating chorus wave amplitude, and per-
[22] Using the WHAMP dispersion solver and locally haps even higher-resolution wave observations.
observed electron phase space density measurements from
the Cassini Electron Spectrometer (CAPS/ELS), we deter- [26] Acknowledgments. We wish to thank J. Barnholdt for administra-
mine the parameters responsible for the variation in chorus tive assistance and J. Chrisinger for help with several plots. J.D.M. acknowl-
edges support from JPL contract 1415150 and NASA grant NNX11AM36G.
intensity and bandwidth. We find that a temperature anisot- The work of Y.K. was partially supported by grant-in-aid 23224011 of the
ropy (T⊥/T∥ ~ 1.3) can account for linear spatiotemporal Ministry of Education, Culture, Sports, Science, and Technology in Japan.
growth rate of the whistler mode emission, which provides a O.S. acknowledges support from grants GACR205-10/2279 and LH12231.
majority of the observed frequency-integrated power. At the [27] Masaki Fujimoto thanks the reviewers for their assistance in evalu-
ating this paper.
highest frequencies, intense, nonlinear, frequency-drifting
structures are observed a few degrees away from the equator,
and, at times, account for half of the total chorus power. References
Linear growth of whistler mode waves dominates near the Beesho, N., J. D. Menietti (2007), Particle-in-cell simulation study of the
impact of ion cyclotron waves on auroral kilometric radiation, J. Geophys.
magnetic equator. The linear spatial growth of this emission Res., 112, A10215, doi:10.1029/2007JA012417.
measured near the equator can easily account for the observed Bortnik, J., R. M. Thorne, and U. S. Inan (2008), Nonlinear interaction of
wave power as a function of latitude. Most of the frequency- energetic electrons with large amplitude chorus, Geophys. Res. Lett., 35,
L21102, doi:10.1029/2008GA035500.
integrated wave power is provided by the lower frequency Burch, J. L., P. H. Reiff, R. A. Heelis, J. D. Winningham, W. B. Hanson,
emissions, but the nonlinear chorus emissions, when present, C. Gurgiolo, J. D. Menietti, R. A. Hoffman, and J. N. Barfield (1982),
can be dominant. Plasma injection and transport in the mid-altitude polar cusp, Geophy.
[23] Electromagnetic ion cyclotron waves are frequently Res. Lett., 9(9), 921–924, doi:10.1029/GL009i009p00921.
Carlson, C. W., et al. (1998), FAST observations in the downward auroral
observed near the magnetic equator in the inner Saturn current region: Energetic upgoing electron beams, parallel potential drops,
magnetosphere [Leisner et al., 2006; Russell et al., 2006]. and ion heating, Geophys. Res. Lett., 25(12), 2017–2020, doi:10.1029/
Observed moderate amplitude (~ 2nT) EMIC waves modulate 98GL00851.
Chaston, C. C., J. W. Bonnell, J. P. McFadden, R. E. Ergun, and C. W. Carlson
the power of the observed ECH emissions with a somewhat (2002), Electromagnetic ion cyclotron waves at proton cyclotron harmonics,
irregular period of ~10 to 15 s. Chorus emission appears to J. Geophys. Lett, 107(A11), 1351, doi:10.1029/2001JA900141.
be loosely correlated with ECH emissions that are observed, Dougherty, M. K., et al. (2005), Cassini magnetometer observations during
but shifting in phase, perhaps due to the different source Saturn orbit insertion, Science, 307, 1266–1270, doi:10.1126/science.1106098.
Gurnett, D. A., and A. Bhattacharjee (2005), Introduction to Plasma Physics,
locations of each wave. p. 379, Cambridge Univ. Press, Cambridge, U. K.
[24] Chorus emission at higher frequencies (f ≳ 600 Hz) is Gurnett, D. A., et al. (2004), The Cassini radio and plasma wave investigation,
sometimes distinct from lower frequency whistler mode Space Sci. Rev., 114(1–4), 395–463, doi:10.1007/s11214-004-1434-0.
Haque, N., U. S. Inan, T. F. Bell, and J. S. Pickett (2012), Spatial dependence
emission. This distinct frequency range of chorus may have of banded chorus intensity near the magnetic equator, Geophys. Res. Lett.,
a source in a lower energy electron component apparent in 39, L17103, doi:10.1029/2012GL052929.
plots of the electron differential energy flux but not visible Horne, R. B., and R. M. Thorne (2000), Electron pitch angle diffusion by
in contours of the phase space density. This chorus displays electrostatic electron cyclotron harmonic waves: The origin of pancake
distributions, J. Geophys. Res., 105(A3), 5391–5402, doi:10.1029/
a slow frequency drift (10 to 15 Hz/s) and then develops a fine 1999JA900447.
structure of nonlinear growth with larger frequency sweep rate Horne, R. B., R. M. Thorne, S. A. Glauert, D. J. Menietti, Y. Y. Shprits, and
(~ 200 Hz/s) that can be explained by the theory of Omura D. A. Gurnett (2008), Gyro-resonant electron acceleration at Jupiter,
Nature Physics, 4, 301–304, doi:10.1038/nphys897.
et al. [2008] [cf. Menietti et al., 2013]. This cycle of slow Hospodarsky, G. B., K. Sigsbee, J. S. Leisner, J. D. Menietti, W. S. Kurth,
frequency drift developing into nonlinear growth lasts for a D. A. Gurnett, C. A. Kletzing, and O. Santolik (2012), Plasma wave obser-
period similar to that of the EMIC waves. We hypothesize vations at Earth, Jupiter, and Saturn, in Dynamics of the Earth’s Radiation
the EMIC waves may modulate the electron energy density Belts and Inner Magnetosphere, Geophys. Monogr. Ser., vol. 199, edited
by D. Summers et al., pp. 415–430, AGU, Washington, D. C.
which in turn modifies the growth of the chorus emissions. Katoh, Y., and Y. Omura (2004), Acceleration of relativistic electrons due to
Beesho and Menietti [2007] used simulations to demonstrate resonant scattering by whistler mode waves generated by temperature
how EMIC waves modulate the growth of terrestrial auroral anisotropy in the inner magnetosphere, J. Geophys. Res., 109, A12214,
kilometric radiation. Li et al. [2011] have shown how doi:10.1029/2004JA010654.
Katoh, Y., and Y. Omura (2006a), Simulation study on nonlinear frequency
compressional PC4–5 waves can modulate the growth of shift of narrow band whistler-mode waves in a homogeneous magnetic
chorus by modulating the density in the source region. field, Earth Planets Space, 58(9), 1219–1225.
Further comprehensive investigation and modeling of the Katoh, Y., and Y. Omura (2006b), A study of generation mechanism of VLF
triggered emission by self-consistent particle code, J. Geophys. Res., 111,
interaction of EMIC waves with chorus and ECH waves at A12207, doi:10.1029/2006JA011704.
Saturn remain to be done. Katoh, Y., and Y. Omura (2007a), Computer simulation of chorus wave
[25] Calculations of threshold and optimum amplitudes generation in the Earth’s inner magnetosphere, Geophys. Res. Lett., 34,
show reasonable agreement to nonlinear theory for drifting L03102, doi:10.1029/2006GL028594.
Katoh, Y., and Y. Omura (2007b), Relativistic particle acceleration in the
frequency chorus observed for moderately low values of process of whistler-mode chorus wave generation, Geophys. Res. Lett.,
parameter Q, the depth of the electron hole potential. The 34, L13102, doi:10.1029/2007GL029758.
5601MENIETTI ET AL.: SATURN CHORUS INTENSITY VARIATIONS
Katoh, Y., and Y. Omura (2011), Amplitude dependence of frequency sweep Omura, Y., and D. Summers (2006), Dynamics of high-energy electrons
rates of whistler mode chorus emissions, J. Geophys. Res., 116, A07201, interacting with whistler mode chorus emissions in the magnetosphere,
doi:10.1029/2011JA016496. J. Geophys. Res., 111, A09222, doi:10.1029/2006JA011600.
Katoh, Y., and Y. Omura (2013), Effect of the background magnetic field Omura, Y., N. Furuya, and D. Summers (2007), Relativistic turning accel-
inhomogeneity on generation processes of whistler-mode chorus and eration of resonant electrons by coherent whistler mode waves in a
broadband hiss-like emissions, J. Geophys. Res. Space Physics, 118, dipole magnetic field, J. Geophys. Res., 112, A06236, doi:10.1029/
4189–4198, doi:10.1002/jgra.50395. 2006JA012243.
Kurita, S., Y. Katoh, Y. Omura, V. Angelopoulos, C. M. Cully, O. Le Contel, Omura, Y., Y. Kato, and D. Summers (2008), Theory and simulation of
and H. Misawa (2012), THEMIS observations of chorus elements without a the generation of whistler-mode chorus, J. Geophys. Res., 113, A04223,
gap at half the gyrofrequency, J. Geophys. Res., 117, A11223, doi:10.1029/ doi:10.1029/2007JA012622.
2012JA018076. Omura, Y., M. Hikishima, Y. Katoh, D. Summers, and S. Yagitani (2009),
Leisner, J. S., C. T. Russell, M. K. Dougherty, X. Blanco-Cano, Nonlinear mechanisms of lower-band and upper-band VLF chorus
R. J. Strangeway, and C. Bertucci (2006), Ion cyclotron waves in Saturn’s emissions in the magnetosphere, J. Geophys. Res., 114, A07217,
E ring: Initial Cassini observations, Geophys. Res. Lett., 33, L11101, doi:10.1029/2009JA014206.
doi:10.1029/2005GL024875. Rönnmark, K. (1982), WHAMP – waves in a homogeneous anisotropic multi-
Leisner, J. S., C. T. Russell, H. Y. Wei, and M. K. Dougherty (2011), component plasma, Rep. 179, Kiruna Geophys. Inst., Kiruna, Sweden.
Probing Saturn’s ion cyclotron waves on high-inclination orbits: Lessons Rönnmark, K. (1983), Computation of the dielectric tensor of a Maxwellian
for wave generation, J. Geophys. Res., 116, A09235, doi:10.1029/ plasma, Plasma Phys., 25(6), 699–701, doi:10.1088/0032-1028/25/6/007.
2011JA016555. Russell, C. T., J. S. Leisner, C. S. Arridge, M. K. Dougherty, and
Li, W., R. M. Thorne, J. Bortnik, Y. Nishimura, and V. Angelopoulos X. Blanco-Cano (2006), Nature of magnetic fluctuations in Saturn’s
(2011), Modulation of whistler mode chorus waves: 1. Role of compres- middle magnetosphere, J. Geophys. Res., 111, A12205, doi:10.1029/
sional Pc4–5 pulsations, J. Geophys. Res., 116, A06205, doi:10.1029/ 2006JA011921.
2010JA016312. Santolik, O., D. A. Gurnett, J. S. Pickett, M. Parrot, and N. Cornilleau-Wehrlin
Lysak, R., M. Hudson, and M. Temerin (1980), Ion heating by strong (2003), Spatio-temporal structure of storm-time chorus, J. Geophys. Res.,
electrostatic ion cyclotron turbulence, J. Geophys. Res., 85(A2), 108, 1278, doi:10.1029/2002JA009791.
678–686, doi:10.1029/JA085iA02p00678. Santolik, O., D. A. Gurnett, J. S. Pickett, J. Chum, and
Mauk, B. H., and N. J. Fox (2010), Electron radiation belts of the solar N. Cornilleau-Wehrlin (2009), Oblique propagation of whistler mode
system, J. Geophys. Res., 115, A12220, doi:10.1029/2010JA015660. waves in the chorus source region, J. Geophys. Res., 114, A00F03,
Menietti, J. D., P. Schippers, O. Santolik, D. A. Gurnett, F. Crary, and doi:10.1029/2009JA014586.
A. J. Coates (2011), Ion cyclotron harmonics in the Saturn downward current Shprits, Y. Y., D. J. Menietti, X. Gu, K. C. Kim, and R. B. Horne (2012),
auroral region, J. Geophys. Res., 116, A12234, doi:10.1029/2011JA017102. Gyroresonant interactions between the radiation belt electrons and whistler
Menietti, J. D., Y. Y. Shprits, R. B. Horne, E. E. Woodfield, mode chorus waves in the radiation environments of Earth, Jupiter, and
G. B. Hospodarsky, and D. A. Gurnett (2012), Chorus, ECH, and Z mode Saturn: A comparative study, J. Geophys. Res., 117, A11216,
emissions observed at Jupiter and Saturn and possible electron acceleration, doi:10.1029/2012JA018031.
J. Geophys. Res., 117, A12214, doi:10.1029/2012JA018187. Summers, D., and Y. Omura (2007), Ultra-relativistic acceleration of elec-
Menietti, J. D., Y. Katoh, G. B. Hospodarsky, and D. A. Gurnett (2013), trons in planetary magnetospheres, Geophys. Res. Lett., 34, L24205,
Frequency drift of Saturn chorus emission compared to nonlinear theory, doi:10.1029/2007GL032226.
J. Geophys. Res. Space Physics, 118, 982–990, doi:10.1002/jgra.50165. Summers, D., Y. Omura, Y. Miyashita, and D.-H. Lee (2012), Nonlinear
Nunn, D., Y. Omura, H. Matsumoto, I. Nagano, and S. Yagitani (1997), The spatiotemporal evolution of whistler mode chorus waves in Earth’s inner
numerical simulation of VLF chorus and discrete emissions observed on magnetosphere, J. Geophys. Res., 117, A09206, doi:10.1029/2012JA017842.
the Geotail satellite using a Vlasov code, J. Geophys. Res., 102(A12), Trakhtengerts, V. Y. (1999), A generation mechanism for chorus emission,
27,083–27,097, doi:10.1029/97JA02518. Ann. Geophys., 17, 95–100, doi:10.1007/s00585-999-0095-4.
Omura, Y., and D. Nunn (2011), Triggering process of whistler-mode chorus Trakhtengerts, V. Y., M. J. Rycroft, and A. G. Demekhov (1996),
emissions in the magnetosphere, J. Geophys. Res., 116, A05205, Interrelation of noise-like and discrete ELF/VLF emissions generated by
doi:10.1029/2010JA016280. cyclotron interactions, J. Geophys. Res., 101(A6), 13,293–13,301,
Omura, Y., and D. Summers (2004), Computer simulations relativistic doi:10.1029/95JA03515.
whistler-mode wave-particle interactions in the magnetosphere, Phys. Young, D. T., et al. (2004), Cassini plasma spectrometer investigation, Space
Plasmas, 11, 3530–3534, doi:10.1063/1.1757457. Sci. Rev., 114(1–4), 1–112, doi:10.1007/s11214-004-1406-4.
5602You can also read