Route Safety Research - Transport Scotland NOVEMBER 2017
←
→
Page content transcription
If your browser does not render page correctly, please read the page content below
FINAL REPORT

Route Safety Research

Prepared for

Transport Scotland

NOVEMBER 2017

Halcrow Group Limited, a CH2M HILL Company
City Park
368 Alexandra Parade
Glasgow, G31 3AU

Contents
Section                                                                                                                                        Page
Acronyms and Abbreviations.............................................................................................................. v
Executive Summary.......................................................................................................................... vii
Introduction................................................................................................................................... 1-1
       1.1      Background ...................................................................................................................... 1-1
       1.2      Purpose of research ......................................................................................................... 1-1
Understanding the Context ............................................................................................................ 2-1
      2.1     Overview .......................................................................................................................... 2-1
              2.1.1 Rationale for International Comparison ............................................................. 2-1
      2.2     EuroStat ........................................................................................................................... 2-2
              2.2.1 EuroStat Safety Statistics .................................................................................... 2-2
              2.2.2 NUTS Statistical Regions ..................................................................................... 2-3
      2.3     Scotland’s Road Safety Framework ................................................................................. 2-5
              2.3.1 Road Safety Targets ............................................................................................ 2-5
              2.3.2 Framework Commitments .................................................................................. 2-6
              2.3.3 Other Documents ............................................................................................... 2-7
Scottish Case Studies ...................................................................................................................... 3-1
        3.1    Overview .......................................................................................................................... 3-1
        3.2    Case Study Findings ......................................................................................................... 3-1
               3.2.1 WS2+1s ............................................................................................................... 3-1
               3.2.2 Safety Camera Systems....................................................................................... 3-2
        3.3    Other Mitigations............................................................................................................. 3-2
International Context ..................................................................................................................... 4-1
       4.1     Overview .......................................................................................................................... 4-1
       4.2     Background to International Research ............................................................................ 4-1
       4.3     The Norwegian Context ................................................................................................... 4-2
               4.3.1 Overview ............................................................................................................. 4-2
               4.3.2 International Research Findings ......................................................................... 4-2
               4.3.3 Consultation with Norwegian Roads Authority .................................................. 4-4
               4.3.4 Other Relevant Projects ...................................................................................... 4-5
       4.4     The Swedish Context ....................................................................................................... 4-7
               4.4.1 Overview ............................................................................................................. 4-7
               4.4.2 International Research Findings ......................................................................... 4-8
               4.4.3 Consultation with Swedish Roads Authority .................................................... 4-10
               4.4.4 Other Relevant Projects .................................................................................... 4-12
       4.5     Other Relevant Research ............................................................................................... 4-13
       4.6     Other Considerations ..................................................................................................... 4-14
       4.7     International Context Conclusions................................................................................. 4-15
Summary, Conclusions and Next Steps............................................................................................ 5-1
     5.1     Summary and Conclusions ............................................................................................... 5-1
             5.1.1 Road Safety Strategy ........................................................................................... 5-1
             5.1.2 Infrastructure ...................................................................................................... 5-3
             5.1.3 Enforcement ....................................................................................................... 5-3

ROUTE SAFETY RESEARCH                                                                                                                                I
CONTENTS

Section                                                                                                                                              Page
                      5.1.4 Other Factors / Considerations........................................................................... 5-4
                      5.1.5 Summary ............................................................................................................. 5-5
          5.2         Next Steps ........................................................................................................................ 5-5
References ..................................................................................................................................... 6-1

Appendices
Appendix A Understanding EuroStat
Appendix B Scottish Transport Statistics & Reported Road Casualties Data
Appendix C Recent Trunk Road Improvement Projects
Appendix D Scottish Case Studies

Tables
Table 2.1. Scotland’s Road Safety Framework – Road Safety Targets to 2020
Table 2.2. Scotland’s Road Safety Framework - Trunk Road Commitments
Table A.1. NUTS2 Regions, Local Authority Commonality and Estimated Population (Mid-2014)
Table B.1. Scottish Transport Statistics – Million Vehicle Kilometres (2004– 2014)
Table B.2. Reported Road Casualties – Fatalities (2004 – 2014)
Table C.1. Completed Trunk Road Projects (2007- 2016)

ROUTE SAFETY RESEARCH                                                                                                                                      II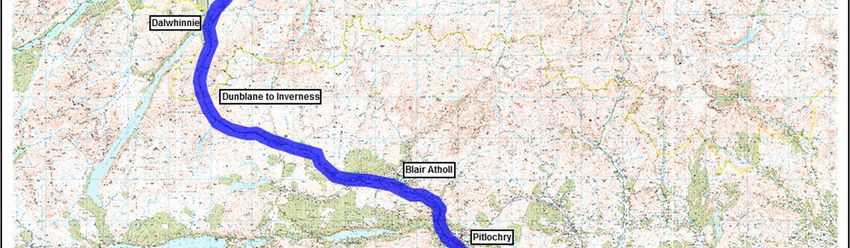
Document History
This report has been prepared in accordance with the instructions of the client, Transport Scotland, for
the client’s sole and specific use.

Any other persons who use any information contained herein do so at their own risk.

  This document has been issued and amended as follows:

      Version           Date            Description          Created By      Verified by     Approved by

  1             04/2017        Draft for consultation           DW               NV              NV

  2             05/2017        Second Draft                     DW               NV              NV

  3             11/2017        Final Report                     DW               NV              NV

ROUTE SAFETY RESEARCH                                                                                      III
Acronyms and Abbreviations
AADT                    Annual Average Daily Traffic
ANPR                    Automatic Number Plate Recognition
ASC                     Average Speed Camera
ATC                     Automatic Traffic Counter
D2AP                    Dual 2 Lane All Purpose Carriageway
DfT                     Department for Transport
DG                      Directorate General
DMRB                    Design Manual for Roads and Bridges
EFTA                    European Free Trade Area
EU                      European Union
Euro NCAP               European New Car Assessment Programme
HGV                     Heavy Goods Vehicle
IRTAD                   International Traffic Safety Data and Analysis Group
Kms                     Kilometres
MSP                     Member of the Scottish Parliament
NPRA                    Norwegian Public Roads Administration
NUTS                    Nomenclature of Territorial Units for Statistics
OECD                    Organisation for Economic Co-operation and Development
PSQKM                   Per Square Kilometre
RAP                     Route Action Plan
RSA                     Road Safety Audit
S2                      Single 2 Lane Carriageway
STRIPE                  Scottish Trunk Road Infrastructure Project Evaluation
TØI                     Institute of Transport Economics
TPO                     Transport Planning Objective
TRISS                   Trunk Road Incident Support Service
TRL                     Transport Research Laboratory
Vkms                    Vehicle Kilometres
Vpd                     Vehicles Per Day
WS2                     Wide Single Carriageway
WS2+1                   Wide Single 2+1 Lane Carriageway

ROUTE SAFETY RESEARCH                                                            V

Executive Summary
Introduction
Scotland has a well-developed road safety strategy and is ranked as one of the top performing nations
globally. Transport Scotland commissioned CH2M to undertake a focussed research project to
investigate whether there are any policies, strategies or mitigations adopted within Norway and Sweden
which, historically, have a better record of road safety than Scotland that could influence road safety
trends in Scotland.

Rationale for International Comparison
Scotland, a northern European nation of some 5.37 million people in 2015, has an extensive and largely
modern road network. The population density across the county varies significantly, from extensively
urbanised areas of the central belt to the largely rural sparsely populated areas of the Highlands. The
country’s location at the northern periphery of Europe results in a predominantly maritime climate, with
extensive periods of wet weather and not insignificant levels of snowfall over higher lying areas during
the winter periods. Due to its northerly latitude, daylight hours vary significantly across the year. In
considering these characteristics, commonalities between Scotland and its Northern European
neighbours can be identified.
Given the characteristics discussed and their potential influence on road standards, driving conditions
and, subsequently, road safety, the Scandinavian nations of Norway and Sweden are judged to provide
suitable comparators with Scotland and a suitable basis on which to compare safety trends and
statistics.
EuroStat collects data on transport safety for EU Member States, European Free Trade Area (EFTA) and
candidate countries. The available Eurostat data compares the numbers killed per million inhabitants in
Scotland, Norway and Sweden and is presented in the figure below.
Figure ES1 EuroStat Safety Statistics

ROUTE SAFETY RESEARCH                                                                                     VII

The 2014 data suggested that while the numbers killed per million inhabitants in Norway and Sweden
was broadly similar, the numbers killed in Scotland were somewhat higher and suggested that Sweden,
in particular, has been outperforming Scotland in this respect over a number of years.
Scottish Case Studies
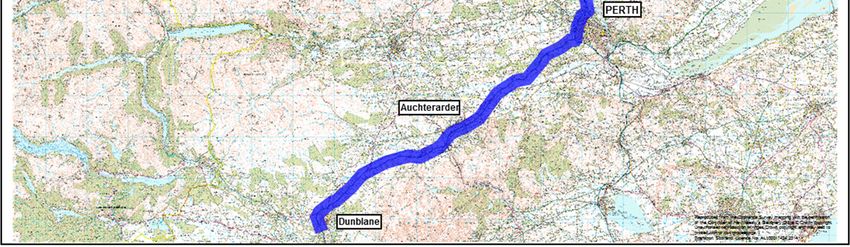
Three routes on which significant investment in targeted infrastructure improvements have been made
in recent years have been considered; the A75 between Gretna and Stranraer, the A77 between Fenwick
and Stranraer and the A9 between Dunblane and Inverness.
These routes have been considered due to the nature of the targeted improvements implemented and
their relevance to this research. These include sections of WS2+1 carriageway, the aim of which is to
improve and enhance overtaking opportunities and the implementation of safety camera systems, the
aim of which is primarily to improve safety on routes where accident numbers and severities are greater
than national average values.
The overarching findings from a review of four WS2+1 case studies indicated that there were notable
reductions in the number and severity of accidents and casualties occurring following opening of two of
the four projects examined. An increase in the number of accidents or severity of casualties were noted
for two of the four projects examined. Examination of the available RSAs, however, suggested that
accidents occurring post opening were not attributable to the design or layout of the project.
The overarching findings from a review of two safety camera system studies indicated that there were
notable reductions in the number and severity of accidents and casualties occurring following opening
of both of the projects examined. Available evidence also suggested that there notable reductions in
the average speed of vehicles travelling on routes subject to speed camera systems following opening.
Furthermore, notable reductions in the number of vehicles travelling at excessive speeds travelling on
routes subject to speed camera systems were observed following opening,
International Context
Effective planning is considered to have played the biggest part in reducing accidents in Norway and
Sweden. Roads in Sweden are built to prioritise safety over speed or convenience. Low urban speed
limits, pedestrian zones and barriers that separate cars from bicycles and oncoming traffic have all
contributed to the continued reduction in the number of accidents.
Construction of significant lengths of WS2+1 roads, particularly in Sweden, is considered to have
contributed to significant road safety improvements over the first decade of Vision Zero. Provision of
safer crossings (including pedestrian bridges and zebra crossings flanked by flashing lights, protected
with speed bumps) are likely to have contributed to a significant reduction in the number of pedestrian
deaths over the past five years. Strict policing has also played a contributory factor with less than 0.25%
of drivers tested in Sweden over the alcohol limit. Furthermore, road deaths involving children under
seven have reduced significantly in Sweden—in 2012 only one was killed, compared with 58 in 1970.
While effective planning is considered a major factor in reducing accidents in Norway and Sweden,
research indicates that there is no single reason for the reductions in fatal casualties observed. A
number of measures, however, were identified which could have contributed to this trend: These
include:
• Road Safety Strategy - the adoption of “Vision Zero”
• Improvements in the car fleet i.e. increased proportion of car fleet with 5-star Euro NCAP ratings
• Reducing speed limits
• Conducting speeding campaigns
ROUTE SAFETY RESEARCH VIII
•    Introduction of speed cameras resulting in reduced mean speed of traffic on high volume roads
    •    Provision of physical barriers to prevent head-on crashes on new motorways and two/three lane
         roads
    •    Running of seat belt campaigns resulting in increased use of seat belts
While a review of the available safety statistics indicates that road safety trends in Norway and Sweden
are improving and may be linked to the policies, strategies and targeted measures identified within the
preceding sections, cognisance of other factors which could contribute to the varying safety trends
between Scotland, Norway and Sweden, should also be taken. These include:
    •    Signage strategies
    •    Speed limits
    •    Underlying driver behaviour
    •    Driver education (i.e. variations in driving test requirements)
    •    Regulations (i.e. requirements for snowchains in winter, headlights always on, drink driving
         limits)
    •    Targeted measures at reducing drink/drug driving

Summary and Conclusions
Examination of the information available at the time of this project suggests that, while there are similar
approaches to road safety in Norway, Sweden and Scotland, differences in approach do exist that are
worthy of further investigation. In terms of the design and delivery of infrastructure, while differences
exist in the approaches taken, particularly in relation to the strategy adopted surrounding the delivery of
WS2+1 schemes, it is considered unlikely that this factor alone accounts for the variation in road safety
statistics between the three countries.
It is considered that differences in the approach to the enforcement of traffic violations and general
differences in culture, attitudes and driving behaviour (such as the social unacceptability of drink
driving) are likely to play a part. Furthermore, a range of other factors are considered likely to
contribute to the accident trends observed in Norway and Sweden, such as the propensity of Euro NCAP
5 star rated vehicles within the vehicle fleet, the additional requisites needed to be able to obtain a
driving license and traffic regulations related to winter driving, amongst others.
Each of the differing factors discussed within this report are likely to contribute, to varying degrees, to
the safety statistics presented in Norway and Sweden. Research into each factor would be required to
quantify their relative impacts on road safety.

Next Steps
Transport Scotland may wish to give consideration to undertaking further research into some of the
specific factors outlined which may account for the variation in road safety statistics in Scotland, Norway
and Sweden. This could include:
    •    Research into the impact of introducing and enforcing drug driving legislation in Scotland
    •    Research into the possibilities, implications and potential impacts of revising the requirements
         of the driving test and enhanced driver education
    •    A review of the design standard and approach to the delivery of WS2+1 schemes in Scotland
    •    Research into the impact of lowering speed limits, in both rural and urban areas
ROUTE SAFETY RESEARCH                                                                                         IX
• Research into the potential for, implications and potential impacts of the installation of median
barriers on both S2 and WS2+1 carriageways in Scotland
Furthermore, given the apparent success of the safety camera schemes currently operating in Scotland,
Transport Scotland may wish to give consideration to undertaking an exercise to identify other routes
which could benefit from the installation of similar systems, in order to improve driver behaviour and
road safety.
Transport Scotland may also wish to give consideration to the findings and recommendations of other
road safety research projects. In particular, the research undertaken by TRL relating to U.K. road safety,
published in September 2016, posed a number of questions that Transport Scotland may wish to
consider in a Scottish context, in more detail. An initial review of these questions, however, would
require to be undertaken to establish the likely relevance of each of these areas to road safety in
Scotland.
Finally, Transport Scotland should ensure that cognisance of up-to-date road safety statistics is taken
when considering any future measures or research surrounding road safety trends. The latest available
road safety data for Scotland (presented within ‘Reported Road Casualties Scotland 2015’, published in
October 2016) indicates that the figures for all types of injury are the lowest since records began,
suggesting that road safety in Scotland continues to improve. As a result it can be judged that the
current approach to road safety in Scotland is contributing to a continuing improvement in road safety
trends.
ROUTE SAFETY RESEARCH XSECTION 1 - INTRODUCTION
Introduction
1.1 Background
Scotland has a well-developed road safety strategy and is ranked as one of the top performing nations
globally. Transport Scotland has commissioned CH2M to undertake a focussed research project to
investigate whether there are any policies, strategies or mitigations adopted within Norway and Sweden
which, historically, have a better record of road safety than Scotland that could influence road safety
trends in Scotland.
1.2 Purpose of research
Road accident statistics published by the Department for Transport (DfT) indicates that Sweden and
Norway are amongst the top performing countries in terms of road safety, and are outperforming
Scotland. There are, however, some good examples of road safety in Scotland, including the safe system
approaches adopted on the A9, A77 and A75, which can be examined alongside examples from Sweden
and Norway.
The research objective for this project is:
• To identify the most successful casualty reduction mitigation measures and strategies adopted
in various route safety strategies in Scotland, Norway and Sweden to inform future scheme
development in Scotland.
It is hoped that improved and more sustained safety solutions can be developed and implemented in
Scotland. The research will consider safety initiatives and strategies, and examine Wide Single 2+1 Lane
Carriageways (WS2+1s) and safety camera systems as case studies.
The report is structured as follows:
The context and rationale for the study and the international comparisons undertaken in set out in
Chapter 2.
Chapter 3 examines a number of Scottish ‘case studies’ focussing on WS2+1, safety camera projects and
other mitigations.
The international context of the study is set out in Chapter 4, with an examination of the approach
taken in Norway and Sweden relating to road safety.
Chapter 5 sets out the summary and conclusions of the report and examines the next steps which
Transport Scotland may wish to consider.
ROUTE SAFETY RESEARCH 1-1SECTION 2 – UNDERSTANDING THE CONTEXT Understanding the Context 2.1 Overview This section outlines the road safety strategy in Scotland and presents a comparison of safety statistics for Scotland, Norway and Sweden to set the context of this research. Both Transport Scotland Road Safety Statistics and EuroStat have been examined to provide a range of analyses of the available road safety data. 2.1.1 Rationale for International Comparison Scotland, a country with a population of some 5.37 million people1 in 2015, has an extensive and largely modern road network covering the extent of the country. The population density across the county varies significantly, from extensively urbanised areas of the central belt (3,412 persons per square kilometre (psqkm) in the Glasgow City Council area) to the largely rural sparsely populated areas of the Highlands (9 persons psqkm in the Highland Council area)2. The country’s location at the northern periphery of Europe results in a predominantly maritime climate, with extensive periods of wet weather and not insignificant levels of snowfall over higher lying areas during the winter periods. Due to its northerly latitude, daylight hours vary significantly across the year, from 17.5 hours of daylight during the summer period to approximately only 7 hours of daylight during the winter period3, in central Scotland. In considering these characteristics, commonalities between Scotland and its Northern European neighbours can be identified. Norway, a country with a population of some 5.18 million people in 20154 and Sweden, a country with a population of some 9.85 million people in 20155, similar to Scotland, also have extensive, largely modern road networks extending across each country. Further similarities with Scotland exist in relation to varying population densities – these vary significantly across Norway and Sweden, from the heavily urbanised population centres of Oslo, Bergen, Stockholm and Gothenburg to the rural, sparsely populated areas of both northern Norway and Sweden. The geographical location of both countries ensures commonalities between the climatic and daylight conditions with Scotland, with considerable rain and snowfall experienced in each country and significant variations in daylight hours across the year. Given the characteristics discussed and their potential influence on road standards, driving conditions and, subsequently, road safety, the Scandinavian nations of Norway and Sweden are judged to provide suitable comparators with Scotland and a suitable basis on which to compare safety trends and statistics. 1 http://www.nrscotland.gov.uk/statistics-and-data/statistics/stats-at-a-glance/infographics-and-visualisations#mid-year-2015 2 http://www.nrscotland.gov.uk/files/statistics/population-estimates/mid-2011/11mype-cahb-table9.pdf 3 http://www.scotlandinfo.eu/daylight-hours-sunrise-and-sunset-times/ 4 https://www.ssb.no/en/befolkning/statistikker/folkemengde 5 http://www.scb.se/en_/Finding-statistics/Statistics-by-subject-area/Population/Population-composition/Population-statistics/Aktuell- Pong/25795/Yearly-statistics--The-whole-country/26040/ ROUTE SAFETY RESEARCH 2-1
SECTION 2 – UNDERSTANDING THE CONTEXT

2.2 EuroStat
Eurostat is the statistical office of the European Union (EU) situated in Luxembourg. It was established
in 1953 and is a Directorate-General (DG) of the European Commission. Eurostat is part of the portfolio
of the Commissioner for Employment, Social Affairs, Skills and Labour mobility and its key role is to
supply statistics to other DGs and supply the Commission and other European Institutions with data so
they can define, implement and analyse Community policies.
EuroStat collects data on transport safety for EU Member States, European Free Trade Area (EFTA) and
candidate countries. The data covers four transport modes: rail, road, inland waterways and air. As
such, Eurostat provides a useful tool for comparing transport conditions across Europe. One such
dataset collected by EuroStat is in relation to road safety. Accident and casualty is available for a
number of European countries and provides a useful data source on which to carry out high level
comparisons of accident numbers and trends across both EU and EFTA countries.

2.2.1      EuroStat Safety Statistics
A comparison of the numbers killed per million inhabitants in Scotland, Norway and Sweden is
presented in Figure 2.1 below.
Figure 2.1 EuroStat Safety Statistics (International Comparison)

As can be seen from the data presented in Figure 2.1, the general trend in numbers killed per million
inhabitants is a reduction within Scotland, Norway and Sweden, across the period examined.

ROUTE SAFETY RESEARCH                                                                                   2-2
SECTION 2 – UNDERSTANDING THE CONTEXT

The 2014 data suggests that while the numbers
killed per million inhabitants in Norway and
Sweden was broadly similar (29 and 28 per million                           2014 Euro Stat Data:
inhabitants respectively) the numbers killed in                                  •    37 killed per million inhabitants in
Scotland were somewhat higher at 37 killed per                                        Scotland
million inhabitants. While the data suggests that
Sweden has been outperforming Scotland in this                                   •    29 killed per million inhabitants in
respect over a number of years, it should be noted                                    Norway
that Scotland is one of the top performing nations                               •    28 killed per million inhabitants in
globally and has a well-developed road safety                                         Sweden
system with a commitment to further
improvement towards a vision of zero road deaths.
A recent update to the data available from Eurostat indicates that the numbers killed per million
inhabitants in each of the three countries continues to fall. In 2015, the numbers killed in Scotland was
30 per million inhabitants. This compares with 23 per million inhabitants in Norway and 27 in Sweden.
While the data continues to suggest that both Norway and Sweden are outperforming Scotland, the
numbers killed per million inhabitants in Scotland continues to fall, notably by the largest absolute figure
of any of the three countries. This suggests that the approach adopted to tackling road safety may be
having a positive impact. Details are presented in Appendix A.

2.2.2        NUTS Statistical Regions
The Eurostat data is disaggregated into NUTS (Nomenclature of Territorial Units for Statistics) Level 2
statistical regions. There are four such regions covering Scotland, namely:
     •    UKM2 - Eastern Scotland
     •    UKM3 - South Western Scotland
     •    UKM5 - North Eastern Scotland
     •    UKM6 - Highlands and Islands
A graphical representation of the NUTS2 regions, and the numbers killed per million inhabitants across
Europe at the NUTS2 level, is presented in Appendix A.
The NUTS2 regions are further subdivided, generally following local authority boundaries (or groups of
local authority boundaries), which are classed as NUTS3 regions. To put into context the NUTS2 regions
at a local authority level, the commonalities between NUTS2 regions and local authorities, at the
estimated population at mid-20146, is presented in Appendix A. Based on the information presented in
Appendix A, the population of the four NUTS2 regions, as of mid-2014, is as follows:
     •    UKM2 - Eastern Scotland - 2,053,610
     •    UKM3 - South Western Scotland – 2,316,990
     •    UKM5 - North Eastern Scotland – 489,450
     •    UKM6 - Highlands and Islands – 487,550
Given the population statistics noted above, it is evident that the total population across each of the
four regions varies significantly. This reflects the fact that the geographical nature of each of the regions
also varies significantly, from the South Western Scotland region (which covers both the densely

6 http://www.nrscotland.gov.uk/statistics-and-data/statistics/statistics-by-theme/population/population-estimates/mid-year-population-
estimates/mid-2015-and-corrected-mid-2012-to-mid-2014/mid-2012-mid-2013-and-mid-2014-corrected-tables
ROUTE SAFETY RESEARCH                                                                                                                    2-3
SECTION 2 – UNDERSTANDING THE CONTEXT
populated central belt and more rural areas of Dumfries and Galloway) to the largely rural region of
Highlands and Islands. Cognisance of this will be required to be taken account of when interpreting
EuroStat statistics which are based on numbers killed per million inhabitants.
A comparison of the numbers killed per million inhabitants within the four Scottish regions identified
within the EuroStat data is presented in Figure 2.2 below.
Figure 2.2 EuroStat Safety Statistics (Scottish Regions)
As can be seen from the data presented in Figure 2.2, the absolute numbers by year and trends in
numbers killed per million inhabitants varies significantly between the four Scottish regions identified
within the EuroStat dataset. While the data suggest general reductions in the numbers killed per million
inhabitants over the periods examined within each of the four regions, the magnitude of the numbers
killed in each of the regions varies significantly.
The data suggests that the numbers killed per
million inhabitants in the Eastern and South 2014 Euro Stat Data:
Western Scotland regions closely track the Scottish • 34 killed per million inhabitants in the
total. This is likely due to the nature of the regions Eastern Scotland region
identified within the Eurostat data. The Eastern • 64 killed per million inhabitants in the
North Eastern Scotland region
and South Western regions cover the major
• 28 killed per million inhabitants in the
population centres of the central belt and as such, South Western Scotland region
the numbers killed per million inhabitants at a • 71 killed per million inhabitants in the
Scotland wide level is likely to be weighed towards Highlands and Islands region
these regions.
The numbers killed per million inhabitants in both the North Eastern Scotland and Highlands and Islands
regions are somewhat higher than the Scottish average and are significantly higher than the Eastern
Scotland and South Western Scotland regions. This is likely due to a number of factors including but not
limited to; the more rural nature of the areas covered by these regions, prevailing weather conditions,
particularly during winter months; lower levels of daylight hours during the winter months; and other
geographical / social causes.
ROUTE SAFETY RESEARCH 2-4SECTION 2 – UNDERSTANDING THE CONTEXT
A recent update to the data available from Eurostat indicates that the numbers killed per million
inhabitants in each of the four regions continues to fall. In 2015, the numbers killed in the Eastern and
South Western Scotland regions was 30 and 23 per million inhabitants, respectively. The numbers killed
in the North Eastern Scotland and Highlands and Islands regions continued to be somewhat higher at 51
and 47 per million inhabitants, respectively. This data indicates, however, that the numbers killed per
million inhabitants has fallen significantly in each of these regions. Details are presented in Appendix A.
A further analysis of available Scottish transport and road safety statistics is presented in Appendix B.
2.3 Scotland’s Road Safety Framework
Scotland has a well-established road safety system and is committed to further improvement towards a
vision of zero road deaths. A key Scottish Government objective is to ensure safe road travel in Scotland
for everyone. Scotland’s Road Safety Framework7, published in 2009, sets out the Framework for
improving road safety in Scotland over the next decade, describes the road safety vision for Scotland,
the aims and commitments, and the Scottish targets for reductions in road deaths and serious injuries to
2020.
An evidence-based mid-term review of the
framework was undertaken in 2015/16. The Scotland’s road safety vision is that there will be:
review, which adopted a participatory approach,
assessed the progress made since the framework
was published in 2009 and identified three key “A steady reduction in the numbers of those
Priority Focus Areas around Speed, Age and killed and those seriously injured, with the
Vulnerable Road Users for further focus. The ultimate vision of a future where no-one is
review report8 was published in March 2016 and killed on Scotland’s roads, and the injury rate is
sets out an approach to ensure continued delivery
much reduced.”
of road safety outcomes towards 2020 casualty
reduction targets and beyond.
2.3.1 Road Safety Targets
The Framework set out a series of targets for improving road safety which are compared to the average
Scottish figures for 2004 to 2008 and are as presented in Table 2.1.
Table 2.1. Scotland’s Road Safety Framework – Road Safety Targets to 2020
Target 2015 Milestone 2020 Target
(% Reduction) (% Reduction)
People Killed 30% 40%
People Seriously Injured 43% 55%
Children (agedSECTION 2 – UNDERSTANDING THE CONTEXT
the trunk road network. Year on year reductions in terms of ‘Killed and Serious Casualties’ and ‘Killed
and Serious Child Casualties’ tend to be below the current pro-rata target.
2.3.2 Framework Commitments
The Road Safety Framework sets out a number of
commitments for delivery broken down into short
Targeted Measures included:
term (one to two years), medium term (two to five
years) and longer term (five to ten years). This • Children and Young People
• Pedestrians
covers a range of individual user groups / impacts
• Motorcyclist
areas.
• Pedal Cyclists
In the context of this research, the measures • Pre-Drivers
targeted at trunk road users are particularly • Drivers Aged 17-25
relevant. • People who Drive for Work
• Older Drivers
The specific short, medium and long term • Drivers from Abroad
measures identified within the framework are • Rural Roads
presented in Table 2.2. • Impairment
• Seatbelts
• Speed
• Distraction
• Trunk Roads
• Local Roads
• Safer Vehicles
ROUTE SAFETY RESEARCH 2-6SECTION 2 – UNDERSTANDING THE CONTEXT
Table 2.2. Scotland’s Road Safety Framework - Trunk Road Commitments
Commitments Short Medium Long
Term Term Term
Undertake Road Protection Score Surveys, for the remaining two-thirds of Scotland’s
trunk road network and determine how this information can complement the existing
processes within the road safety engineering programme.
Continue to consider and implement a range of proactive risk removal strategies to
reduce the severity and frequency of impacts with hazards.
Continue to invest in providing 2+1 overtaking opportunities.
Consider the most appropriate barriers to protect vulnerable users such
Continue to invest in junction improvement schemes.
Rank the worst performing junctions on the trunk road network, by accident frequency
and severity over the last ten years, and prepare a programme to improve selected
locations.
Develop Route Safety Groups for each of the trunk road routes with participation from
relevant road safety partners such as local authorities, police forces, emergency services,
safety camera partnerships, etc.
Examine the possibility for further rollout of TRISS.
Implement Strategic Transport Projects Review including:
– Transport Scotland’s Strategic Road Safety Plan;
– Road Safety Improvements in North and West of Scotland;
– Route Management;
– A82 targeted road improvements;
– Road safety improvements in North and West Scotland;
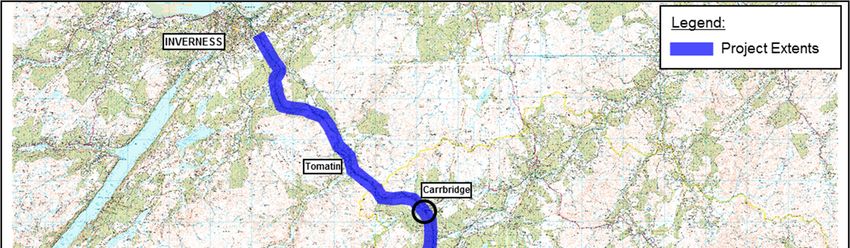
– A9 upgrade from Dunblane to Inverness;
– A96 from Inverness to Nairn Upgrade;
– Targeted Road Congestion/ Environmental Relief Schemes; and
– Dundee Northern Relief Road.
As can be seen from Table 2.2, a key commitment of the Road Safety Framework was the continued
investment in WS2+1 overtaking opportunities in the short, medium and long term. Several WS2+1
schemes have been completed on a number of routes on the trunk road network, as detailed in Figure
C.1 in Appendix C. This type of targeted improvement will be the focus of this research and a number of
‘case studies’ will be examined.
The trunk road improvement projects completed by Transport Scotland over the period 2007 to 2016
are presented in Appendix C.
2.3.3 Other Documents
Transport Scotland has the responsibility for delivering The Scottish Government’s Road Safety
Framework. In doing so, a Strategic Road Safety Plan was published which sets out how Transport
Scotland delivers road safety on the trunk road network.
The first Strategic Road Safety Plan was published in 2007 and supported delivery of the Road Safety
Framework. The current Framework has reached the mid-point of its ten year period and has been
ROUTE SAFETY RESEARCH 2-7SECTION 2 – UNDERSTANDING THE CONTEXT
reviewed in its own right. Transport Scotland, therefore, took the opportunity to update the Strategic
Road Safety Plan in 20169 and to refocus on further reducing the numbers of accidents and casualties on
the trunk road network.
The plan describes Transport Scotland’s approach to implementing safe system principles through an
action plan. This sets out how Transport Scotland intend to complement the traditional approach with
more proactive methods in order to further improve the safety performance of the Scottish trunk road
network. Twenty actions in total were identified, which sit under the following key headings:
• Safer Roads and Roadside
• Safer Users
• Safer Speeds
• Safer Management
Action 13 under the ‘Safer Speeds’ heading related to trunk road speed enforcement. It was considered
that through targeted safety camera enforcement and improving driver behaviour, the purpose of the
Scottish Safety Camera Programme is to contribute to Scotland’s road safety vision and road safety
targets as set out in the Scottish Government’s Road Safety Framework to 2020.
Targeted safety camera enforcement has been trialled on the A77 between Bogend Toll and Ardwell Bay
(implemented in 2005). A further system was installed on the A9 between Dunblane and Inverness in
2014. This type of targeted improvement has been examined as a ‘case study’ as part of the research.
9 http://www.transport.gov.scot/system/files/documents/reports/TS_Strategic_Road_Safety_Plan_2016_Digital_Sep_2016.pdf
ROUTE SAFETY RESEARCH 2-8SECTION 3 - SCOTTISH CASE STUDIES
Scottish Case Studies
3.1 Overview
For the purposes of this research, three routes (on which significant investment in targeted
infrastructure improvements have been made in recent years) have been considered. These routes are
as follows:
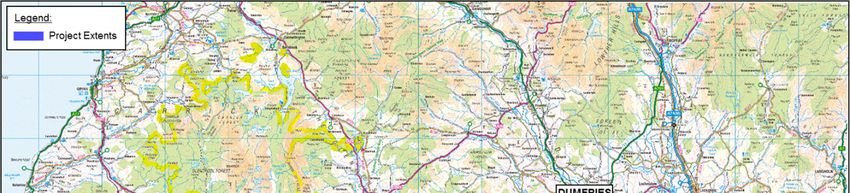
• A75 – Gretna to Stranraer
• A77 – Fenwick to Stranraer
• A9 – Dunblane to Inverness
These routes (or sections of routes) have been considered due to the nature of the targeted
improvements implemented and their relevance to this research. In line with the objectives set out
within the various routes’ Route Action Plans (RAPs), targeted improvements to enhance both the level
of service and safety of the routes have been delivered in recent years by Transport Scotland. These
include providing sections of WS2+1 carriageway (to improve and enhance overtaking opportunities)
and the implementation of safety camera systems, the aim of which is primarily to improve safety on
routes where accident numbers and severities are greater than national average values.
The three routes selected have seen improvements of the nature of those described above in recent
years and, as such, provide suitable ‘case studies’ on which to base this study. A description of the
targeted improvements examined as part of this research (WS2+1s and Safety Camera Systems) and a
detailed analysis of the impacts of each of the improvements identified is given in the Appendix D. A
summary of the findings of each is presented below.
3.2 Case Study Findings
A total of six case studies were examined to identify the impacts and emerging safety trends following
implementation. Relevant data was available for five of the six projects examined. The findings from
the case studies are summarised below.
3.2.1 WS2+1s
The overarching findings from a review of the four WS2+1 case studies are as follows:
• The length of the WS2+1 projects examined varied between 0.9 kilometres to 2.9 kilometres.
• Three of the four WS2+1 projects facilitated overtaking for traffic travelling in one direction only
(A75 Barfil to Bettyknowes, A75 Planting End to Drumflower & A9 Carrbridge).
• While the projects examined were developed as part of a wider route strategy, two of the four
projects (A75 Barfil to Bettyknowes & A9 Carrbridge) were located somewhat distinctly from
other overtaking sections.
• WS2+1 projects were implemented on routes with AADT flows of between 3,500 vpd to 9,500
vpd.
• WS2+1 projects were implemented on routes where the percentage of HGVs was between 8%
and 11%.
• There were notable reductions in the number and severity of accidents and casualties occurring
following opening of two of the four WS2+1 projects examined (A77 Park End to Bennane & A9
Carrbridge).
ROUTE SAFETY RESEARCH 3-1SECTION 3 – UNDERSTANDING THE CONTEXT
• An increase in the number of accidents or severity of casualties were noted for two of the four
WS2+1 projects examined (A75 Barfil to Bettyknowes & A75 Planting End). Examination of the
available RSAs, however, suggested that accidents occurring post opening were not attributable
to the design or layout of the project.
3.2.2 Safety Camera Systems
The overarching findings from a review of the two safety camera system studies are as follows:
• The length of the sections of carriageway over which the schemes were implemented varied
between 60 kilometres and 220 kilometres.
• The schemes covered both dual and single carriageway sections.
• The routes on which safety camera schemes were implemented had AADT flows varying
between 6,500 vpd and 35,000 vpd.
• Safety camera schemes were implemented on routes where the percentage of HGVs was
between 8% and 17% of the total traffic observed.
• There were notable reductions in the number and severity of accidents and casualties occurring
following opening of both of the projects examined.
• There were notable reductions in the average speed of vehicles travelling on routes subject to
speed camera systems following opening, where data is available.
• There were notable reductions in the number of vehicles travelling at excessive speeds travelling
on routes subject to speed camera systems following opening, where data is available.
• Detailed statistics of the number and severity of accidents and casualties and vehicle speed data
was unavailable for one project (A77 Bogend Toll to Ardwell Bay).
While detailed statistics were unavailable at the time of writing for the A77 Bogend Toll to Ardwell Bay
safety camera system, the A77 scheme has now been in operation for over 10 years, and as such, a
considerable amount of data has been collected. The latest headline figures covering the last three
years to July 2015 indicate that there has been a 77% reduction in fatal casualties and a 74% reduction
in serious casualties compared with the original baseline published in 2005. This suggests the system
has been successful in its aim of contributing to improvements in road safety.
3.3 Other Mitigations
In addition to the WS2+1 and safety camera schemes examined, Transport Scotland continue to invest in
the trunk road network to improve road safety. In recent years, a number of individual junction
improvements, such as the A9 Ballinluig and A9 Bankfoot junctions have been upgraded to mitigate
specific safety issues at these locations. Several bypass schemes have been delivered, including the A68
Dalkeith Bypass and the A82 Crianlarich Bypass, providing significant safety benefits for communities
through the removal of strategic trunk road traffic.
Evaluations undertaken by Transport Scotland confirm that bypass and targeted junction improvement
projects are likely to have the most significant impact on road safety, with the greatest reduction in
accidents observed following their construction. It can be concluded, therefore, that continued
investment in the trunk road network is contributing to improving safety and is aiding in reducing the
number of fatal and serious accidents occurring. Details of Transport Scotland’s evaluation programme
can be found at http://www.transport.gov.scot/road/project-evaluation.
Dualling of the major routes between Scotland’s cities is a key Scottish Government transport
commitment. Transport Scotland is pressing ahead with the dualling of the A9 between Perth and
ROUTE SAFETY RESEARCH 3-2SECTION 3 – UNDERSTANDING THE CONTEXT
Inverness, with both construction and design work currently ongoing on several sections. Design work is
also progressing on the dualling of the A96.
Transport Scotland also has a strong record of applying other innovative techniques and using emerging
technologies to reduce casualties and positively influence driver behavior. Innovations have varied from
route strategies to single location improvements to address site specific issues, including:
• Introduction of intelligent road studs at Sheriffhall Roundabout on the A720 to the south of
Edinburgh
• Installation of speed activated traffic signals on the A78 at Fairlie, in Ayrshire
In the case of Sheriffhall Roundabout and the introduction of intelligent road studs, an evaluation
undertaken10 following their installation suggests that the studs have a positive impact on driver
behaviour when in the context of a spiral marked roundabout. The lane discipline of vehicles is likely to
be improved and the probability of vehicle conflicts is reduced.
Transport Scotland continues to monitor specific sites where issues are observed and will assess the
need for innovative solutions to address operational concerns.
10
http://www.google.co.uk/url?sa=t&rct=j&q=&esrc=s&source=web&cd=10&ved=0ahUKEwj2vNyXoerSAhUnj1QKHXDXDjgQFghDMAk&url=http
%3A%2F%2Fabstracts.aetransport.org%2Fpaper%2Fdownload%2Fid%2F4577&usg=AFQjCNEGOI5Z0Zw6fjIV4IWRxzfPrGQO4Q
ROUTE SAFETY RESEARCH 3-3SECTION 4 - INTERNATIONAL CONTEXT International Context 4.1 Overview As outlined in Section 2, it is clear that while road safety in Scotland has been generally improving over the past decade, the available statistics indicate that Norway and Sweden, two countries of comparable geography, climate and population to Scotland, perform markedly better in regard to the safety performance of their primary road networks. This section examines the international research that has been undertaken surrounding road safety trends with a focus on the Norwegian and Swedish context. A focus on specific targeted road improvement measures in both Norway and Sweden is also discussed. An examination of other relevant road safety research has also been undertaken. 4.2 Background to International Research The International Traffic Safety Data and Analysis Group (IRTAD)11 is a permanent working group of the International Transport Forum at the Organisation for Economic Co-operation and Development (OECD). The working group comprises road safety experts and statisticians from renowned safety research institutes, national road and transport administrations, international organisations, universities, automobile associations, the automobile industry, and others from both OECD and non-OECD countries. IRTAD’s Road Safety Annual Report series12 provides a yearly overview of road safety performance in member and observer countries. It presents a synthesis of the latest trends in member countries as well as detailed reports for each country, outlining the crash data collection process, the road safety strategies and targets in place. It also provides detailed safety data by road user, location and age together with information on recent trends in speeding, drink-driving and other aspects of road user behaviour. IRTAD’s main objectives are to contribute to international co-operation on safety data and its analysis. Its key outputs are the IRTAD Database (that currently publishes safety data from 32 countries) and its annual report on road safety performance. It also conducts regular research and analysis on topics related to safety data analysis including forecasting, relationship between speed and crash risks, road safety and economic developments. The IRTAD Road Safety Annual Report includes specific analysis of road safety trends, strategies and targets for both Norway and Sweden. These are examined in more detail in the following sections. 11 http://www.itf-oecd.org/IRTAD 12 http://www.oecd-ilibrary.org/transport/road-safety-annual-report_23124571 ROUTE SAFETY RESEARCH 4-1
SECTION 4 – UNDERSTANDING THE CONTEXT

4.3 The Norwegian Context
4.3.1       Overview
The Norwegian Public Roads Administration (NPRA)
- Statens Vegvesen - is responsible for the planning,     The NPRA’s vision in relation to road safety is :
construction and operation of the national and
county road networks. On matters pertaining to
national roads, the NPRA is under the direction of        “A vision of no road fatalities or road accidents
the Ministry of Transport and Communications.             causing lifelong injury is set out for the long
The NPRA is under the leadership of the
                                                          term road safety effort”
Directorate of Public Roads, which is an
autonomous agency of the Ministry of Transport
and Communication.
The Norwegian road network, as of 2010, comprised 92,000 kilometres of public roads, of which 10,000
kilometres were classed as national roads with a further 44,000 classed as county roads. Municipal
roads comprised 38,000 kilometres with approximately 300 km of multilane motorways and 450
kilometres of 2-lane motorways.
In Norway, traffic safety policy is co-ordinated by the NPRA. Main national stakeholders include the
NPRA, the police, the public health and education administrations, together with leading non-
governmental organisations. At regional and local levels, counties and municipalities play a very
important role. Norwegian road safety policy relies on a broad and collaborative approach, a common
and shared strategy and co-ordination among all stakeholders.

4.3.2       International Research Findings
IRTAD’s Road Safety Annual Report, 2015 edition, presents 2014 road safety data for Norway along with
provisional data from 2015. The report examines trends in traffic and road safety from the years 1990
to 2015 and road user behaviour patterns. This included data on speed, drink driving, drugs and driving,
distracted driving, fatigue and seat belt usage. The report also puts the findings into the context of
Norway’s road safety strategy and national targets to 2024 and comments on the progress achieved
thus far. A review of recently implemented safety measures is also undertaken. These are examined in
more detail below.

4.3.2.1     Norwegian Road Safety Strategies and Targets
The IRTAD report identified the current road safety strategies (2014 - 2024) and targets. The Road
Safety Strategy (2014 - 2024) is informed by a Vision Zero strategy adopted by the Norwegian
Parliament in 2001. The Norwegian Vision Zero involves all modes of transport and the main focus is to
reduce crashes that can lead to fatalities and serious injuries. The highest priority is given to the
reduction of head-on crashes, single vehicle crashes and collisions with cyclists and pedestrians. Special
attention is also paid to high-risk road users, such as young drivers, elderly road users and motorcyclists.
A National Plan of Action for Road Traffic safety is published every fourth year. The current plan covers
the period 2014-1713 and is embedded in the National Transport Plan 2014-2024. The plan highlights
the current road safety challenges in Norway and describes the measures that will be implemented from
2014-17 to move towards the national target of no more than 500 fatalities and severe injuries by 2024.

13
http://www.vegvesen.no/_attachment/646945/binary/968554?fast_title=National+Plan+of+Action+for+Road+Traffic+Safety+2014%E2%80%93
2017.+Short+version.pdf
ROUTE SAFETY RESEARCH                                                                                                        4-2
SECTION 4 – UNDERSTANDING THE CONTEXT
The specific goal of the plan was initially to halve the number of killed and seriously injured by 2024,
when compared to the average for the period 2008-11. A modelling exercise based on existing
knowledge shows that it is possible to reach 630 fatalities and seriously injured by 2024. By taking into
account the fact that it is not possible to assess the effect of all measures and that new technology may
bring additional benefits, a new target was set of no more than 500 fatalities and seriously injured by
2024.
The NPRA continuously monitors developments concerning fatalities and the seriously injured, in
addition to a set of safety performance indicators, related to speed, seat belt wearing and heavy vehicle
safety standards.
4.3.2.2 Recently
Recently Implemented Safety Measures
The IRTAD report identified a number of recent safety measures introduced over the period 2013 to
2016. These included:
• Road user education and awareness.
• An ongoing speed campaign has been updated with a focus on young drivers. The campaign of
sharing the road (cyclists and cars) is ongoing and the seat belt campaign is updated with
wearing seat belts in buses.
• The NPRA use of a camera system for ANPR as a tool to carry out inspection tasks. The system is
one of many measures adopted in order to achieve inspection objectives more efficiently. In
2015, the NPRA started a pilot project aiming to enforce compliance with the new requirement
of an electronic toll payment tag for business vehicles. The requirement applies to both
Norwegian and foreign vehicles on Norwegian roads.
4.3.2.3 Recent and Ongoing Research
The IRTAD report identified a number of recent and ongoing research projects. These included:
• A 5-year (2013-17) research programme Better Safety in Traffic being carried out by the NPRA,
the purpose of which is to assess the potential for reducing the numbers of fatal and serious
injuries and identify areas where the greatest returns can be made in the coming years. In 2015,
there was specific research and analysis on all cyclist accidents registered by the emergency
centre of Oslo. A similar study will be undertaken in 2016 for pedestrians.
• A study on crashes, driving behaviour and safety attitudes among novice drivers published by
the Institute of Transport Economics (TØI) in 2013 (TØI report 1287/2013), demonstrating that
novice drivers who received their license in 2011-12 had more positive road safety attitudes,
better driving behaviour, and lower crash involvement risk during the first months of solo
driving, compared to drivers who obtained their license in 2004.
• A study on the crash effects of speed cameras, published in 2014 (TØI report 1384/2014)
demonstrating that speed cameras have a general positive impact on the number of injury
accidents occurring, considering differing lengths of road between camera locations.
• A study on trends on the risk of apprehension for traffic offences, published in 2014 (TØI report
1361/2014) suggesting measures to reduce traffic violations included; installation of feedback
signs for motorists, increasing conventional police enforcement and increasing the use of
section control by speed cameras.
• An evaluation report on the crash effects of road section control by average speed cameras,
published in 2014 (TØI report 1339/2014), demonstrating that significant reductions in injury
accidents by up to 21%.
ROUTE SAFETY RESEARCH 4-3You can also read