Risks of Ear Complaints of Passengers and Drivers While Trains Are Passing Through Tunnels at High Speed: A Numerical Simulation and Experimental ...
←
→
Page content transcription
If your browser does not render page correctly, please read the page content below
International Journal of
           Environmental Research
           and Public Health

Article
Risks of Ear Complaints of Passengers and Drivers
While Trains Are Passing Through Tunnels at High
Speed: A Numerical Simulation and
Experimental Study
Pengpeng Xie 1,2 , Yong Peng 1,3 , Tiantian Wang 1,3, * and Honghao Zhang 1,2
 1    Key Laboratory of Traffic Safety on Tracks, Ministry of Education, School of Traffic & Transportation
      Engineering, Central South University, Changsha 410075, China; paulxie14@csu.edu.cn (P.X.);
      yong_peng@csu.edu.cn (Y.P.); zhanghh2016@csu.edu.cn (H.Z.)
 2    Joint International Research Laboratory of Key Technology for Rail Traffic Safety, Central South University,
      Changsha 410075, China
 3    National & Local Joint Engineering Research Center of Safety Technology for Rail Vehicle, Central South
      University, Changsha 410075, China
 *    Correspondence: wangtt1107@126.com; Tel.: +86-13401157826

 Received: 12 March 2019; Accepted: 6 April 2019; Published: 10 April 2019

 Abstract: Ear complaints induced by interior pressure transients are common experiences for
 passengers and crew members when high-speed trains are passing through tunnels. However,
 approaches to assessing the risks of the pressure-related aural discomfort have not been reported
 until recently. The objective of this study was to evaluate the hazards of interior pressure transients
 of high-speed train on human ears combining the effects of operation speed and seal index. Moving
 model tests were conducted to obtain the pressure transients when the model train runs in the tunnel.
 The recorded data were transformed into the interior pressures by empirical formula. Furthermore,
 the aural sensations were divided into four levels hierarchically and the range for each level was
 derived by logistic regression analysis method and represented by three biomechanical metrics.
 Furthermore, a human middle ear finite element (FE) model was used to simulate its dynamics under
 the interior pressures. The results indicate that lifting operation speed from 250 km/h to 350 km/h
 in tunnel will prolong the duration of ear complaints by more than two times whereas improving
 the seal index from 4 s to 12 s will reduce the incidences of the onset of tinnitus and hearing loss
 by more than ten times. In addition, the duration of aural comfort shortens from the head car to
 the tail car against the running direction. It is desirable that enhancing the seal index improve the
 aural sensations of the passengers and crew members considering the lifting operation speed of
 high-speed train.

 Keywords: high-speed train; aural discomfort; human middle ear FE model; moving model tests;
 tunnel environment

1. Introduction
      Due to the interactions between air, rail and train, a wide variety of concerns have emerged
relating to aerodynamic noise, resistance, environmental and public health issues [1,2]. However,
the interactions intensify when high-speed trains pass through a tunnel. This simultaneously gives
rise to pressure fluctuations inside the train, which cause aural discomfort in the passengers and
crew members [3]. In China, a large number of tunnels have been constructed ranging from
hundreds of meters to tens of kilometers in length. For train drivers with long years of service

Int. J. Environ. Res. Public Health 2019, 16, 1283; doi:10.3390/ijerph16071283       www.mdpi.com/journal/ijerph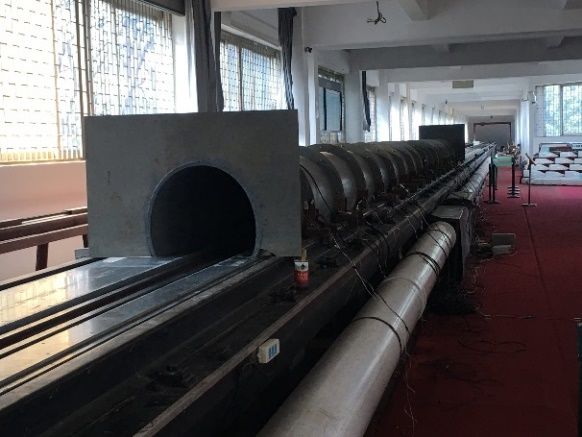
Int. J. Environ. Res. Public Health 2019, 16, 1283                                                     2 of 20

in areas with numerous tunnels, the risks of suffering ear diseases are increased significantly [4].
Similarly, passengers travelling by the train undergo aural discomfort when the trains enter the tunnel.
The aural sensations present with various symptoms such as aural fulness, otalgia, dizziness, temporal
hearing loss and tinnitus, etc. [5,6]. Hence, the train-tunnel effect poses hazards to riding comfort and
otological health.
      Many efforts have been made to mitigate the negative consequences of interior pressure
fluctuations on the passengers and crew members when a train passes through a tunnel. For example,
Muñoz-Paniagua implemented a genetic algorithm to minimize the pressure gradient through
optimization of the shape of the train nose [7]; the addition of different hood patterns at the tunnel
entrance also alleviates the amplitudes of pressure gradients [8,9]. Matsubayashi et al. proposed an
active control technique to downsize the pressure wave by emitting a wave which was superposed on
the incident wave in the tunnel [10]. Despite the fact these findings highlighted that decreasing the
pressure gradient and amplitude produced positive effects, it was not clearly elucidated how human
ears respond to the ambient pressure fluctuations.
      Ears, including the outer ear, the middle ear and the inner ear, are essential for humans to perceive
ambient sounds and identify their direction. The middle ear is composed of the tympanic membrane
(TM), the malleus, the incus, the stapes and the suspensory ligaments and tendons. It should be
emphasized that the TM is responsible for converting the ambient pressure changes into mechanical
vibrations and transmitting them to the inner ear by the ossicle chain path. The vibration transfers to
the stapes footplate (SFP) until it is received by the inner ear. In healthy ears, large pressure fluctuations
are certain to incur large vibration of both TM and SFP and in turn result in aural discomfort. It is
obvious that the TM and the SFP play critical roles in whether and how much the pressure fluctuations
are perceived by ears. Previous researches used human ear finite element models to investigate the
middle ear functions as well as pathologies [11,12]. Kalb and Price have developed an auditory hazard
assessment algorithm for humans (AHAAH) to predict the potential influences of impulsive noise on
human ears [13,14]. However, frequency-independent pressure waves induced by train-tunnel effect
are different from frequency-dependent noise or impulsive sounds and the hazards on ears caused by
noise were generally judged by sound pressure level or the exposure duration [15,16]. Furthermore,
the latent risks on human ears induced by the micro pressure waves generated by a high-speed train’s
passing through tunnels has not been investigated until recently.
      This study proposed a kind of biomechanical approach to predict the potential aural sensations
that passengers and crew members may experience in a tunnel during travel by train. The core of this
approach depends on two steps. One is to establish a uniform rule that correlates the characteristics
of pressure fluctuation and the dynamics of human middle ear. The other is to collect the data of the
interior pressure transients and to simulate the vibration of ear model under these pressure transients.
Firstly, moving model aerodynamic tests were done on our lab’s aerodynamics platform by which the
pressure transients in different car positions were collected. In sequence, the assessment standards
were established and the recorded pressure data was exerted on the TM. By comparing the simulation
results with the standards, assessment of the aural sensations was made throughout the trains’ travel in
the tunnel. Furthermore, it sheds light on the evaluation of the attempts on improving the aerodynamic
environments when the trains run or intersect in a tunnel.

2. Materials and Methods

2.1. Human Middle Ear Finite Element Model
     Eight adult volunteers (seven males and one female, age: 21–31) were recruited and regular
ear-nose-throat (ENT) medical examinations were completed before computed tomography (CT)
scanning. This was done because it should ensure the individuals have no ear-related diseases that
may affect the efficacy of the reconstructed ear model. Two volunteers were excluded due to otitis
media and rhinitis diseases. By collecting the CT scanning data, one ear (right ear) of a male volunteer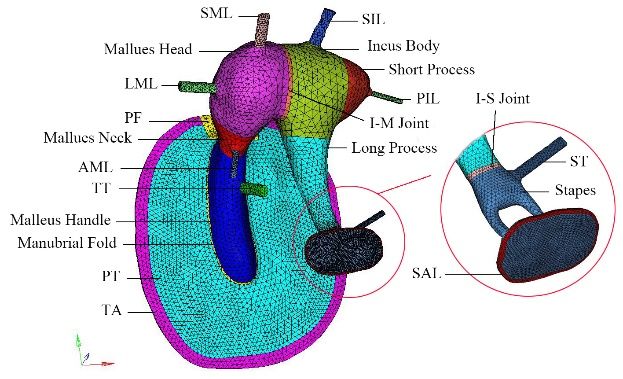
Int. J. Environ. Res. Public Health 2019, 16, 1283 3 of 20
Int. J. Environ. Res. Public Health 2018, 15, x 3 of 20
was selected for reconstruction. The human middle ear finite element model was reconstructed in
accordance
accordance with
with CT
CT scanning
scanningdata.
data. It
It was
was comprised
comprised of
of the
the TM,
TM, the
the malleus,
malleus, the
the incus
incus and
and the
the stapes
stapes
bones,
bones, two
two joints
joints and
and the
the suspensory
suspensory ligaments
ligamentsas
asshown
shownin inFigure
Figure1.1.
(a) (b)
Figure 1.
Figure 1. Human
Human middle
middle ear
ear biomechanical
biomechanical finite
finite element
element model;
model; (a)(a) ossicle
ossicle bones
bones on
on head
head computed
computed
tomography(CT)
tomography (CT)scanning;
scanning;
(b)(b)
earear model.
model. Note:Note: TA: tympanic
TA: tympanic annulus,annulus,
PT: parsPT: parsPF:
tensa, tensa,
pars PF: pars
flaccida,
flaccida,
TT: tensorTT: tensor tympani,
tympani, AML:mallear
AML: anterior anteriorligament,
mallear ligament,
LML: lateralLML: lateralligament,
mallear mallear ligament, SML:
SML: superior
superiorligament,
mallear mallear ligament,
I-M joint: I-M joint: incudomalleolar
incudomalleolar joint, SIL:joint, SIL: incudal
superior superiorligament,
incudal ligament, PIL:
PIL: posterior
incudal ligament,
posterior incudal ST: stapedial
ligament, ST:tendon,
stapedialSAL: stapedial
tendon, SAL:annular
stapedialligament.
annular ligament.
ItIt is
is noteworthy
noteworthy thatthat the
the auricle,
auricle, the
the external
external airair canal
canal and
and the
the inner
inner ear
ear were
were eliminated
eliminated because
because
the
the outer ear is primarily responsible for sound collection and amplification whilethe
outer ear is primarily responsible for sound collection and amplification while the inner
inner ear
ear is
is too
too
complicated
complicatedto tosimulate
simulateasasa aresult ofof
result itsits
functional
functional mechanism
mechanism[17]. Since
[17]. the the
Since TM TM
and and
the SFP
the are
SFPtwo are
dominant components and play key roles in energy transmission
two dominant components and play key roles in energy transmission and conversion, suchand conversion, such simplification
would not downplay
simplification wouldthe notresults of thethe
downplay earresults
dynamics [12].
of the earThe model was
dynamics [12].constrained
The model atwas theconstrained
ring of the
TM and
at the theof
ring endthefaces
TM andof the
thesuspensory
end faces of ligaments and tendons
the suspensory except
ligaments andfortendons
the SALexcept
[18]. With regard
for the SAL
to the SAL, the nodes of its circumference were clamped. Besides, as a replacement
[18]. With regard to the SAL, the nodes of its circumference were clamped. Besides, as a replacement of the inner ear,
four
of thedashpots
inner ear, were
fourcreated
dashpotsat the periphery
were created at of the
the periphery
SFP [11]. Meanwhile, the pressure
of the SFP [11]. transients
Meanwhile, were
the pressure
loaded at the lateral side of the TM.
transients were loaded at the lateral side of the TM.
2.2.
2.2. Division
Division of
of Aural
Aural Discomfort
Discomfort Level
Level
Japanese
Japanese scientists
scientists have
have conducted
conducted airtightness
airtightness experiments
experiments of of the
the train
train cabin
cabin and
and revealed
revealed the the
correlations
correlations between the pressure changes and the aural discomfort [19]. The experiments were
between the pressure changes and the aural discomfort [19]. The experiments were done
done
in
in aa range
range of of no
nomore
morethanthan33kPa kPaandand0.5
0.5kPa/s.
kPa/s. InIn this
this study,
study, the
the four
four aural
aural discomfort
discomfort levels
levels were
were
hierarchically
hierarchically ordered as ideal, good, bad and worse. In detail, the ideal level represents when human
ordered as ideal, good, bad and worse. In detail, the ideal level represents when human
ears
ears hardly
hardly perceive
perceive the the ambient
ambient pressure
pressure changes,
changes, thethe good
good level
level represents
represents earsears that
that sense
sense the the
pressure changes but no ear complaints occur, whereas aural discomfort
pressure changes but no ear complaints occur, whereas aural discomfort sensations start from the sensations start from the
bad
bad level
level andand the
the ears
ears become
become intolerant
intolerant to
to such
such aa change.
change. The The worse
worse levellevel is
is likely
likely to
to happen
happen ifif thethe
pressure
pressure changes intensify in amplitude and gradient. According to the experimental data, aa total
changes intensify in amplitude and gradient. According to the experimental data, total of
of
116 pressure conditions were designed and exerted on the TM surface.
116 pressure conditions were designed and exerted on the TM surface. There are 19 conditions for There are 19 conditions for the
ideal level,
the ideal 20 for
level, 20the
for good
the goodlevel, 38 for
level, 38the
forbad levellevel
the bad and and
39 for39the
forworse
the worselevel.level.
What
What deserves
deserves attention
attention is is that
that three
three indicators
indicators were
were picked
picked as as the
the output
output variables
variables and
and named
named
as
as I1, I2 and I3 which respectively are the displacement of the TM umbo (the central position of
I1, I2 and I3 which respectively are the displacement of the TM umbo (the central position of TM),
TM),
the
the displacement
displacement of of the
the SFP
SFP andand thethe velocity
velocity ofof the
the SFP.
SFP. As
As the
the TM
TM is is the
the most
most sensitive
sensitive organ
organ of of the
the
human ears to barometric variations and closely related to the discomfort sensations
human ears to barometric variations and closely related to the discomfort sensations like aural fulness like aural fulness
and
and otalgia,
otalgia,I1I1isismuch
mucha acompetent
competent predictor
predictorto evaluate
to evaluate these manifestations
these manifestations [20].[20].
Moreover,
Moreover,the TM the
umbo is usually considered as a fundamental reference point to present
TM umbo is usually considered as a fundamental reference point to present the dynamics of the the dynamics of the middle
ear [21]. ear
middle On [21].
the other
On thehand,
other thehand,
SFP isthe
connected to the ovaltowindow
SFP is connected the ovalofwindow the inner ofear,
thethe oscillation
inner ear, the
of the middle ear excites the vibration of the inner ear as well. Thus, the
oscillation of the middle ear excites the vibration of the inner ear as well. Thus, the pressure-related pressure-related vertigo
or vomiting
vertigo are thought
or vomiting to be correlated
are thought with the
to be correlated large
with thevalues of I2 [22].
large values of I2 Furthermore,
[22]. Furthermore, I3 is I3
a key
is a
key determinant for the generation of the pressure gradient between the oval window and the round
window [23,24]. The pressure gradient in turn triggers bioelectrical signal in the cochlear which was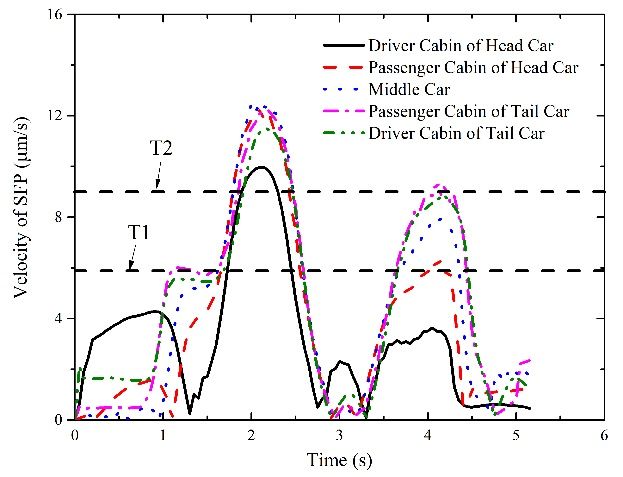
The responses of the three indicators were then analyzed by the logistic regression method. A
binary coding approach was used to obtain the risks of one aural discomfort level under certain
exposures. For example, the results derived from the ideal level were coded as 0 while those from the
good level were coded as 1. Based on the outcomes of logistic regression, S-shaped regression curves
can be generated according to function in Equation (1) [25]:
Int. J. Environ. Res. Public Health 2019, 16, 1283 4 of 20
p ( x) 1 (1)
(1 e( x ) )
determinant for the generation of the pressure gradient between the oval window and the round
where α is the intercept and β is the regression coefficients of exposures of the indicators. The
window [23,24]. The pressure gradient in turn triggers bioelectrical signal in the cochlear which was
parameters were determined by maximum likelihood method to maximize the function’s fit to the
transduced to the brain. As a result, the aural sensations were perceived and identified. Thus, I3 is a
data. Likewise, the same procedure was used to obtain the regression curves between other levels.
good indicator to assess the inner-ear-related aural discomfort.
The responses of the three indicators were then analyzed by the logistic regression method.
2.3. Moving Model Aerodynamic Tests
A binary coding approach was used to obtain the risks of one aural discomfort level under certain
Moving
exposures. Formodel
example,teststhe
of results
trains passing through
derived from the aideal
tunnel
levelwere
werecarried
coded asout0 at the those
while Central South
from the
University's moving model test platform in China, for the application
good level were coded as 1. Based on the outcomes of logistic regression, S-shaped regression curvesof the numerical method
introduced
can in thisaccording
be generated manuscript. The test platform
to function in Equation has(1)
obtained
[25]: China Metrology Accreditation (CMA)
qualification (certificate number 2014002479K). More detailed information about the platform can be
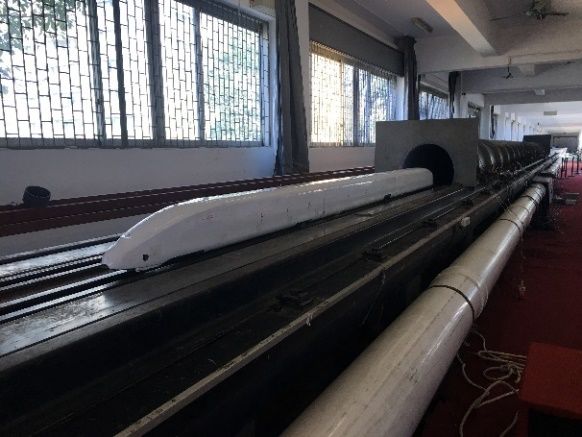
found in [26,27]. A certain type of three car 1 train (79.77 m in length) and a 70 m2 standard
p( xmarshalling
)= α− βx ) )
(1)
single-car tunnel (350 m in length) are adopted in + e(test,
(1 the as is shown in Figure 2. All the models are
scaled down to 1:20 in the test. The operating speeds are 250 km/h, 300 km/h and 350 km/h,
where α is the intercept and β is the regression coefficients of exposures of the indicators. The
respectively. Each case is repeated 12 times, whose acceptability in terms of train speed is examined.
parameters were determined by maximum likelihood method to maximize the function’s fit to the
Tests that do not meet the accuracy of ±0.3% of the target train speed are discarded.
data. Likewise, the same procedure was used to obtain the regression curves between other levels.
The aerodynamic effects caused by a real train passing through a tunnel can be effectively
simulated
2.3. Movingusing
Modelscaled modelsTests
Aerodynamic and moving model experimental devices if a similarity criterion is
satisfied. The Mach number, blockage ratio, scaling of the train and tunnel geometry, and the
Moving
Reynolds modelare
number tests
theofmain
trainssimilarity
passing through
parameters a tunnel
needed were carried
to be out at the
considered for Central South
the similarity
University’s moving model test platform in China, for the application of
criterion [27–31]. The first three parameters of the moving model tests in this manuscript are agree to the numerical method
introduced
the similarityin this manuscript.
criterion. The testnumber
The Reynolds platforminhas thisobtained
study isChina Metrology
from 9.69 Accreditation (CMA)
× 105 (corresponding to 250
qualification (certificate number 2014002479K). More detailed information
km/h) to 1.36 × 10⁶ (corresponding to 350 km/h) and that of the real train is from 1.94 about the× platform
107 to 2.71can be7.
× 10
found in [26,27]. 2
According to theAEN certain type of
Standard three car
14067–4 marshalling
[32], when the trainReynolds(79.77number
m in length)
of theand a 70model
scaled m standard
test is
single-car tunnel (350 m in length) are adopted in the test, as is shown
larger than 2.5 × 10⁵, the aerodynamics coefficients are nearly invariable with increasing in Figure 2. All the models
Reynolds
are scaled[27,30,31,33].
numbers down to 1:20 Asina the test.theThe
result, operating
results speeds
of moving are tests
model 250 km/h, 300 km/h
of simulating and
a real 350passing
train km/h,
respectively.
through a tunnel Eachiscase is repeated
reliable and the12aerodynamics
times, whose coefficients
acceptabilityofinmovingterms ofmodel
train speed is examined.
tests can represent
Tests that do not meet
that of the real train. the accuracy of ± 0.3% of the target train speed are discarded.
(a) (b)
Figure 2. Moving model tests of aerodynamics in tunnels. (a) model train; (b) model tunnel.
The positions
aerodynamic effects caused
of measurement by a are
points realset
train passinginthrough
as shown a tunnel
Figure 3. can be effectively
A DC030NDC4 pressure
simulated using scaled
sensor (Honeywell, models
Morris and NJ,
Town, moving
USA)model
was experimental devices
selected for the if a similarity
pressure criterion
measurements. is
The
satisfied. The Mach number, blockage ratio, scaling of the train and tunnel geometry, and the Reynolds
number are the main similarity parameters needed to be considered for the similarity criterion [27–31].
The first three parameters of the moving model tests in this manuscript are agree to the similarity
criterion. The Reynolds number in this study is from 9.69 × 10⁵ (corresponding to 250 km/h) to
1.36 × 10⁶ (corresponding to 350 km/h) and that of the real train is from 1.94 × 10⁷ to 2.71 × 10⁷ .
According to the EN Standard 14067–4 [32], when the Reynolds number of the scaled model test is
larger than 2.5 × 10⁵ , the aerodynamics coefficients are nearly invariable with increasing Reynolds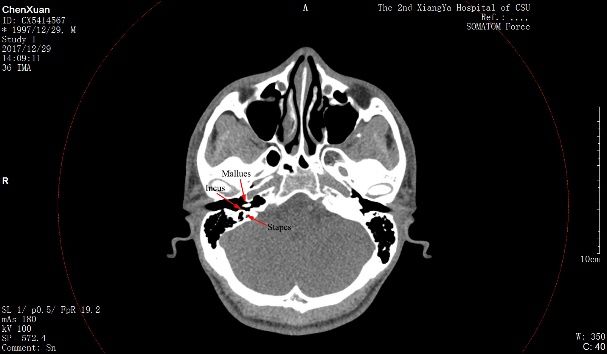
Int. J. Environ. Res. Public Health 2019, 16, 1283 5 of 20
numbers [27,30,31,33]. As a result, the results of moving model tests of simulating a real train passing
through a tunnel is reliable and the aerodynamics coefficients of moving model tests can represent that
of the real train.
The positions of measurement points are set as shown in Figure 3. A DC030NDC4 pressure
Int. J. Environ. Res. Public Health 2018, 15, x 5 of 20
sensor (Honeywell, Morris Town, NJ, USA) was selected for the pressure measurements. The sampling
frequency
sampling of sensors, of
frequency in this set ofintests,
sensors, this isset
1 kHz. Before
of tests, is 1each
kHz.test, every
Before sensor
each test,must
everybesensor
recalibrated to
must be
the normal function of the sensors. The errors of the loading test are within 0.2%,
recalibrated to the normal function of the sensors. The errors of the loading test are within 0.2%, which is considered to
meet
which theistest accuracy to
considered requirements.
meet the test Theaccuracy
average values of the pressure
requirements. transients
The average of the
values ofmeasurement
the pressure
points on the train surface (numbered as MP-1, MP-2, MP-3, MP-4,
transients of the measurement points on the train surface (numbered as MP-1, MP-2, MP-3, MP-5) are selected for study,
MP-4,
which is defined
MP-5) are selected for as P .
outstudy, which is defined as Pout.
Figure 3.
Figure 3. Distribution
Distribution of
of measurement
measurement points.
points.
Pressure transients
Pressure transients inside
inside train
train can
can be
be transformed
transformed from
from pressure
pressure transients
transients outside
outside train
train based
based
on the
on the empirical
empirical equation
equation inin reference
reference[34].
[34]. The
The equation
equationcan
can be
be written
writtenas:
as:
P −
Pout PPinin
= out
ω (2)
(2)
dP
dPin /dt
/ dt
in
where
where ω ω in
in the
the equation
equation represents
represents dynamic
dynamic seal
seal index, which is
index, which is set
set as
as 44 s,
s, 88 ss and
and 1212 ss in
in this
this paper.
paper.
PPout and P
out and Pin
represent the exterior and interior pressure transients, respectively.
in represent the exterior and interior pressure transients, respectively.
The
The ωω isisobtained
obtainedbybypressure
pressure tests. According
tests. Accordingto the Chinese
to the high-speed
Chinese high-speed traintrain
standard, the train
standard, the
internal pressure is increased to 4000 Pa (relative pressure) and naturally relieves
train internal pressure is increased to 4000 Pa (relative pressure) and naturally relieves the pressure the pressure to
1000 Pa without any other influence. The value of the period of time of the process
to 1000 Pa without any other influence. The value of the period of time of the process is defined as is defined as the
dynamic
the dynamicseal seal
index ω. Due
index to the
ω. Due tohigh running
the high speed,
running the process
speed, of high-speed
the process of high-speed trainstrains
that have
that been
have
in
been in service for several years will last about 4 s ~ 12 s. As a result, the ω is set as 4 s, 8 s ands12
service for several years will last about 4 s ~ 12 s. As a result, the ω is set as 4 s, 8 s and 12 fors
this study.
for this study.
3. Results
3. Results
3.1. Risks Analysis of Aural Discomfort
3.1. Risks Analysis of Aural Discomfort
Table 1 listed the outcomes of the analysis and Figure 4 shows the incidences of each level under
Table 1 listed the outcomes of the analysis and Figure 4 shows the incidences of each level under
certain exposures. Before presenting the results, some specifications should be made. Four denotations
certain exposures. Before presenting the results, some specifications should be made. Four
were used to represent the threshold values between the aural discomfort levels, which are T1, T2 and
denotations were used to represent the threshold values between the aural discomfort levels, which
T3, respectively. T1 was the threshold between the ideal level and the good level, T2 was that between
are T1, T2 and T3, respectively. T1 was the threshold between the ideal level and the good level, T2
the good level and the bad level, T3 was that between the bad level and the worse level. Meanwhile,
was that between the good level and the bad level, T3 was that between the bad level and the worse
T4 was used as the critical threshold between the aural comfort and the aural discomfort.
level. Meanwhile, T4 was used as the critical threshold between the aural comfort and the aural
discomfort. Table 1. Outcomes of logistic regression analysis for the three indicators.
T1
Table T2 regression analysis forT3
1. Outcomes of logistic the three indicators. T4
α β p α β p α β p α β p
T1 T2 T3 T4
I1 α 5.504 β 0.118 p 0.002α 3.092β 0.039 p 0.001
α 34.5 β 0.254 p 0.000 α4.637 β 0.056 0.000
p
I2 5.553 0.313 0.004 2.433 0.075 0.001 24.385 0.315 0.001 3.710 0.110 0.000
I1 5.504 0.118 0.002 3.092 0.039 0.001 34.5 0.254 0.000 4.637 0.056 0.000
I3 2.017 0.345 0.025 4.938 0.550 0.000 2.190 0.107 0.000 6.311 0.693 0.000
I2 5.553 0.313 0.004 2.433 0.075 0.001 24.385 0.315 0.001 3.710 0.110 0.000
I3 2.017 0.345 0.025 4.938 0.550 0.000 2.190 0.107 0.000 6.311 0.693 0.000
Int.J.J.Environ.
Int. Environ.Res.
Res.Public
PublicHealth
Health2018, 16,x1283
2019,15, 6 6ofof20
20
(a) (b)
(c)
Figure
Figure4.4.Relationship
Relationshipbetween
betweenrisks
risksofofthe
theaural
auraldiscomfort
discomfortlevel
leveland
andthe
theexposures
exposuresofofthe
theindicators.
indicators.
(a)
(a)I1;
I1;(b)
(b)I2;
I2;(c)
(c)I3.
I3.
Table 11presented
Table presentedthat thatthe
theoutcomes
outcomesof ofthe
theregression
regressionanalysis
analysisare
arestatistically
statisticallysignificant
significantbecause
because
allthe
all thep-values
p-valuesare areunder
under0.05.
0.05.Figure
Figure44revealed
revealedthe theincidences
incidencesofofthe
theonset
onsetofofone
oneaural
auraldiscomfort
discomfort
level for
level for given
given values
values of of the
the indicators.
indicators. ItItindicated
indicatedthat
thatthe
thecurves
curvesshift
shifttoto the
the right
right side
side when
when
discomfortlevel
discomfort leveldeteriorates
deterioratesfrom fromthe
theideal
idealtotothe
theworse.
worse.Also,
Also,the
thegood-bad
good-badcurve
curveisisvery
verysimilar
similarto
to
the critical curve in the three illustrations. The thresholds between two levels were
the critical curve in the three illustrations. The thresholds between two levels were confirmed when confirmed when
theincidence
the incidenceof ofeach
eachlevel
levelaccounts
accountsforforfifty
fiftypercent.
percent.As Asshown
shownin inFigure
Figure4,4,aa dotted
dotted horizontal
horizontalline
line
wasplotted
was plottedin ineach
eachillustration.
illustration. TheTheabscissa
abscissavalues
valuesofofthe
theintersection
intersectionpoints
pointsbetween
betweenthe thehorizontal
horizontal
lineand
line andthe
theS-shaped
S-shapedcurves
curveswere
werethetheexpectation
expectationvaluesvaluesof
ofthe
thethresholds.
thresholds.Table
Table22lists
liststhe
thethreshold
threshold
valuesfor
values for each
eachindicator.
indicator. ItIt should
should bebe noted
noted that
that Tc
Tc was introduced as the average of T2 and T4.
Table2.
Table Thresholdvalues
2.Threshold valuesfor
forall
allaural
auraldiscomfort
discomfortlevels.
levels.
Threshold
Threshold Values
Values
Indicators
Indicators
T1T1 T2T2 T3 T3 T4T4 TTc
c
I1: μm 46.61 78.87 139.87 82.74 80.81
I1: µm 46.61 78.87 139.87 82.74 80.81
I2:I2:μm
µm 17.76
17.76 32.31
32.31 77.51
77.51 33.63
33.63 32.97
32.97
I3:I3:μm/s
µm/s 5.84
5.84 8.98
8.98 20.45
20.45 9.10
9.10 9.04
9.04
Virtually, both T2 and T4 can represent the boundary between the aural comfort and the aural
Virtually, both T2 and T4 can represent the boundary between the aural comfort and the aural
discomfort. It is noteworthy that the values of T2 were approximately the same as those of T4.
discomfort. It is noteworthy that the values of T2 were approximately the same as those of T4.
Moreover, the relative errors between them were less than 5%. The deviation between T2 and T4 was
Moreover, the relative errors between them were less than 5%. The deviation between T2 and T4 was
attributed to the bias of sample sizes, because the coefficients of the critical curve was determined by
attributed to the bias of sample sizes, because the coefficients of the critical curve was determined
116 sample points whereas the good-bad curve was generated by 58 points. Therefore, in this study,
Int. J. Environ. Res. Public Health 2019, 16, 1283                                                            7 of 20

Int. J. Environ. Res. Public Health 2018, 15, x                                                               7 of 20
by 116 sample points whereas the good-bad curve was generated by 58 points. Therefore, in this
the average
study,         value value
        the average   of T2ofand    T4, Tc,
                                T2 and      waswas
                                        T4, Tc,    used  to to
                                                      used   discriminate
                                                               discriminatethetheaural
                                                                                   auralcomfort
                                                                                          comfort from
                                                                                                   from the    aural
                                                                                                          the aural
discomfort. To
discomfort.       sum up,
              To sum   up, the
                            the intervals
                                 intervals of
                                           of all
                                               all the
                                                   the discomfort
                                                       discomfort levels
                                                                    levels were
                                                                           were (0,(0, T1),
                                                                                       T1), (T1,
                                                                                            (T1, Tc),
                                                                                                 Tc), (Tc, T3), (T3,
                                                                                                      (Tc, T3), (T3,
>T3),  respectively. When    assessing  the aural   sensations  induced  by  the  interior  pressure
>T3), respectively. When assessing the aural sensations induced by the interior pressure changes, the  changes,  the
first step was  to obtain the  responses  of  the  three indicators  and the  next   step was  to decide
first step was to obtain the responses of the three indicators and the next step was to decide in which    in which
interval the
interval  the responses
              responses lies.
                          lies. The
                                 Theintervals
                                     intervalsforforeach
                                                     eachaural
                                                           auraldiscomfort
                                                                  discomfortlevel
                                                                               levelwere
                                                                                       weretabulated
                                                                                             tabulatedin in
                                                                                                         Table  3 as
                                                                                                            Table  3
below.
as below.

                                           Table 3.
                                           Table 3. Interval
                                                     Interval of
                                                              of each
                                                                 each discomfort
                                                                      discomfort level.
                                                                                  level.

                                                           Aural    Discomfort
                                                                Aural           Level
                                                                        Discomfort   Level
                  Indicators
                Indicators                Ideal              Good                     Bad         Worse
                                              Ideal             Good                  Bad            Worse
                      I1: μm            (0, 46.61)       (46.61, 80.81)        (80.81, 139.87)    >139.87
                  I1: I2:
                      µmμm              (0,(0, 46.61)
                                            17.76)          (46.61,
                                                           (0, 32.97)80.81)    (80.81,
                                                                                (32.97,139.87)
                                                                                         77.51)     >139.87
                                                                                                   >77.51
                  I2: µm                   (0, 17.76)         (0, 32.97)        (32.97, 77.51)       >77.51
                     I3: μm/s            (0, 5.84)          (0, 9.04)            (9.04, 20.45)     >20.45
                 I3: µm/s                   (0, 5.84)          (0, 9.04)         (9.04, 20.45)       >20.45

3.2. Pressure Distributions in Train Cabins
3.2. Pressure Distributions in Train Cabins
      The interior pressure transients of the tested cabins at three operation speed levels were
displayedinterior
      The         pressure
            in Figure 5.     transients of the tested cabins at three operation speed levels were displayed
in Figure 5.

                                  (a)                                                       (b)

                                  (c)                                                       (d)

                                                         Figure 5. Cont.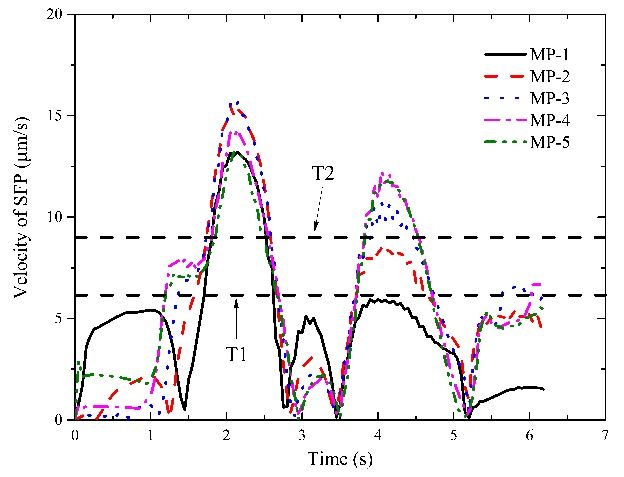
Int. J. Environ. Res. Public Health 2018, 15, x 8 of 20
Int. J. Environ. Res. Public Health 2019, 16, 1283 8 of 20
Figure 5. Cont.
(e) (f)
(g) (h)
(i)
Figure 5.
Figure 5. The
Theinterior
interiorpressure
pressurechanges
changesatatdifferent
different operation
operation speed
speed and and seal
seal indexes
indexes of train
of train body.
body. (a)
(a) at
S-4 S-4250
at 250 km/h;
km/h; (b) (b)
S-8 S-8 at 250
at 250 km/h;
km/h; (c) S-12
(c) S-12 at 250
at 250 km/h;
km/h; (d) (d)
S-4 S-4 at 300
at 300 km/h;
km/h; (e) S-8
(e) S-8 at 300
at 300 km/h;
km/h; (f)
(f) S-12
S-12 at 300
at 300 km/h,
km/h, (g)(g)
S-4S-4 at 350
at 350 km/h;
km/h; (h)(h)
S-8S-8
at at
350350 km/h;(i)(i)S-12
km/h; S-12atat350
350km/h.
km/h.
It
It should
shouldbe beexplained
explainedthatthatS-4,
S-4,S-8,
S-8,S-12
S-12denote
denote that thethe
that seal indexes
seal indexes of of
thethe
train body
train were
body 4 s, 48 s,
were s
and 12 s,12respectively.
8 s and s, respectively.As illustrated in Figure
As illustrated 5, the
in Figure 5, characteristics of the
the characteristics of pressure transients
the pressure in allinthe
transients all
tested cabins
the tested werewere
cabins consistent. The interior
consistent. pressure
The interior increases
pressure from zero
increases frominzero
the head
in thecar from
head the
car instant
from the
that the that
instant train the
enters theenters
train tunnel.the
After reaching
tunnel. Afterthe peak, it the
reaching begins to fall
peak, from positive
it begins to negative
to fall from until
positive to
the tail car
negative departs
until from
the tail carthe tunnel.
departs Bythe
from comparison,
tunnel. Byitcomparison,
is observeditthat the positive
is observed thatpeak value inpeak
the positive the
driver
value in cabin
the isdriver
largercabin
than that in thethan
is larger passenger
that incabin with respect
the passenger to the
cabin withhead car. Whereas
respect in other
to the head car.
Whereas in other tested cabins, the likelihood that the positive pressure occurs in cabins decreases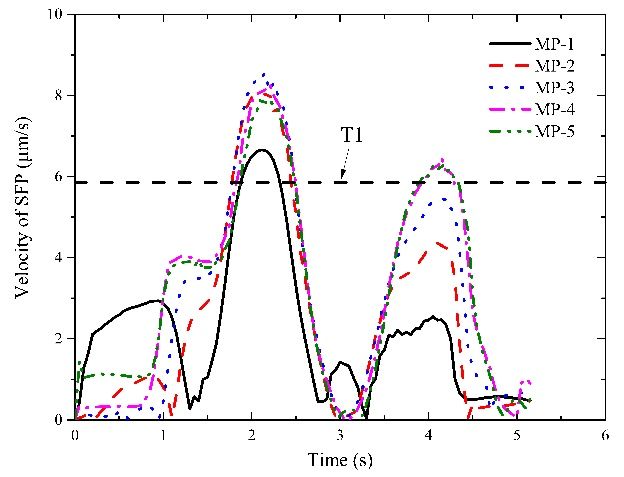
Int. J. Environ. Res. Public Health 2018, 15, x                                                               9 of 20

Int. J. Environ. Res. Public Health 2019, 16, 1283                                                            9 of 20
from the middle car to the tail car. Table 3 gives an overall comparison of the maximum pressure
differences in the cabins.
tested cabins, the likelihood that the positive pressure occurs in cabins decreases from the middle car
                          Tablean
to the tail car. Table 3 gives  4. The pressure
                                   overall      differences
                                           comparison       in different
                                                         of the maximum  cabins  (Unit: Pa).
                                                                              pressure   differences in the cabins.
     Table 4 reveals that the pressure difference increases         against
                                                            Operation    Speedthe moving direction of the train
model from the driver cabin of the 250      head  car
                                               km/h    to that  300 km/h car at a
                                                                of  the  tail          350given
                                                                                            km/h operation speed.
                 Measurement
Also, it increases   with the Point
                               lift of operation speed for all     the  tested  cabins.    However,    it decreases
                                                                Seal Index
when the seal index increases. In Discussion
                                        S-4 S-8 section,
                                                    S-12 S-4 how theS-8 pressure
                                                                          S-12 S-4 changes S-8affect
                                                                                                 S-12travelers’ and
crew members’ auralMP-1  sensations will  be presented.
                                        572   318 220       662 375 261            837 453 314
                            MP-2           779 473 339         955 569 404 1168 684               481
                             Table 4. The pressure
                            MP-3           856 531 differences
                                                        383 in   different
                                                               1092   667 cabins
                                                                             480 (Unit:
                                                                                   1290Pa).777    555
                            MP-4           894 561 406 1201 742 536 1396 868                      626
                                                                Operation Speed
                            MP-5           888 556 404 1201 745 538 1401 875                      634
                                          250 km/h                   300 km/h                    350 km/h
     Measurement Point
                                                                     Seal Index
     Table 4 reveals that the pressure difference increases against the moving direction of the train
                           S-4     S-8      S-12       S-4       S-8
model from the driver cabin    of the  head car  to that of the tail car atS-12
                                                                             a given S-4
                                                                                     operationS-8
                                                                                                 speed.S-12
                                                                                                        Also, it
          MP-1             572     318      220        662       375       261       837      453      314
increases MP-2
          with the lift of operation
                           779
                                     speed for
                                   473      339
                                                all the955
                                                        tested cabins.
                                                                 569
                                                                        However,
                                                                           404
                                                                                    it decreases
                                                                                    1168      684
                                                                                                  when 481
                                                                                                        the seal
index increases.
          MP-3   In Discussion
                           856   section,
                                   531    how
                                            383the pressure
                                                      1092    changes
                                                                 667    affect
                                                                           480 travelers’
                                                                                    1290 and777crew members’
                                                                                                       555
          MP-4
aural sensations           894     561
                  will be presented.        406       1201       742       536      1396      868      626
             MP-5                888         556     404      1201       745      538     1401     875      634

 3.3. Middle Ear Vibration under Pressure Transients
3.3. Middle Ear Vibration under Pressure Transients
      The dynamic responses of middle ear throughout the train’s passing through tunnels are
      The dynamic responses of middle ear throughout the train’s passing through tunnels are displayed
 displayed in Figures 6–8 at different operation speeds.
in Figures 6–8 at different operation speeds.

                                  (a)                                                   (b)

                                  (c)                                                   (d)

                                                       Figure 6. Cont.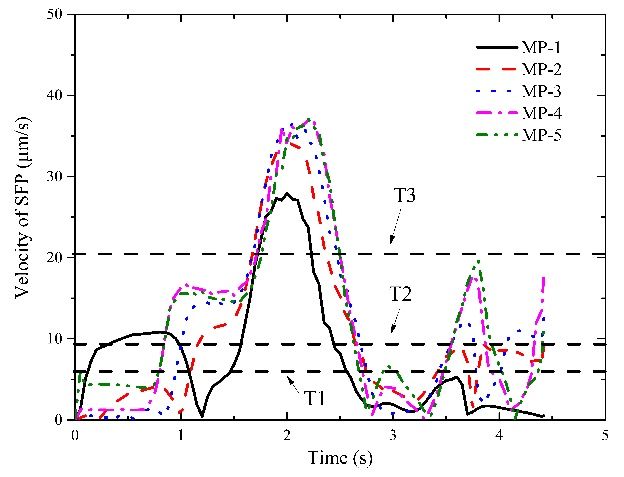
Int. J. Environ. Res. Public Health 2018, 15, x                                                                                             10 of 20

Int. J. Environ. Res. Public Health 2019, 16, 1283                                                                                           10 of 20
                                                                 Figure 6. Cont.

                                    (e)                                                                       (f)

                                    (g)                                                                       (h)

                                    (i)

       Figure6.6. Responses
      Figure        Responses of the indicators of          of interest
                                                                 interest atat 250
                                                                               250 km/h.
                                                                                    km/h.(a)  (a)responses
                                                                                                   responsesofofI1I1 under
                                                                                                                        under  a seal index
                                                                                                                                  a seal indexof
       4 s;
      of    (b)(b)responses
         4 s;       responsesofofI2I2under undera asealsealindex
                                                              indexofof44s;s;(c) (c)responses
                                                                                     responses of  of I3
                                                                                                       I3 under
                                                                                                          under aa seal index of 4 s;     s; (d)
                                                                                                                                             (d)
       responsesofofI1I1under
      responses             underaaseal sealindex
                                                indexofof8 8s;s;(e)(e)responses
                                                                        responses ofof
                                                                                     I2 I2 under
                                                                                         under      a seal
                                                                                                a seal      index
                                                                                                         index   of of
                                                                                                                    8 s;8 (f)
                                                                                                                           s; (f) responses
                                                                                                                              responses       of
                                                                                                                                          of I3
       I3 under
      under        a seal
              a seal  index index
                                of 8ofs; 8(g)
                                            s; responses
                                               (g) responses of I1ofunder
                                                                        I1 under   a seal
                                                                              a seal  indexindex
                                                                                             of 12ofs;12(h)s;responses
                                                                                                              (h) responsesof I2 of I2 under
                                                                                                                                  under  a seala
      index   of 12 of
       seal index    s; (i)
                        12 responses        of I3 under
                             s; (i) responses               a sealaindex
                                                   of I3 under                of 12 of
                                                                        seal index   s. 12 s.
Int. J. Environ. Res. Public Health 2019, 16, 1283 11 of 20
Int. J. Environ. Res. Public Health 2018, 15, x 11 of 20
(a) (b)
(c) (d)
(e) (f)
(g) (h)
Figure 7. Cont.Int. J. Environ. Res. Public Health 2018, 15, x 12 of 20
Figure 7. Cont.
Int. J. Environ. Res. Public Health 2018, 15, x 12 of 20
Int. J. Environ. Res. Public Health 2019, 16, 1283 12 of 20
Figure 7. Cont.
(i)
(i)
Figure 7. Responses of the indicators of interest at 300 km/h. (a) responses of I1 under a seal index of
FigureFigure
4 s; (b) 7. Responses
7.responses
Responses I2 of
of of the
under
the indicators of interest
a seal index
indicators of interest
of 4 atat
s;300
300km/h.
(c) (a) responses
responses
km/h. of I1 under
(a)ofresponses
I3 under a I1
of seal a seal
index
under index
of 4ofindex
a seal s; (d)
4 s;
responses (b) responses of
of I1 underofa I2 I2 under
seal a seal
indexa of index
8 s;index of 4 s;
(e) responses (c) responses of I3 under a seal index of 4 s; (d)
of 4 s; (b) responses under seal of 4 s; (c)ofresponses
I2 under of a seal index aofseal
I3 under 8 s; index
(f) responses of
of 4 s; (d)
responses of I1 under a seal index of 8 s; (e) responses of I2 under a seal index of 8 s; (f) responses of
responses of I1 under a seal index of 8 s; (e) responses of I2 under a seal index of 8 s; (f) responses of I3a
I3 under a seal index of 8 s; (g) responses of I1 under a seal index of 12 s; (h) responses of I2 under
I3 under a seal index of 8 s; (g) responses of I1 under a seal index of 12 s; (h) responses of I2 under a
seal index
under a seal ofindex
12 s; (i)
of responses of I3 under
8 s; (g) responses of I1aunder
seal index
a sealofindex
12 s. of 12 s; (h) responses of I2 under a seal
seal index of 12 s; (i) responses of I3 under a seal index of 12 s.
index of 12 s; (i) responses of I3 under a seal index of 12 s.
(a) (b)
(a) (b)
(c) (d)
(c) (d)
Figure 8. Cont.Int. J. Environ. Res. Public Health 2018, 15, x 13 of 20
Int. J. Environ. Res. Public Health 2019, 16, 1283 13 of 20
Figure 8. Cont.
(e) (f)
(g) (h)
(i)
Figure 8.
Figure 8. Responses
Responses of of the
the indicators
indicators of
ofinterest
interestat at350
350km/h.
km/h.(a)(a)responses
responses ofof
I1 I1
under
under a seal index
a seal indexof
4 s; (b) responses of I2 under a seal index of 4 s; (c) responses of I3 under
of 4 s; (b) responses of I2 under a seal index of 4 s; (c) responses of I3 under a seal index of 4 a seal index of 4 s; (d)
responses of
responses ofI1I1under
underaaseal sealindex
indexofof88s;s;(e)
(e)responses
responsesofofI2I2under
under a seal
a seal index
index of of
8 s;8 (f)
s; (f) responses
responses of
of I3
I3 under
under a seal
a seal indexindexof 8ofs;8(g)
s; (g) responses
responses of I1ofunder
I1 under a seal
a seal index
index of 12ofs;12
(h)s;responses
(h) responses of I2of I2 under
under a seala
seal index
index of 12ofs; 12
(i) s; (i) responses
responses of I3 of I3 under
under a seala index
seal index
of 12of
s. 12 s.
It deserves
deserves attention that the horizontal
horizontal dashed lines were plotted plotted inin some
some illustrations
illustrations for
reference
reference purposes
purposestotojudge
judgewhich
which levels thethe
levels interior pressure
interior transient
pressure maymay
transient affect. In detail,
affect. if no lines
In detail, if no
are plotted,
lines it indicates
are plotted, the aural
it indicates the feelings stay within
aural feelings the ideal
stay within thelevel;
idealiflevel;
one orif more
one or lines arelines
more plotted,
are
they are the threshold values of the ideal level, the good level and the bad level from
plotted, they are the threshold values of the ideal level, the good level and the bad level from the the bottom to
the top, to
bottom respectively. It also implies
the top, respectively. theimplies
It also aural feelings
the auraltransform into the good
feelings transform into level fromlevel
the good the ideal
fromInt. J. Environ. Res. Public Health 2019, 16, 1283 14 of 20
level and remain within good level till the train departs. If only one reference line is plotted, it implies
that the aural sensations stay in the good level when the response curves overpass the line or T1 line.
Likewise, if two or three reference lines are plotted, it means the aural sensations of the bad level even
the worse level are perceived.
With respect to I1 and I2, their response curves of MP-1 point and MP-2 point ascend at the
beginning, fall to zero after reaching the peaks and ensue constantly increase till the tail car leaves
the tunnel. Whereas for other measurement points, the curves increase continuously until the train
approaches the tunnel exit. The reason for the difference between them is that the two points experience
a significant phase of positive pressure initially and a relatively long phase of negative pressure. Thus,
the TM moves inward first and slowly recovers to the undisturbed state with the decrease of the
positive pressure. When the negative pressure appears in both points, the TM begins to deform
outward till the end. The movement of TM will certainly involve the SFP to move similarly.
With respect to I3, the curves of MP-1 point and MP-2 point are also different from those of
others. For both points, their curves begin with a sharp increase first and stabilize for less than 1 s,
then fall steeply nearly to zero. During the remained time, the curves experience two or three peaks
and decrease after the last peak till the train leaves the tunnel. While for other points, two increase
phases and a stable phase are displayed before the first peaks appear. During the following time,
the curves of all the measurement points exhibit consistency. As are displayed in Figures 6–8, the aural
discomfort sensations mainly outburst when the train is running approximately in the middle of the
tunnel. Furthermore, high seal index or degraded operation speed is beneficial to reduce the likelihood
of the onset of the aural discomfort. In Section 4, how these factors influence humans’ aural feelings
will be discussed in detail.
4. Discussion
In this section, three factors which respectively are the operation speed of the train, seal index
and positions of measurement points were considered. Furthermore, their effects on the onset of aural
discomfort were investigated using the control variable method. For example, I2 and I3 were regarded
as invariables when the effect of I1 was to be investigated.
Here, some explanations should be elucidated with respect to how the three indicators
mentioned above correlate with the aural discomfort sensations. As high pressure amplitude causes
large deformation of the TM, a variety of barotraumas may occur such as ear pain, bleeding or
perforation [6,35–37]. Armstrong and Heim found that the TM bulges and sensation of aural fulness
and pains occurs when the negative pressure in the external ear canal reaches 1.6 kPa. Moreover,
tinnitus starts, usually accompanied by vertigo with benign nausea, if the negative pressure continues
decreasing [38]. Hence, it is sufficient to believe that large displacement value of TM or I1 is doomed
to incur such aural complaints as otalgia, fulness and even bleed or rupture. The SFP is connected to
the oval window of the inner ear which is composed of vestibular semi-duct and cochlea, the vibration
input from the oscillation of the TM is transmitted to the inner ear and in turn elicits movement of
both vestibular semi-duct and cochlea. If the SFP vibrates with a high magnitude, the semi-duct will
be affected which may induce vertigo or vomit sensations [22]. On the other hand, the vibration of the
SFP excites the oval window to vibrate and in turn the flow of perilymph in the scala tympani [23].
The key process for triggering bioelectrical signal to the brain is to excite the flow of fluid between
scala tympani and scala media under the pressure gradient [24]. As the impedance is the pressure at
per unit areas and per unit velocity, a pressure gradient can be produced by the effect of the velocity
of the SFP. Driven by the pressure gradient, the hair bundles on the basilar membrane vibrate and
thereby bioelectrical was generated and transferred to the brain. It is obvious that the velocity of the
SFP or I3 is a key factor to judge the sensations of inner ear. It is widely recognized that noise exposure
potentially results in tinnitus symptoms for those involved with loud sound environments [39–41].
As was reported by Aibara et al., the velocity of the SFP reaches more than 10 µm/s at a sound stimulus
of 90–120 dB which is sufficient to elicit slight tinnitus [12]. It therefore implies that the real value thatInt. J. Environ. Res. Public Health 2019, 16, 1283 15 of 20
Int. J. Environ. Res. Public Health 2018, 15, x 15 of 20
triggers the
indicated in onset
Table of
2, tinnitus is virtually
the simulated lowervalues
threshold than 10
of µm/s. Asμm/s.
I3 is 9.04 is indicated in Table
Therefore, large2,velocity
the simulated
of the
threshold values of I3 is 9.04 µm/s. Therefore, large velocity
SFP is interpreted to cause ear complaints like tinnitus and hearing loss. of the SFP is interpreted to cause ear
complaints like tinnitus
In the following and hearing
sections, loss.of operation speed, seal index and car number on the three
the effects
In the following sections, the effects
indicators will be discussed separately. Furthermore, of operation speed, sealanalysis
statistical index and car numbertoonfigure
is completed the three
out
indicators will be discussed separately. Furthermore, statistical analysis is completed
the duration time of each level for each condition according to the results as were shown in Figures to figure out the
duration
6–8. Thentime of each
the effect level for each
is quantified condition according
by calculating to thethat
the percentage results
eachaslevel
wereaccounts
shown in forFigures
relative6–8.
to
Then the effect is quantified by calculating the percentage that each level accounts
the total time. This helps us interpret how and what kinds of the aural discomfort sensations emerge for relative to the
total time.
under This helps
the interior us interpret
pressure changes.how and what kinds of the aural discomfort sensations emerge
under the interior pressure changes.
4.1. Effect of Operation Speed on Aural Discomfort
4.1. Effect of Operation Speed on Aural Discomfort
To investigate the effect of the operation speed, the other two factors are treated as invariables.
Thus,To investigate
the total timethe of effect
every of the operation
discomfort levelspeed,
at eachthe other two
operation factors
speed are treatedby
is calculated as invariables.
adding the
Thus, the total time of every discomfort level at each operation speed is calculated by adding
duration time of each measurement point under different seal indexes. Figure 9 displays the
the duration time
characteristics of theofaural
each discomfort
measurement point under
at different different seal indexes. Figure 9 displays the
speeds.
characteristics of the aural discomfort at different speeds.
(a) (b)
(c)
Figure
Figure 9.
9. The
The relationship
relationship between
between operation
operation speed
speed and
and aural
aural discomfort;
discomfort; (a)
(a) I1;
I1; (b)
(b) I2;
I2; (c)
(c) I3.
I3.
Figure
Figure 99 clearly
clearly indicates
indicates that
that the
the percentages
percentages of
of the
the ideal
ideal level of the indicators descend
descend while
while
that
that of
of bad
bad level
level increases
increases with
with the
the increase
increase of
of operation
operation speed.
speed. With
With respect
respect to
to that
that of
of the
thegood
goodlevel,
level,
I1
I1 and
and I2
I2increases
increases slightly
slightly while
while I3I3goes
goesupupfirst
firstand
andthen
thendrops
dropswhen
whenthetheoperation
operationspeed
speedaccelerates.
accelerates.
The
The percentages
percentages of of I1
I1 and
and I2 at the worse level stabilize
stabilize at zero level with the increasing operation
operation
speed, while
speed, while the proportion of I3 at the worse level climbs from zero at 250 km/h to 5% at 350 km/h.
km/h to 5% at 350 km/h.
The results reveal that the duration of aural comfort of ideal level reduces when the operation
speed of train accelerates. Because the duration of aural discomfort can be calculated by adding the
percentage of the bad level and that of the worse level, the likelihood of aural discomfort at 350 km/hInt. J. Environ. Res. Public Health 2019, 16, 1283 16 of 20
Int. J. Environ. Res. Public Health 2018, 15, x 16 of 20
The results reveal that the duration of aural comfort of ideal level reduces when the operation
speed of train
increases moreaccelerates.
than two times Because
thanthethatduration of aural
at 250 km/h for discomfort can be calculated
the three indicators. With respect by adding
to the
the percentage of
manifestations of aural
the bad level and
discomfort that of the
sensations, theworse level,ofthe
incidence likelihood
episodes of theofaural
auralfulness,
discomfort at
otalgia
350 km/h increases more than two times than that at 250 km/h for the three
and vertigo increase by two or three times when the operation speed lifts from 250 km/h to 350 km/h. indicators. With respect
to the manifestations
Besides, it is four times of more
aural likely
discomfort sensations,
to induce the onset theofincidence
tinnitus andof episodes
temporalofhearing
the aural lossfulness,
at 350
otalgia and vertigo
km/h compared withincrease
250 km/h.by two or three times when the operation speed lifts from 250 km/h to
350 km/h.
Sanok Besides, it is four
et al. revealed thattimes moresevere
the more likely the
to induce
pressure thefluctuations
onset of tinnitus
the moreand likely
temporal hearing
the increase
loss at 350
in the level km/hof thecompared with 250 km/h.
aural discomfort perceived by subjects in pressure chamber tests [42]. As is
indicated in Figure 5, higher operationsevere
Sanok et al. revealed that the more speedthe pressure
gives rise tofluctuations
more severe thepressure
more likely the increase
fluctuations. It in
is
the level of the aural discomfort perceived by subjects in pressure chamber
therefore more likely to induce exacerbating aural discomfort. Sato et al. disclosed that aural tests [42]. As is indicated
in Figure 5, higher
discomfort operation
is associated withspeed gives riseand
amplitudes to more severeofpressure
gradients pressure fluctuations.
transients It andis therefore
risks of moreaural
likely to induce exacerbating aural discomfort. Sato et al. disclosed that aural
discomfort become higher if speed elevated [43]. As was illustrated in Figure 5, higher speed results discomfort is associated
with amplitudes
in higher amplitudes and ofgradients
negativeofpressure
pressureintransients
cabins. Thus,and itrisks of aural
implies that discomfort become higher
lifting the operation speed
if
ofspeed
a trainelevated
in the tunnel[43]. As was illustrated
is much more likelyintoFigure
cause 5, higher speed
symptoms results
of aural in higher
discomfort amplitudes
like tinnitus and of
negative pressure
hearing loss. in cabins. Thus, it implies that lifting the operation speed of a train in the tunnel is
much more likely to cause symptoms of aural discomfort like tinnitus and hearing loss.
4.2. Effect of Seal Index on Aural Discomfort
4.2. Effect of Seal Index on Aural Discomfort
By using the control variable method, the effect of seal index on the aural discomfort was
By using
analyzed the control
as shown variable
in Figure 10. method, the effect of seal index on the aural discomfort was analyzed
as shown in Figure 10.
(a) (b)
(c)
Figure 10.
Figure 10. The
The relationship
relationship between
between seal
seal index
index and
and aural
aural discomfort.
discomfort. (a)
(a) I1;
I1; (b)
(b) I2;
I2; (c)
(c) I3.
I3.
As is illustrated in Figure 10, the percentage of the ideal level of the indicators increases
significantly when the seal index increases, whereas that of the other levels decreases more or less. It
can be found that the proportion of the ideal level accounts for nearly more than 90% when the seal
index is 12 s. That is, the duration of aural discomfort at the ideal level lasts longer when the sealInt. J. Environ. Res. Public Health 2019, 16, 1283 17 of 20
As is illustrated in Figure 10, the percentage of the ideal level of the indicators increases
Int. J. Environ. Res. Public Health 2018, 15, x 17 of 20
significantly when the seal index increases, whereas that of the other levels decreases more or less.
It can be found that the proportion of the ideal level accounts for nearly more than 90% when the seal
index becomes larger. The probability of ear annoyance like otalgia or vertigo falls to zero once the
index is 12 s. That is, the duration of aural discomfort at the ideal level lasts longer when the seal index
coefficient reaches 8 s. Moreover, the likelihood of the onset of tinnitus also reduces to a very low
becomes larger. The probability of ear annoyance like otalgia or vertigo falls to zero once the coefficient
level but not zero with a coefficient of 12 s. Adding the percentages of the bad level and the worse
reaches 8 s. Moreover, the likelihood of the onset of tinnitus also reduces to a very low level but not
level, it indicates that the duration of aural discomfort like fulness and otalgia falls from 13.7% to zero
zero with a coefficient of 12 s. Adding the percentages of the bad level and the worse level, it indicates
and the duration of vertigo dropped from 12.8% to zero when the seal index varies from 4 s to 12 s.
that the duration of aural discomfort like fulness and otalgia falls from 13.7% to zero and the duration
For the duration of tinnitus or hearing loss, it reduced significantly from 31.9% to 3% as the seal index
of vertigo dropped from 12.8% to zero when the seal index varies from 4 s to 12 s. For the duration of
increases from 4 s to 12 s. Generally, the aural comfort sensations tend to sustain longer when the seal
tinnitus or hearing loss, it reduced significantly from 31.9% to 3% as the seal index increases from 4 s to
index rises. Figure 5 displays that increasing the seal index of the train body leads to descending
12 s. Generally, the aural comfort sensations tend to sustain longer when the seal index rises. Figure 5
pressure amplitudes and thereby yielded improved aural sensations [44,45]. Thus, it is transparent
displays that increasing the seal index of the train body leads to descending pressure amplitudes and
that increasing the seal index of the train body is beneficial to improve passengers’ and crew
thereby yielded improved aural sensations [44,45]. Thus, it is transparent that increasing the seal index
members’ aural experiences.
of the train body is beneficial to improve passengers’ and crew members’ aural experiences.
4.3. Effect of Car Number on Aural Discomfort
4.3. Effect of Car Number on Aural Discomfort
To compare the aural feelings of passengers and crew members in different cabins, Figure 11
To compare the aural feelings of passengers and crew members in different cabins, Figure 11 was
was generated to illustrate the differences in aural sensations against the running direction of the train.
generated to illustrate the differences in aural sensations against the running direction of the train.
(a) (b)
(c)
Figure11.
Figure 11.The
Therelationship
relationshipbetween
betweencar
carnumber
numberand
andaural
auraldiscomfort.
discomfort.(a)
(a)I1;I1;(b)
(b)I2;I2;(c)(c)I3.I3.
InInFigure
Figure11,11,there
thereare
arefive
fivepoints
pointsplotted
plottedinineach
eachcurve
curvewhich
whichcorrespond
correspondwith
withthe
thefive
five
measurementpoints.
measurement points. They are thethe driver
drivercabin
cabinofofthe
thehead
headcar,
car,the passenger
the cabin
passenger of of
cabin thethe
head
headcar,
thethe
car, cabin of of
cabin thethe
middle
middle car,
car,the
thepassenger
passengercabin
cabinofofthe
the tail
tail car
car and driver cabin
cabin of
of the
thetail
tailcar
car
respectively from the left side to right side. The results show that the duration of the aural comfort at
the ideal level goes down while the lasting time at the good and the bad levels rises from driver cabin
of head car to that of tail car. Besides, the time at the worse level for I3 in Figure 11c increases slightly
but no significant changes are observed in Figure 11a and Figure 11b. As a whole, the duration of theYou can also read