Rio de Janeiro The case of
←
→
Page content transcription
If your browser does not render page correctly, please read the page content below
The case of
Rio de Janeiro
by Helia Nacif Xavier

                                                                                                                    Source: CIA factbook
   Fernanda Magalhães

Helia Nacif Xavier
Fernanda Magalhães

I. INTRODUCTION: THE CITY

A.     URBAN CONTEXT
1. National Overview

   1.1 National Urban Context
   The urbanisation process in Brazil took on an              the decrease in migration to cities. According to the lat-
increased dynamism at the end of the 19th century, with       est census data, of a total of 174,449,875 inhabitants,
cities acquiring increasing importance in the territorial     approximately 82 per cent live in cities.
organisation of the country. The industrialisation               The territorial area of Brazil is 8,514,215.3 square
process originated in the first half of the 20th century      kilometres, divided into five large regions – North,
and has always been strongly tied to urbanisation, with       Northeast, Central-East, South and Southeast, with a
a direct influence on the structure and evolution of the      total of 27 states and 5,551 municipalities (IBGE,
urban network. This network is presently formed by            Census 2000).
regional systems located mainly along the coast, with            Although the small municipalities with urban popula-
particular importance in the southern and south-eastern       tions under 20,000 inhabitants represent 75 per cent of
regions, with the cities of Rio de Janeiro, São Paulo and     the total, they concentrate only 19.5 per cent of the
Belo Horizonte. This region attracted important infra-        country’s population. This means that around 80 per
structure development – railways, the best ports, com-        cent of the population lives in 25 per cent of the munic-
munication networks – as well as economic importance          ipalities, revealing the existence of a strong spatial con-
- international commercial plants, capitalist forms of pro-   centration in the country.
duction, work and consumption.                                   The last census (IBGE, 2000) shows another impor-
   The concentration of efforts and investments to sup-       tant aspect, namely that the core cities of the metropol-
port industrialisation in the main urban centres, particu-    itan regions had not only suffered a population growth
larly in Rio de Janeiro and São Paulo, during the             rate decrease, but also no longer continue to attract
process of economic development, led to an intense            migrants. This attraction is now to cities in the metropol-
migration process. This process reached its apex in the       itan periphery and medium sized cities.
main urban centres in the early 1980s with a combina-
tion of a decrease in birth rates and the reduction of        1.2 Social Inequality
rural-urban migration.                                           Social inequality is significant in Brazil, and it is par-
   The country now has high urbanisation rates, despite       ticularly concentrated in the metropolitan regions, which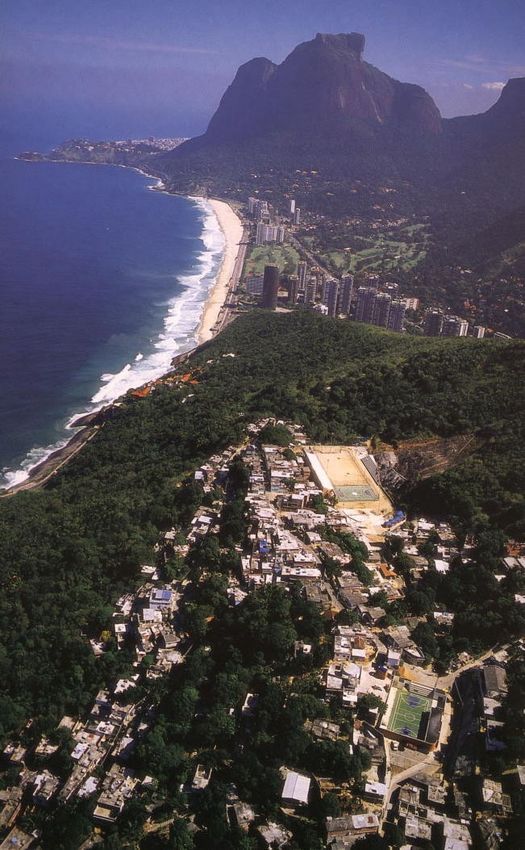
Urban Slums Reports: The case of Rio de Janeiro, Brazil

also concentrate the highest rates of informal activity              Changes to the international productive structure have
coupled with a lack of infrastructure and services.                also caused a significant impact on the pattern of spatial
    This is particularly due to the fast urbanisation              location of industries and their complementary activities.
process that was never followed by public policies on              At a national level there is a locational trend strongly dic-
housing, sanitation, education and health. But it also             tated by the international economy with a concentration
results from the high levels of social inequality that char-       of services in the metropolitan regions, and some spread
acterise the development of the country.                           to medium sized cities or regions. Metropolitan regions
  Access to housing has improved slightly recently, yet            have acquired a new role attracting transnational pro-
the amount of inadequate housing in slums, risk areas              ductive units or service companies. At a local level new
or environmentally fragile sites is still particularly high in     uses have been emerging in cities to enable them to
the metropolitan regions. The housing deficit remains              compete globally, requiring major investments in com-
high in the country, especially in the lower income                munication infrastructure (IBGE, Atlas Nacional, 2000).
groups. In 1998 there were 1.3 million permanent
dwellings in slums with 79.8 per cent located in the met-          2. The History of Rio de Janeiro
ropolitan region (Governo Federal, SEDU, 2000).                       Founded by the Portuguese in 1565 at the entrance of
                                                                   Guanabara Bay, between the Sugarloaf and Cara de
1.3 Industrialisation and Urbanisation                             Cão Mountains, the city of São Sebastião do Rio de
   The strong relation between urbanisation and indus-             Janeiro was moved two years later to the square bor-
trialisation characterises the territorial, demographic            dered by Castelo, Santo António, São Bento and
and economic dynamics of the country. Financial invest-            Conceição hills. This was a better location for the
ment, particularly from the 1950s onwards, has been                defence of the city from the attacks of Indians and
mainly aimed at the country’s modernisation, with                  pirates from the sea and the flat lands.
urbanisation playing a strategic role.                                At the end of the 16th century the hilly areas were
   From an agricultural economy the country has                    already densely populated, and the swampy areas
changed to an industrialised and urbanised society in              around the hills were drained and filled and began to be
thirty years. During the 1970s, the most important peri-           occupied. During the next two centuries sugarcane pro-
od of this process, the country grew at an average                 duction was the most important economic activity on the
annual rate of 8.6 per cent. In the same period the annu-          periphery of the city, on land ceded by the Portuguese
al industrial average production was 9 per cent and the            Crown. The spatial structure of the city and the areas of
urban population increased from 44 to over 55 per cent.            expansion in the following centuries was largely deter-
   The new world economic dynamism, emerging from                  mined by the sugarcane industry.
the mid-1990s, had an impact on the country’s industri-               During the 18th century port activity increased signifi-
al structure. This has been reflected in its spatial organ-        cantly due to the export of gold and gems from the
isation and the market relations with innovations that             neighbouring inland state of Minas Gerais. At the end of
came with globalisation. These changes to the produc-              the 18th century all the lower lands around the hills were
tive structure were followed by the country’s free trade           completely occupied by the city.
policy, and ended with the consolidation of monetary                  In 1763, with the transfer of the capital from Salvador
stabilisation and the adoption of a new free exchange              to Rio de Janeiro, the city raised its political status,
currency policy.                                                   receiving infrastructure, drainage, water supply and aes-
   Economic growth patterns during the 1990s were                  thetic works to accommodate increasing urban growth.
characterised by two sub-periods. Between 1990 and                    The royal family moved to the city in 1808 and the
1993 the economy was in recession with average annu-               town became the capital of the United Kingdom of
al growth reaching only 1.2 per cent. Between 1993 and             Portugal, Brazil and Algarve. Along with the court over
1997 average growth was higher reaching 1.7 per cent               15 thousand people moved to Rio, an increase of 25 per
a year while for industry it was 3.8 per cent (IPEA,               cent for the total population of the city of 50 thousand
2001).                                                             inhabitants, 50 per cent of whom were slaves. This sud-
   The country’s industrial profile has also changed as            den growth forced a rapid construction of houses to
part of this globalisation process. The third sector has           accommodate the Portuguese nobility, and the higher
reached surprising levels. Internally since 1994 there             income population living in the city had to give up their
has been a reduction in the financial sector and an                houses to the newcomers. Between 1808 and 1816
increase in other services, especially those linked to             around 600 terraced houses were built in the periphery
infrastructure and communication. Communication,                   of the city centre, an area previously dominated by rural
which in the 1980s grew by two and a half times, grew              properties and manor houses. The segregated pattern
by 120 per cent in the first six years of the 1990s. Other         that nowadays remains in the city started to take shape
sectors, like tourism and leisure, have also grown                 at that time, with the rich living separately from the poor,
notably, especially due to an increase of exchange and             yet all in the same central area of the city. In the periph-
flows at national level.
                                                                                                                                   2
U N D E R S TA N D I N G S L U M S : C a s e St u d i e s f o r t h e G l o b a l R e p o r t o n H u m a n S e t t l e m e n t s 2 0 0 3

    ery were farms and manor houses and closer in were                      demolitions (Providência, Santo António, São Carlos
    second homes without an economic role.                                  and Pinto), while some of the poor were pushed to the
       Given its new status of Capital of the Portuguese                    suburbs and the periphery, increasing the demand for
    Kingdom the city received many economic and urban                       social housing. The port was modernised and enlarged.
    improvements. The opening of the port changed the city                  Industries were transferred from the south and central
    into an important node on international maritime routes.                zones to the suburbs and metropolitan municipalities.
    Libraries, theatres and schools sprang up, as well as                      The city in the late 1920s housed around 2 million
    private homes and business establishments.                              people. The first urban plan, Plan Agache, was devel-
       Independence in 1822 and the wealth created by cof-                  oped at this time. This plan proposed the organisation of
    fee brought new improvements to the empire’s capital,                   the city following a segregated functionalist principle,
    and with the construction of the railway connecting the                 reserving the boroughs of Ipanema, Leblon and Gavea
    inland agricultural production areas in the Southeast                   (in the south) for the upper classes, while the suburbs
    Region with the newly built port, population growth                     were left for the working classes. This is the first official
    became rampant. The city expanded and improved with                     document to deal with the problems of favelas, suggest-
    a number of public works and services – paving, light-                  ing their eradication.
    ing, sanitation, garbage collection and water supply.                      The initial impulse given by industrialisation attracted
       A public transport system established in the mid-19th                new migrant populations to the city. The number of
    century allowed the city to expand to new areas like                    inhabitants duplicated in ten years reaching 2,380,000
    Tijuca and São Cristovão in the north and Botafogo and                  in 1930. From the 1930s onwards the industries move
    Laranjeiras in the south. The trams and the trains made                 away to the suburbs. Rio experienced significant indus-
    it possible for people to move from the city centre, initi-             trial growth after the Second World War and up to the
    ating a segregated pattern that was intensified in the                  1960s. Daily movements from home to work between
    following century and still remains today. The trams                    the centre and the periphery steadily increased and
    allowed the rich to move to the south close to the coast,               transport problems became frequent. The electrification
    whereas the train penetrating inland to the suburbs                     of the railway system from 1937 onwards, and the open-
    pushed the working and lower income groups from the                     ing of Avenida Brazil (1964), connecting the centre
    city centre to the north.                                               directly with the suburbs, contributed to suburban
       The abolition of the slavery in 1888 emptied the cof-                sprawl. In the 1950s the suburbs were so crowded that
    fee plantations, bringing migrants to the city. Social dif-             the only areas still to be occupied were those which
    ferences became more acute and the first favelas                        were environmentally fragile – swamps, steep hills,
    (slums) appeared. The term “favelas” has its origin in                  mangroves and riverbanks.
    the first low-income settlement that was located in the                    Growth of the favelas continued and in 1948 the cen-
    city centre of Rio (Morro da Povidência) at the turn of                 sus registered 139 thousand people living in 105 fave-
    the century, and named “Morro da Favela” housing ex-                    las spread across the city. Urban problems in the met-
    soldiers that had fought in a rebellion (Revolta dos                    ropolitan area also became more acute – cars packed
    Canudos) and ex-slaves unable to integrate into the                     the streets, land prices increased rampantly and the city
    new economy.                                                            grew vertically. Migration reached its highest rate in the
       Rio became the capital of the country with the                       20th century with 38 per cent of inhabitants originating
    Proclamation of the Republic in 1889, and the political                 from outside the city.
    elite and bourgeoisie were ousted. In the city centre vil-                 Lack of housing and mass transport to attend to this
    las and mansions became schools or housing for poor                     growth forced the spread of favelas, and environmental-
    people. It was a place of narrow streets and alleys, low                ly fragile areas in the city were occupied. Despite some
    houses, deep plots, insalubrious tenements with                         effort by the state to build some social housing in the
    unhealthy conditions and prone to epidemics. The con-                   north and the suburbs, the number of units was very
    ditions called for a radical renewal of the city. Adopting              small compared to demand.
    a “Haussmanian” approach, Pereira Passos, mayor of                         During the 1960s the city faced increasing difficulties
    the city (1902-1906) decided to demolish large areas to                 with traffic and pollution. Population increased from
    give space to wide green avenues - a design inspired                    3,281,00 in 1960 to 4,261,918 in 1970, a growth of 30
    by the Parisian boulevards - and modern new buildings.                  per cent. In the same period the population living in
    New areas were developed, the city was modernised                       favelas was over 500,000, or 13 per cent of the total
    and embellished to support the new industrial economy.                  population of the city, spread over 162 officially-recog-
    Rio expanded in all directions and its face changed rad-                nised settlements. Industrial growth in the city
    ically, especially the city centre that suffered a strong               decreased in this decade, and the maritime port lost
    negative social impact with these interventions. Some                   importance. The capital was transferred to Brasília and
    of the existing hills in the city centre, where the town                the city also lost political importance.
    was founded, were cleared, and other hills were occu-                       The development of a new urban plan by the Greek
    pied by slums housing people left homeless by the                       architect Constantin Dioxiadis redirected the focus to
3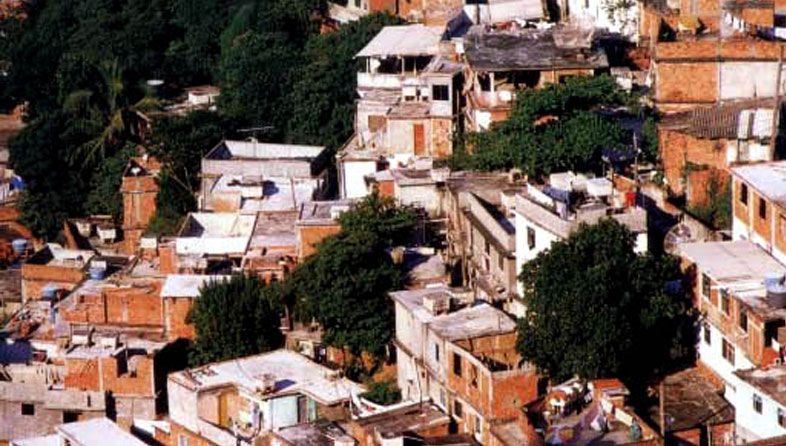
Urban Slums Reports: The case of Rio de Janeiro, Brazil

the metropolitan region, proposing the displacement of             great variety form beautiful scenery, and the powerful
work activities in the region and the construction of              presence of rock is felt all around. Rio is at sea level
major access roads connecting it with the city. The                (the average altitude is two metres) and is dominated by
implementation of these proposals would push away the              three larger ranges – Tijuca, Pedra Branca and Gericinó
poor once again, since they required the demolition of             (PCRJ, 1998).
large built areas. Fortunately the proposals were not                  Rio has hundreds of rivers, canals, lagoons and
carried out immediately, avoiding a worsening of the               marshes. It manages, within its urban area alone, water
housing conditions.                                                resources that include 217 rivers and canals totalling
   The development of the Pub-Rio (another plan for the            639 kilometres and four lagoons, Jacarepagua,
city) in the 1970s, reinforced the need to relocate indus-         Camorim, Marapendi and Rodrigo de Freitas, that total
tries in the metropolitan region, proposing the develop-           15.2 km2. Rio has at its heart the Floresta da Tijuca, the
ment of an industrial district close to the neighbouring           largest urban forest in the world (PCRJ, 1998).
municipalities of Duque de Caxias and Nova Iguaçu. It
was during this decade that the eastern areas of the city          4. Demographics
at Barra da Tijuca and Jacarepagua were occupied by                    The preliminary results of the Census 2000 record a
middle and high income groups, whereas large ex-rural              total population in the city of 5,857,904 inhabitants, with
areas of Bangu, Santa Cruz and Campo Grande were                   2,748,143 men and 3,109,761 women, and a population
subdivided into plots, mostly illegally, lacking infrastruc-       density of 4,640.17 inhabitants/km² (IBGE, Censo,
ture and services, to house the poor population unable             2000).
to acquire housing in the formal market.                               Although this data is still under critical evaluation, its
   During the 1990s, urban growth in the city was con-             confirmation will demonstrate, as with the Census of
trolled by the Municipal Decenal Master Plan (Plano                1991, that the population growth rate in the last decade
Diretor Decenal do Município do Rio de Janeiro). This              was on the decrease, compared with the previous
plan – far and away the most participatory plan to be              decade.
developed - established the main rules, instruments and                Figure 2 shows the variation in growth rate over the
concepts to guide the city’s urban development, facing             last sixty years. It shows that in the first three decades
the problem of the slums that in the previous decades              it reached a rate of 3 per cent, a consequence of migra-
had increased significantly, as well as the socio-spatial          tion movements and high fertility rates.
segregation pattern.                                                   From the mid 1960s there was a gradual decrease in
   Despite the development of a new municipal housing              the growth rate. The transfer of the capital from Rio to
policy following the Plan in the 1990s, the magnitude              Brasilia might explain this. Despite that, the city contin-
and complexity of the problems to be faced increased.              ued to attract migrants from other parts of the country
Economically the city of Rio, jointly with São Paulo,              and remained an important cultural and service centre.
formed a development axis that positioned them in the                  In the mid-1990s the city began to regain economic
rank of the global cities. The service sec-                                              importance. This had a big impact
tor has grown enormously, followed by            Table 1. Rio de Janeiro Land Use        on its demographic patterns, and it
the tourism and information technology                    (%) by Area In 1996            experienced a high rate of average
industry.                                                                                annual economic growth, reaching
                                                  URBANISED AREA               46.30     0.26 per cent in the first half of the
                                                                                         decade. This demonstrates that the
                                                  PREDOMINANTLY
3. The Physical City                              RESIDENTIAL
                                                                               32.05     city managed to maintain some sta-
   The city occupies 1,255 km2 (Anuario           SERVICE & COM-                         bilisation within its population
                                                                                2.33
Estatistico, 1998) with a density of              MERCE                                  dynamics (PCRJ/IPP, 2002).
4640.17 inhabitants/km2 (IBGE, Censo              INDUSTRIAL                    2.54        According to the Census Bureau
2000), nestled in rugged topography in                                                   (Anuario Estatistico, PCRJ, 1998)
                                                  INSTITUTIONAL                 8.05
Southeast Brazil. To the south is the                                                    the age population structure of Rio
Atlantic Ocean, to the east the                   LEISURE                       1.33     confirms the historical trend of being
Guanabara Bay. The result of this                                                        the state with highest number of eld-
                                                  NATURAL AREAS                53.70
encounter is 86km of coastline that                                                      erly. This is strongly influenced by
includes another bay, Sepetiba, to the            LAGOONS                       1.19     the population pyramid composition
west of the city. There are 72 beaches                                                   in the city where the younger sec-
                                                  AGRICULTURE                   6.20
interrupted by mountains (PCRJ, 1998).                                                   tions are losing importance, corre-
   The city has a hot and humid climate,          GREEN AREAS                  19.05     sponding to only 23.2 per cent of
sunny all year round, with maximum and            UNOCCUPIED                   27.26     the population (0-14 years). This
minimum temperatures of around 40º C                                                     results from a decrease in the birth
and 22º C in summer and 24º C and 12º           Source: Anuário Estatístico, PCRJ,       and death rates, that started in Rio
                                                         1998
C in winter. Mountain formations of a                                                    before other parts of Brazil
                                                                                                                                    4
U N D E R S TA N D I N G S L U M S : C a s e St u d i e s f o r t h e G l o b a l R e p o r t o n H u m a n S e t t l e m e n t s 2 0 0 3
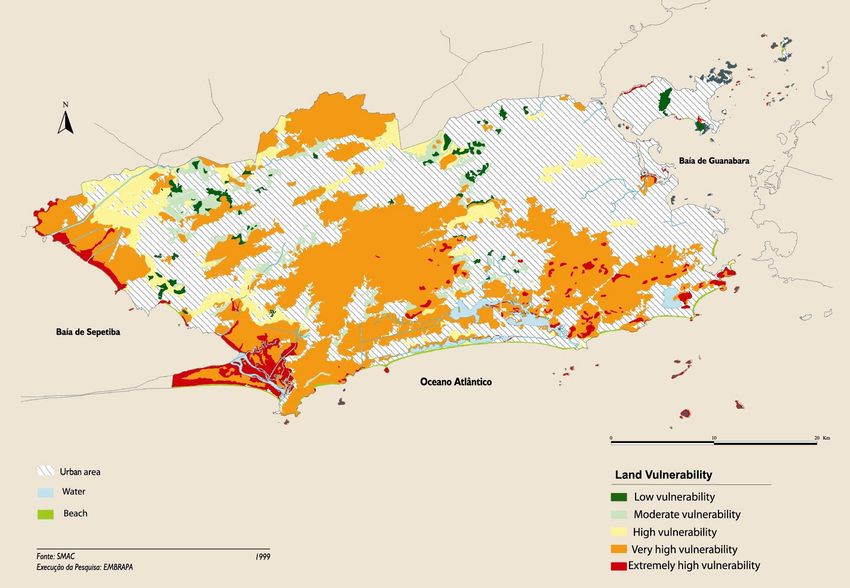
Figure 1: Environmental
Vulnerability in the City
(PCRJ/IPP, 2002). services for 7.5 per cent. The industrial sector of Rio is
Summing up, the 2000 Census seems to highlight particularly diversified, presenting the following compo-
new trends that are: decreasing population growth in sition for the year 1999:
the city, increases in the proportion of elderly popula- The crisis of the traditional naval industry, that was
tion (nowadays over 750 thousand people), and a strongly concentrated around the Guanabara Bay area
strong predominance of women (around 362 thousand and employed 90 per cent of the workers in the sector,
more than men). is also related to the decline of the secondary sector in
Furthermore, the spatial distribution of the population the city.
in the city shows a high concentration in the oldest During the 1990s Rio showed signs of a recovery in
areas where there is a better offer of infrastructure, its economy. The process of globalisation which was
services, facilities and work. This also attracts an under way will contribute to the installation of new eco-
important part of the low-income people who end up nomic activities in the city, especially in the chemical,
occupying the illegal areas still vacant. Yet, a small service, transport and modern communication technol-
change in this scenario seems to be taking place, as ogy sectors. Its traditional industries of textiles, tourism,
the illustration below demonstrates, with some of these beverages, and clothes have also been strengthening
areas being abandoned. This process might be (PCRJ, IPP, 2002).
explained by several factors: (i) decentralisation of The existence of important educational and techno-
activities in the CBD (Central Business District) to the logical centres in the city – there are seven primary uni-
boroughs; (ii) attraction of new resident populations to versity centres concentrating the most significant scien-
these boroughs; (iii) movement of high-income classes tific production of the country, and traditional institutions
to the coastal expansion areas in the east of the city
(PCRJ/IPP, 2002). Figure 2: Average Annual Geometric Growth in Rio
from 1940 to 2000.
5. The Urban Economy 3.5
The State of Rio de Janeiro is the second most 3
important contributor to the country’s Gross Domestic 2.5
Product (GDP) producing almost 11 per cent of the 2
country total. The GDP of the city represents 67 per 1.5
cent of the State’s GDP amounting around R$67.2 bil- 1
lion in 1998 (Standard & Poor’s, 2002). 0.5
The economic performance of the city by sectors in 0
1999 reveals that industry is responsible for 31.5 per 1930 1950 1970 1990 2010
cent of the total local production, transport and commu-
nications for 26.5 per cent, commerce for 19.9 per cent,
Source: IPP, PCRJ, 2002
the building industry for 14.5 per cent and public utility
5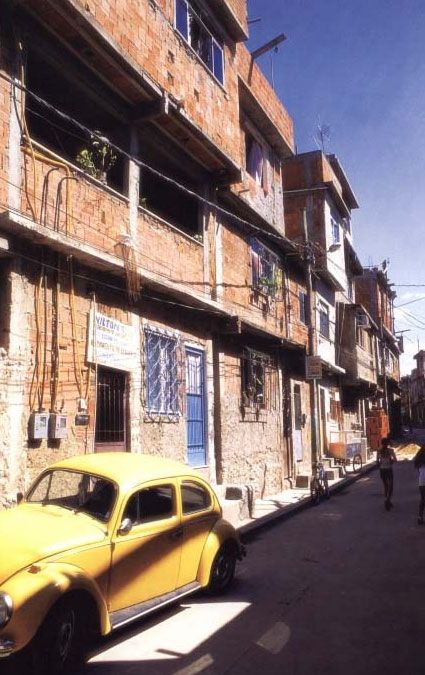
Urban Slums Reports: The case of Rio de Janeiro, Brazil

that deal with management and applied economy to the                 the centre of important productive chains. The railway
new demands of the international market – stress the                 and road systems and airport infrastructures facilitate
integration of Rio into the global cities network.                   connections with national and international markets,
   In the city area are also located the headquarters of             reinforcing its position as a port.
some of the most important companies in the country,                    This economic potential, nevertheless, does not
especially metallurgical and foundry ones (Companhia                 mean that the city avoids un- or under-employment (in
Vale do Rio Doce and Companhia Siderúrgica                           both the formal and informal sectors). Unemployment,
Nacional), large state companies (such as PETRO-                     although decreasing, follows the national pattern. In
                                                                     October 2000, the unemployment rate in the city was
                                                                     5.1 per cent in comparison with 7.5 per cent in the coun-
  Table 2. Resident Population by Gender (1998)                      try. Both rates underwent significant reductions during
                                                                     the year, dropping from their highs of 7.1 per cent in the
                            Men              Women                   city and 9.0 per cent in the country. This indicates an
                                                                     improvement in economic activity in 2000, since the
  1991                         2,583,191         2,877,573           country had recovered from the effects of the Russian
                                                                     and Asian Crises and the 1999 currency devaluation
  1996                         2,608,818         2,942,720           (Standard & Poor’s, 2002).
                                                                        One of the more challenging trends in the economy of
  Source: Anuário Estatístico, PCRJ,1998
                                                                     Rio is the importance of its informal sector, which pre-
                                                                     vents a realistic assessment of the employment situa-
  Table 3: Resident Population by Age (1998)
                                                                     tion. According to the Human Development Index, living
                               %                 No                  conditions measured for the period 81/85 and 95/99
                                                                     reveal that unemployment increased from 6.1 per cent
   0-14                       23.2            1,286,801              to 9.2 per cent, and that the participation of the informal
                                                                     sector decreased from 68.6 per cent to 52 per cent
   15-59                      64.4            3,575,887              (IPEA, 2000).
                                                                        The migration of sectors and the substitution of formal
   60 or more                 12.4             688,850               employment by self employment (increasing from 18.6
                                                                     per cent to 26.3 per cent), highlights a deterioration in
   Total                      100
                                                                     the working class conditions (PCRJ, 2000).
  Source: Anuário Estatístico, PCRJ, 1998                                                                In relation to the rest of
                                                                                                     the country the city has
  Table 4. Socio-Economic Data for the City, Rio de Janeiro 2001                                     an       average       family
                                                                                                     income         of     around
                                          ILLITERACY       YEARS OF STUDY
                                                                               AVERAGE FAMILY        R$520/month           (IPEA,
   CITY ZONES     AGE EXPECTANCY                                              INCOME PER CAPI-
                                           (above 15)         (above 25)
                                                                                    TA (US$)
                                                                                                     PCRJ,     PNUD,   2000).  So,
                                                                                                     although living condi-
                  1981/1985 1995/1999 1981/1985 1995/1999 1981/1985 1995/1999 1981/1985 1995/1999    tions in Rio are in gener-
                                                                                                     al better than in most of
  South Zone             62        69.8    3.5%       2.3%     9.83     10.96  3056.00    3707.00    the metropolitan regions
                                                                                                     of Brazil, they are
  North Zone           61.1          69    5.2%       2.3%     7.55      9.32  1422.00    1771.00    extremely badly distrib-
                                                                                                     uted, given the large dif-
  Suburb               59.4        67.3    7.5%       3.1%     5.96      8.08   812.00    1125.00
                                                                                                     ferences between its
  SuburbMiddle                                                                                       regions and boroughs.
                         59        66.5    9.4%       4.2%     5.83       7.2   864.00    1039.00
  Distance                                                                                               The city presents a
  SuburbLong                                                                                         very badly distributed
                       58.4        64.5    7.5%       4.2%     5.48      6.89   688.00     796.00
  Distance                                                                                           pattern: the richest 1 per
  East Zone            56.8          64    7.3%       4.2%     5.51      6.93   642.00     745.00
                                                                                                     cent of the population
                                                                                                     earns 12 per cent of
   Source: O Globo, 2001                                                                             income and the poorest
                                                                                                     50 per cent earns 13 per
                                                                                                     cent of the income
BRAS), the development bank (BNDES) and key for-                     (IPEA, PCRJ, PNUD, 2000). The “Gini” index, which
eigner companies such as Esso, Shell, BAT industries                 varies between 0 and 1 and indicates the concentration
and IBM.                                                             of income to the highest sectors, was 0.491 in the peri-
  The strategic position of Rio in the country places it at          od 1997-1998. This reveals a serious picture of income
                                                                                                                                      6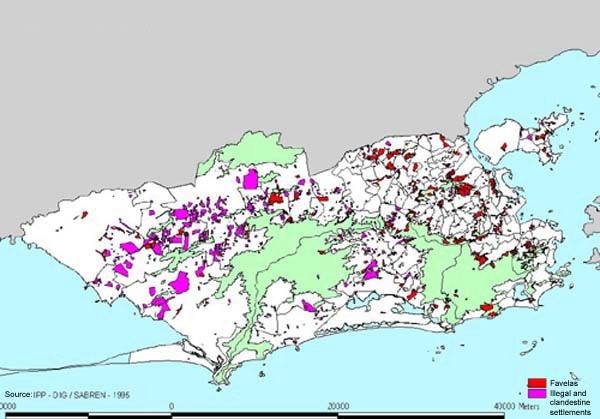
U N D E R S TA N D I N G S L U M S : C a s e St u d i e s f o r t h e G l o b a l R e p o r t o n H u m a n S e t t l e m e n t s 2 0 0 3

    concentration and of socio-spatial disparity (IPP, 2000).                  exclusion and fragile life conditions, as it is the case of
       Spatially, the southern zone of the city is clearly the                 the favelas. They can be located in high-income areas,
    richest, with an income per capita 2.5 times higher than                   in middle and in low-income districts, but they clearly
    the average income of the city as a whole, and 5 times                     contrast with the “formal city”. These disparities are
    higher than the income of the western zone (IPEA,                          reflected in the hard reality of the everyday life of the
    PCRJ, PNUD, 2000).                                                         favela dwellers, who represent 17 per cent of the total
       The social inequality in the city is not confined to the                population of Rio (PCRJ/IPP, 2002). Their integration to
    administrative limits of the boroughs and administrative                   the employment market is very unstable and fragile, and
    regions. In this sense, the idea of “periphery” denotes                    they have average incomes equivalent to 1/4 of those of
    not necessarily only spatial distance but rather social                    people living in other areas of the city.

    Table 5 : Internal Gross Domestic Product (GDP) by
                                                                               6. Governance
             Type of Industry 1999 (in US$ Million and %)                         The municipalities are federated units that hold the
                                                                               same political-administrative status as other levels of
          Type of Industry                     GDP                %            government – the States, the Federal District and the
                                            (U.S. Million)                     Union. They have autonomy to manage local interest
                                                                               issues, particularly those of an urban nature, and are
     Eletric eletronic Material                         80.8             2.3
                                                                               regulated by a law denominated “Lei Organica do
                                                                               Municipio”.
     Non - metalic Minerals                           109.9              3.2
                                                                                  the city of Rio the housing problem has been gaining
                                                                               increasing importance in the political agenda of the
     Dressing and Shoes                               137.5              4.0
                                                                               Executive and Legislative Powers. With such a high
     Equipament and Machinery                         199.9              5.8
                                                                               housing deficit in the metropolitan region of Rio de
                                                                               Janeiro – over 505,000 units (FPJ, 2000), the municipal
     Paper and Publisher                              346.6             10.1   government was forced to implement a broad policy to
                                                                               attend the different types of slums. Urban interventions
     Food Products                                    361.1             10.5   and the modernisation of policies on land use were con-
                                                                               ceived in order to increase accessibility to the “formal
     Other Types                                      395.1             11.5   city” to a broader number of inhabitants. Social policies
                                                                               such as the promotion of income generation activities,
     Chemestry                                        409.2             11.9

     Chemical                                         417.3             12.1   Table 8 : Employed Population by Activity Sector

     Metarlugy                                        441.1             12.8                               1997               1998

     Beverages                                        547.5             15.9   INDUSTRY                         268,567           234,178

     TOTAL                                           3446.0             100    CIVIL CONST.                     104,014           101,667

    Source:CIDE, 2001 (1999 data)
                                                                               COMMERCE                       5,314,311           318,067

    Table 6: Average Month Income in Minimum Wages by                          SERVICES                       1,409,338          1,379,850
             Age
                                                                               OTHERS                           223,668           210,610
      10-14          15-17    18-24         25-29      30-39    40-49
                                                                               Source: Anuário Estatístico, PCRJ, 1998
       1.67          1.56     3.04          4.73        6.64     8.98
                                                                               Table. 9 Rate of Unemployed Population by Gender
    Source: Anuário Estatístico, PCRJ, 1998

                                                                                                          Woman                Man
    Table 7: Average Month Income in Minimum Wages by
             Gender
                                                                                       1997                          4.07               2.86

          Woman                      Man                                               1998                          6.17               4.20

              6.85                   5.54           Source: Anuário            Source: Anuário Estatístico, PCRJ, 1998
                                                    Estatístico, PCRJ, 1998

7
Urban Slums Reports: The case of Rio de Janeiro, Brazil

construction of nurseries, health and education centres              The Municipal Planning Institute (IPP, PCRJ) record-
were included to fight exclusion.                                 ed in 1996 a total number of 605 “favelas”. It is also esti-
   The exceptional characteristics of beauty and vulnera-         mated that from 1996 to 2002 around 100 new “favelas”
bility of the city’s location, demand the adoption of envi-       have appeared in the city, while others have grown in
ronmental policies, especially those that allow solutions         size (O Globo, 19/05/2002).
to the aggressions resulting from the illegal occupation of          The population of the “favelas” during the period from
fragile areas. Some actions are corrective, but a number          1991 to 2000 has grown by 0.38 per cent a year while
are preventive, especially the housing policies.                  in the country it has increased by 2.4 per cent (IBGE) .
   In political and institutional terms the municipal gov-        In 1991 the total number of inhabitants of “favelas” in the
ernment is formed by executive and the legislative pow-           city was around 882 thousand and in 2000 the Census
ers. The executive power is held by the municipality.             recorded 1,092 thousand (IBGE).
The highest position in the municipality is occupied by              The “favelas” occupy an area of around 37 km2 in the
the mayor, who is elected directly by popular vote, and           city corresponding to 6.3 per cent of its total territory
is the chief of the political, executive and administrative       (IPP,PCRJ, 2001).
functions. The municipal secretaries are nominated by
the mayor, and are responsible for formulating and                1.2. Illegal Subdivisions (loteamentos irregulares)
implementing the several public policies that constitute             These are illegal subdivisions of land that lack infra-
the local authority administration. The municipal cham-           structure and do not comply with planning rules, but nor-
ber of Rio de Janeiro holds the legislative power. This is        mally have some kind of urban physical order. They are
formed by 42 members (according to the Federal                    considered irregular when have been submitted to the
Constitution of 88) elected also directly by popular vote         planning authorities but have not complied with the legal
for a mandate of four years coinciding with the mayor’s           urban requirements, and clandestine when have not
mandate. The municipalities of over 5 million inhabitants         been submitted to the planning authority at all.
have a minimum of 42 and a maximum of 55 members.
                                                                  1.3. Invasions (invasões)
                                                                    Irregular occupation of public or private land, still in
                                                                  the process of consolidation. This frequently takes place
                                                                  in environmentally fragile areas – riverbanks, swamps
II. SLUMS AND POVERTY                                             and hills or in residual areas of public infrastructure –
                                                                  under viaducts, in parks, beside roads and motorways.
B.      TYPE OF SLUM
                                                                  1.4. Cortiços
1.Types                                                              Social housing formed by one or more buildings locat-
   In general four types of slums can be identified – fave-       ed in a single plot or shared rooms in a single building.
las (squatter settlements), loteamentos irregulares ou            The rooms are rented or sub-leased without any contract
clandestinos (illegal subdivisions), invasões (invasions)         or legal basis. The dwellers share the use of bathrooms,
and cortiços. In many parts of the city, especially in the        kitchen and laundry, and sometimes, electrical appli-
western zone, the squatter settlements occupy empty               ances. Houses lack proper ventilation and lighting, are
areas. Illegal subdivisions and some housing estates              frequently overcrowded and one room may house many
also frequently occupy public or common areas. Often              people and accommodate different uses. Services are
throughout the city different types of illegality are mixed,      deficient and do not have adequate maintenance
and it is difficult in many cases to recognise boundaries.        required for good working and security (SEDU, 2000).
    Quantitative data and statistical information are more
frequently available and are best organised and system-
atised for the first two categories. Cortiços and invasões        2. Location of Slums
have been the subject of a number of policies and inter-          2.1. Location of Squatter Settlements (Favelas):
ventions but there is little compiled information avail-             Favelas are spread throughout the city, frequently
able.                                                             occupying hilly sites. Recently some have been located
   The four types of slum could be briefly described as           on flat land, like the “Rio das Pedras” settlement that
follows:                                                          occupies a swamp flooded area in the well-to-do expan-
                                                                  sion zone of “Barra da Tijuca”. It was founded only two
1.1. Squatter Settlements (Favelas)                               years ago and already houses a population of 18 thou-
  Favelas can be defined as highly consolidated inva-             sand inhabitants (PMRJ, 2002). Some favelas are also
sions of public or private land with self-build developed         located along motorways and in swampy areas like the
by the poor on lands lacking infrastructure and without           “favela da Maré”.
following any kind of plans. They exist in large numbers
and are spread across the city.
                                                                                                                                 8
U N D E R S TA N D I N G S L U M S : C a s e St u d i e s f o r t h e G l o b a l R e p o r t o n H u m a n S e t t l e m e n t s 2 0 0 3

    2.2 Location of Illegal Subdivisions (Loteamentos                           Increasing migration from country to the city due to a
    Irregulares)                                                             reduction in agricultural work and an increase in indus-
       The large numbers of illegal and clandestine settle-                  trialisation;
    ments registered in Table 14 shows that the area with
    the highest concentration is the eastern zone of Rio.                      Migrati on from other regions of the country;
    The borough of Campo Grande within this zone has the
    largest number of this type of slum.                                       The urban changes introduced by the mayor Pereira
                                                                             Passos that removed many low-income populations and
    2.3. Location of Invasions                                               demolished their houses;
      At present most of invasions occupy risky areas:
    viaducts, under electricity lines, on the edge of railways,
                                                                               Table 11. Number of favelas by decades
    etc or in public squares, streets and avenues.
                                                                                1880 - 1920          1921 - 1930         1931 - 1940
    2.4. Location of “Cortiços”
                                                                                       24                 32                    56
       “Cortiços” are concentrated in the central area of the
    city and the port region.                                                   1941 - 1950          1951 - 1960         1961 - 1970

                                                                                       85                 97                    84
       This type of slum does not exist in the richer areas of
    the city, but recently a similar sort of housing has                        1971 - 1980          1981 - 1990         1991 - 1993
    emerged on the periphery with the construction of rows                             74                105                     1
    of rooms located at the rear of a plot, and sharing toilet
    facilities.                                                                Source: Favelas Cariocas: Alguns dados estatistícos,
                                                                               Iplanrio, 1993
       Table 15 above shows the list of officially known “cor-
    tiços” that have been improved (or are programmed to
    be improved) by the municipality. All are located in the
    city centre.                                                             Figure 3. Volume of Favela Inhabitants in 1980 by
                                                                                       Administrative Region

    3. Age
    3.1. Age of Squatter Settlements (“favelas”):
        The main causes for the development of favelas in
    the city at the turn of the 20th century can be sum-
    marised as follows:

       The abolition of slavery, resulting in a     large number
    of unemployed and home less people;
                                                                                                                             Over 100,000
                                                                                                                             From 50,001 to 100,000
                                                                                                                             From 25,001 to 50,000

      The crisis of the rural areas;                                                                                         From 10,000 to 25,000
                                                                                                                             Up to 10,000 inhabitants

    Table. 10 Distribution of "Favelas" according to total area Rio de
              Janeiro, 1991

          AREA          NUMBER OF
                                          NUMBER OF         NUMBER OF
           (m²)          SQUATER                                               %
                                          DWELLINGS        INHABITANTS
                       SETTLEMENTS

    UP to 10,000                   167            12.717            53.773      5,81

    From 10,001 to
                                   295          101.773            414.723     44,77
    100,000

    From 100,001 to
                                    61          102.166            404.224     43,64
    500,000

    Over 500,000                     2            14.642            53.544      5,78

    TOTAL                          525          231.298            926.264      100

                   Source: PCRJ, PLANRIO, apud Larangeira, A., 1995

9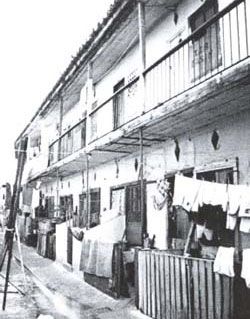
Urban Slums Reports: The case of Rio de Janeiro, Brazil

  At the end of the 19th century, with the abolition of the             the increasing demands and the cortiços and favelas
slavery and the proclamation of the Republic, free poor                 continue to sprawl. According to historical information,
women and men were pushed onto the streets, leaving                     between 1888 and 1890, the population living in cor-
them homeless and unemployed. Many cortiços devel-                      tiços doubled (Abreu, 1994).
oped and favelas occupied the hills in the city centre. As                 The first cortiço to be demolished by the urban
early as in 1822 there was already public concern with                  renewal project of Pereira Passos in 1893 was known
cortiços, and the government exempted industries from                   as “Cabeça de Porco” and it was located near the main
taxes that built social housing. The amount of social                   train station in the city centre. This demolition left 2,000
housing built was however very small compared with                      people homeless.

 Figure 5, 6 Favelas in Rio
                                                                 Table 12. Number of Favelas by Decades

                                                                    1880 - 1920                1921 - 1930            1931 - 1940

                                                                           24                       32                    56

                                                                    1941 - 1950                1951 - 1960            1961 - 1970

                                                                           85                       97                    84

                                                                    1971 - 1980                1981 - 1990            1991 - 1993

                                                                           74                      105                     1

                                                                 Source: Favelas Cariocas: Alguns dados estatistícos, Iplanrio,
                                                                 1993

                                                        Table 13 Distribution of Favelas by Total Area Rio de
                                                        Janeiro, 1991

                                                                 AREA           NUMBER        NUMBER OF    OCCUPIED    NUMBER OF

                                                                 (m²)           OF SUBDI-       PLOTS       PLOTS        INHABI-        %

                                                                                VISIONS                                  TANTS

                                                         UP to 10,000                  30          1,200       1,002            5,050       5.43

                                                         From 10,001 to
                                                                                       77          9,085       7,740           38,340   41.27
                                                         100,000

                                                         From 100,001 to
                                                                                       16          6,389       5,409           27,040   29.10
                                                         500,000

                                                         From 500,000 to
                                                                                          2        5,897       2,776           13,880   14.94
                                                         1,000,000

                                                         Over 1,000,000                   1       11,754       1,720            8,600       9.26

                                                         Total                        126         34,325      18,647           92,910   100.0

                                                       Source: PCRJ/IPLANRIO, apud Larangeira, A., 1995

                                                                                                                                                   10
U N D E R S TA N D I N G S L U M S : C a s e St u d i e s f o r t h e G l o b a l R e p o r t o n H u m a n S e t t l e m e n t s 2 0 0 3
The Expansion of the Favelas: 1900 – 1930 Table. 14. Illegal subdivisions in the East Zone of
The need to modernise the city according to Rio de Janeiro - 1980
European models and standards changed the pattern of TYPE EAST ZONE CITY %
narrow streets in the city centre, and many old buildings
were demolished, especially those housing working Illegal
348 430 81
Subdivisions
class people. With this urban reform the plots further
away from the city centre increased in value. The popu- Housing Estates
38
75 51
lation left homeless started to build their own houses in
the hills around the city centre (Providência, São Carlos "Favelas" 309 13
43
and Santo Antônio) or moved away to the suburbs. Source: PCRJ,IPLANRIO apud FASE, 1980
Table 15 Location and number of rooms of "Cortiços"
Figure 7. Favelas in Rio According to 1999 data Rio de Janeiro, 1998
BUILT NUM-
CITY ZONE ADDRESS AREA BER OF
(m²) ROOMS
Planning Zone 1
Administartive Rua Cunha Barbosa, 39 376 24
Region I Port Rua Sacadura Cabral 295 413 17
Area Rua do Monte, 59 224 7
Av. Henrique Valladares,2 687 21
Rua da Constituição, 3 a 9 792 15
Rua da Constituição, 6 644 75
Rua do Lavradi, 122 1000 75
Figure 8. Illegal Subdivisions in the Rio Periphery Rua dos Inválidos, 124 1740 69
Administartive Rua Gomes Freire, 607 264 10
Region II Rua Gomes Freire, 610 200 4
Central Area Rua Gomes Freire, 625 246 20
Rua Gonçalves Ledo, 5 570 90
Rua Luís de Camões, 112 448 21
Rua Regente Feijó, 55 432 20
Rua Senador Pompeu, 36 820 22
Rua Senador Pompeu, 51 1165 52
Travessa do Mosqueira, 20 257 10
Source: Anuário Estatístico , PCRJ, 1998
Figure 9 Invasion in Rio de Janeiro
The public health director in 1913 gave the following
description of the city: “in the Morro da Favela
(Providência) there were 219 houses and in Santo
Antônio 450 houses, totalling around 5,000 people living
in the two areas. In the seven urban districts there were
2,564 shacks with 13,601 people”. The city centre was
the first area of Rio to concentrate a labour force and, in
consequence, housing. The slums have always devel-
oped near those concentrations given that the poor are
attracted by the offer of employment, establishing their
houses near their work in order to minimise expenses
and time lost through travelling (PCRJ, IPP, 2000).
11Urban Slums Reports: The case of Rio de Janeiro, Brazil
At the end of 1910 new areas were occupied outside From 1950 to 1964 the economic crisis grew worse.
the city centre: the suburbs with new working-class pop- Urban land suffered from speculative development, and
ulation attracted by the establishment of the industries plots remained empty to increase their value. The city
in those areas, and the southern zone of Rio, with the lacked a policy of urban development. In parallel, mass
establishment of high income houses. The only area transport allowed low-income people to move to plots
controlled through building codes and planning permis- far away from their work. Distances in the city
sion was the southern part. The rest of the city grew out- increased, while the offer for new developments in the
side the law with no planning or building control. city was drastically reduced and prices of land rose.
The first plan of the city was developed in the 1920s. Land in the periphery, lacking infrastructure was the
It was the first official document to deal with the prob- only available choice for migrants. Housing crises were
lems of favelas, suggesting their eradication. The fave- ever more critical. In this decade the growth of the fave-
las were seen as an “epidemic” that was growing in the las was huge. According to Parisse (in Abreu, 1997)
best and most expensive areas of the city. they housed a total of 169,305 inhabitants in 1950. Ten
years later they housed over 335,063 dwellers, corre-
The Expansion of the Favelas: 1930-1964 sponding to a growth of 98 per cent. By the mid 1960s
Around 1930 the city was highly segregated, with dif- a clientelist housing policy was launched by the state,
ferent areas for the well-to-do, the middle classes and but the old slum removal policy continued to prevail,
the poor. The first lived in the south, the second in the especially in areas required for new industry in the
north and the low-income classes in the suburbs. By north, or by developers in the south. In parallel a small
that time these suburbs were already dense, and the number of re-urbanisation projects for favelas were car-
only alternative left to the poor was to live far away in ried out, in contrast with the mainline policy of slum
the periphery or in favelas in risky sites like the river- removal (PCRJ, IPP, 2000).
banks and on steep hillls. The areas occupied by the
squatters were frequently bad and not very attractive to
the developers. Migratory movements grew and labour 3.2. Age of Illegal Subdivisions (loteamentos
offered by favela dwellers was in high demand by indus- clandestinos e irregulares)
try, commerce and services. Furthermore, it was politi- Illegal subdivisions started to appear in Rio in the
cally disadvantageous to remove slums, so the favelas 1930s, as a result of the subdivision of old orange
remained, with no major interventions. farms. These farms were subdivided as a consequence
In the period from 1930 to 1950 the city, both legal and of the World War II crisis, and the spread of orange
illegal, expanded significantly. The electrification of the plantation parasites (Fase, 1986).
railway system, from 1937 onwards, and the opening of This new urban use of farmland represented an alter-
Avenida Brasil (1964), connecting the centre directly with native to the already non-productive agricultural sector.
the suburbs, allowed the expansion of industries, and It also represented access to cheap urban land owner-
contributed to suburban sprawl. The opening of this ship, since plots were offered without infrastructure and
avenue brought a number of favelas to the region. services, for low prices.
Figure 10. A "Cortiço" in the City Centre Figure 11. Location of "Favelas" and Illegal Subdivisions in the City
12U N D E R S TA N D I N G S L U M S : C a s e St u d i e s f o r t h e G l o b a l R e p o r t o n H u m a n S e t t l e m e n t s 2 0 0 3
The main factors that stimulated the growth of the ille- C. OFFICIAL DEFINITIONS FOR
gal subdivisions were: i) n increasing demand as a POLICY PURPOSES
result of large migration flows attracted by industrialisa-
tion during the 1980s; ii) a strong squatter settlement 1. Definitions and their Predominant Use
removal policy, especially in the areas most attractive to During the 20th century most housing policies were
speculative building, especially during mid 1960s; and developed to eradicate what has been known as “sub-
iii) the restrictions imposed on the building sector by the standard” housing. Many of these policies have been
subsequent legislation coupled with lack of finance of guided by a hygienist vision of the problem. Sub-stan-
social housing (Fase, 1986). dard settlements (“aglomerado subnormal”) according
The transition from rural to urban has given the to the Statistical Bureau (IBGE) are groups of 50 or
periphery of Rio a diversity of land uses, with a predom- more housing units located in a dense and disorderly
inance of low income populations. Nowadays there are manner, on land belonging to third parties, lacking infra-
a total of 348 illegal subdivisions in the city (in the structure and services.
process of regularisation). It is estimated that there are This broad definition appears for the first time as a
40,000 plots housing 160,000 inhabitants (PCRJ, SMH, statistical category in the 1950 census, and has been
Sabren 2002). since then applied by the IBGE to quantify housing
demand. Officially, settlements are considered sub-
3.3. Age of Invasions (Invasões) standard if they fulfil the following characteristics: i)
This is an old phenomenon that led to the formation of small size – residential settlements with under 50
“favelas”. At present it has assumed new characteris- dwellers; ii) type of housing – often houses make use of
tics, occupying very specific locations. The cases are precarious materials or have a raw appearance
very particular and localised, and are difficult to map deprived of any external finishing; iii) illegal occupation
and quantify, requiring special policies. conditions – dwellings are built without any building per-
mits, on land owned by somebody else or of unknown
3.4. Age of “Cortiços” ownership; and iv) urbanisation – the area is deprived of
This type of housing appeared at the beginning of the official streets and numbering, lacking infrastructure and
20th century with the urban renewal of the city centre. services (SEDU, 2000).
4. Population Size and Characteristics of Table 16. Distribution of Squatter Settlements by Year of
Slums Occupation, Number of Dwellings and Inhabitants –
1900 / 1991 – Rio de Janeiro
Disaggregated information is not available, but the
Rio de Janeiro census offer some general data for NUMBER OF
SQUATER NUMBER OF NUMBER OF
“favelas” shown in the table 19 below. Data for illegal PERIOD SETTLE- DWELLINGS INHABITANTS
%
MENTS
subdivisions refer only to areas where the municipality
is implementing urbanisation programmes, the other UP to 1900 6 3.999 15.202 1.64
type of sub-standard housing (slums) do not have
recorded or available data. From 1901 to 1910 5 2.728 11.521 1.24
From 1911 to 1920 12 14.104 55.347 5.98
From 1921 to 1930 32 20.768 84.218 9.09
From 1931 to 1940 54 34.853 133.686 14.43
From 1941 to 1950 83 46.774 190.684 20.59
From 1951 to 1960 96 50.865 201.181 21.72
From 1961 to 1970 83 27.798 109.963 11.87
From 1971 to 1980 70 16.647 71.564 7.73
From 1981 to 1991 84 12.762 52.898 5.71
TOTAL 525 231.298 926.264 100
Figure 12. “Favelas” in the City up to 1995
Source: PCRJ, IPLANRIO, apud Larangeira, A., 1995
13Urban Slums Reports: The case of Rio de Janeiro, Brazil
Under this definition we could identify three types of legalisation of favelas and illegal occupations, supply of
“sub-standard” housing, particularly in Rio: favelas, ille- local housing and units of popular services, improve-
gal subdivisions (loteamentos clandestinos e irregu- ments to infrastructure and decrease in the housing
lares) and Cortiços (SMH, PCRJ, 1994). From 1990 deficit (PCRJ, SMU, 1993). The Municipal Secretariat of
onwards the municipal housing programme has gained Housing, founded in 1993, has structured its housing
importance under the Municipal Master Plan (Plano policy towards these aims embodied in the following key
Diretor Decenal da Cidade do Rio de Janeiro). The Plan programmes: “Favela-Bairro”, “Regularização fundiária
has recognised the need to face the housing problem e titulação”, “Morar sem risco”, “Mutirão renumerado”
for the low-income population through a strategy of and “Novas Alternativas” (Fiori, Riley and Ramirez,
urban policies for the entire city. The specified aims 2000).
include: rational use of urban land, improvement and In the last ten years, the government and NGOs have
adopted the term “comunidade” (community) to refer to
squatter settlements (“favelas”). This term has also
Table 17. Illegal Subdivisions in Rio de Janeiro in been absorbed by residents.
Process of Regularisation 2002
Number of Number
TYPE Population*
Subdivisions of plots*
Illegal Subdivisions 855
88,721
348,000 D. UNOFFICIAL DEFINITIONS OF
Low Income Illegal
SLUMS
348 40,000 160,000
Subdivisions
1. Popular Understandings
Regularized 100 23,000 90,000
Poor people living in slums clearly identify two main
Source: PCRJ, IPP - SABREN (Sistema de Assentamentos de categories - the illegal subdivisions (loteamentos irreg-
Baixa Renda), 2002 ulares) and the favelas (squatter settlements). In the
Interview with the managger of the municipality regularization
ofi Illegal subdivisions sector, PCRJ, SMH - 06/2002
illegal subdivisions people build illegally in a plot they
*estimated have acquired lacking infrastructure and resulting from
an illegal process of subdivision of land that does not
Table 18. Distribution of Illegal Subdivisions by Year of comply with mandatory urban regulations. In a favela
Occupation, Number of Dwellings people acquire a shack or a slab, where they will make
and Inhabitants – 1930 / 1991 – Rio de Janeiro extensions or increase the number of floors.
NO. OF NO.OF
There is nevertheless, a common understanding that
PERIOD SUBDIVI- % INHABI- % all that has an irregular appearance is poorly built or
SIONS TANTS
lacks infrastructure is a favela. Even some housing
UP to 1930 1 0.39 450 0.30
estates that have suffered uncontrolled changes have
acquired the aspect of a “favela”, meaning run down
From 1931 to 1940 3 1.18 2.370 1.59 accommodation.
From 1941 to 1950 4 1.57 5.335 3.57
2. Local Language Terms for Slums
From 1951 to 1960 31 12.20 31,405 21.04
“Cortiço”
From 1961 to 1970 49 19.30 39,950 26.77 “Favela” and “Morro”
“Comunidade” – general term frequently used to refer
From 1971 to 1980 23 9.06 9,215 6.17
to slums
From 1981 to 1991 22 8.66 4.590 3.08 “Loteamento” – to distinguish someone that lives in a
settlement more regular than a favela; a broad term
Without information 121 47.64 55,940 37.48 generally used to name illegal subdivisions.
“Vilas periféricas” – recent typology frequent in the
TOTAL 254 100 149,255 100.00
periphery of the city that is constituted by a row of bed-
Source: PCRJ, IPLANRIO, apud Larangeira, A., 1995 rooms sharing kitchen and laundry facilities;
“Vila, Parque and Jardim” – terms used recently to
Table 19. Squatter Settlement population to total name old illegal subdivisions that have received public
population infrastructure and services;
Year Squatters City pop. %
2000 1,092,783 5,851,914 18.5
Source: IPP, PCRJ, 2002
14U N D E R S TA N D I N G S L U M S : C a s e St u d i e s f o r t h e G l o b a l R e p o r t o n H u m a n S e t t l e m e n t s 2 0 0 3
3. Slum Dwellers’ Perception of their per capita (sum of the incomes of all members of a fam-
Status ily divided by the number of family members) below 50
“I am 31 years old and have lived here for 31 years. My per cent of the minimum salary on 1st of September
whole life is rooted here. I live in the “morro” because I need to, 1991 (in IPEA, 1998).
since I am unable to live where I wish in the southern zone of
the city, in a nice house, or a nice flat, with the ideal conditions According to the Rio Human Development Report
that all human beings like. So, I am left with only two choices: (Relatório de Desenvolvimento Humano no Rio) devel-
to stay in the “morro” and try to improve the place where I was oped by PNUD and IPEA, currently poor are people
born, or to move to the “suburbs” far away from the city” (Itamar below the poverty line when they have incomes below
Silva, Morro Santa Marta, Iplanrio 1988, p. 56).
R$82.00 (U$221.40) per month, which corresponds to
“In this community I was able to have my own house, avoid- the minimum income considered necessary to fulfil the
ing having to pay rent; I also see that this place is improving basic needs of a citizen, including housing, food, health,
with the work carried out by the government. I also have easy education and clothes). This corresponds to 34 per cent
transport for working in the south” (Esmeralda da Silva, mar-
ried 55 years old, homeowner of two houses, house keeper,
of the total population of Brazil and 12.3 per cent of Rio’s
Favela Complexo do Alemão, Zona Norte). population. The Human Development Report also
defines a number of multiple indices that give a much
“I was able to buy a plot in a subdivision near my relatives better picture of poverty of a qualitative nature (i.e.
and with their help I have built a small house. I feel good hav- access to services, healthcare, education, level of edu-
ing my own house that will be inherited by my daughter and my
granddaughter” (Alda Maciel, housekeeper, divorced, 1 daugh-
cation, child mortality rate, nutrition, food, etc). These are
ter and 1 granddaughter). measured globally by the Human Poverty Index that
allows for a world-wide comparison. Figure 30 below
shows the index for several capitals in Brazil where Rio
de Janeiro appears with very similar values to the others.
E. OFFICIAL DEFINITIONS OF As with many international agencies, the definition of
POVERTY poverty currently used in Brazil is frequently connected
to income and capacity to buy or acquire a minimum
1. Definitions level of services and goods. So poverty is frequently
Official documents and organisations normally refer to connected to the absence of certain material conditions,
poverty in connection with concepts such as the number lacking partially or globally, goods and access to servic-
of poor people, income distribution (per capita and per es required to live, this is to say, when people are “seg-
family) and poverty lines. The Census Bureau (IBGE) regated” be from society. Poverty, like unemployment, is
also uses the concept of poverty in relation to a given normally understood to be a structural problem. The link
minimum wage. The idea of a minimum wage is related between poverty and unemployment has been always
to “survival” and in Brazil it emerged during the 1930s, present, and much of the statistical data is still on
based on research which measured the value of a bas- employment. The methodology adopted in Brazil by the
ket of the food most commonly consumed by workers’ IBGE (Census Bureau) to measure unemployment is
families. The 1988 Brasilian Constituion returns to this the one developed by the International Labour
concept establishing that a minimum wage is a mone- Organisation and used in most parts of the world. This
tary reference that enables workers to fulfil their fami- defines the unemployed as those people who are part of
lies’ basic needs – including food, housing, education, the economically active population (people aged from
health, leisure, clothing, hygiene, transport and social 10 to 65 years) but who are temporarily jobless (not
security. The basic basket is measured in the main cap- more than two months).
itals of Brazil, so the minimum wage varies according to An analysis of the evolution of poverty in Rio in the
the geographical location. The minimum wage is last few decades shows that: i) the city has increased its
defined according to the value of the basket for a fami- share of national poverty, to reach levels similar to those
ly with two children and it is corrected annually. for the rest of the country in 1995: 20 per cent of the
Above all the Constitution establishes that the State population is poor, due largely to the decline in its eco-
(Federation, States and Municipalities) is responsible nomic activity; ii) the results of the evolution of poverty
“for fighting the causes of poverty and marginalisation, during the 1980s are the worst in Brazilian history, prob-
and promoting the social integration of deprived people” ably resulting from important changes in the productive
( Federal Constitution, Article 23, 1988), structure and levels of labour income; and iii) a margin-
The distinction between the poor and the non-poor is al reduction of poverty from 1995 resulting from the
based on the establishment of an artificial line that price stabilisation policy adopted in the country, that
defines the boundaries between the two groups and benefited those with lower incomes (IPEA, 1997).
allows the measurement of the number of people in
each category. In the Atlas of Human Development in 2. Changes to Definitions over Time
Brazil, published in 1998, the proportion of poor is In Latin America during the 1950s and 1960s the theme
defined as the number of people with family incomes of poverty was strongly connected with the idea of mar-
15You can also read