Richard A. A. Noble , Myron King, Michael van Zyll de Jong, and Johannes Radinger
←
→
Page content transcription
If your browser does not render page correctly, please read the page content below
Risk Assessment and Decision Making
on Mitigation Measures
                                                                                                 15
Ruben van Treeck , Christian Wolter , Ian G. Cowx,
Richard A. A. Noble , Myron King, Michael van Zyll de Jong,
and Johannes Radinger

15.1     Introduction

Sustainable development aims for decarbonized renewable energy to combat the impacts
of climate change. Hydropower is one mode of renewable energy that actually con-
tributes about 16% to the global gross electricity production (IEA 2020). Capturing
energy from rivers is in line with the revised EU Renewable Energy Directive (Direc-
tive (EU) 2018/2001 of 11 December 2018), which established at least 32% share of

R. van Treeck (B) · C. Wolter · J. Radinger
Leibniz Institute of Freshwater Ecology and Inland Fisheries, Berlin, Germany
e-mail: ruben.vantreeck@ifb-potsdam.de
C. Wolter
e-mail: christian.wolter@igb-berlin.de
J. Radinger
e-mail: johannes.radinger@igb-berlin.de
I. G. Cowx · R. A. A. Noble · M. King
Department of Biological and Marine Sciences, Hull International Fisheries Institute (HIFI),
University of Hull, Hull, UK
e-mail: i.g.cowx@hull.ac.uk
R. A. A. Noble
e-mail: r.a.noble@hull.ac.uk
M. King
e-mail: mking@grenfell.mun.ca
M. van Zyll de Jong
Department of Biological Sciences, University of New Brunswick, Saint John, NB, Canada
e-mail: m.vanzylldejong@unb.ca

© The Author(s) 2022                                                                           167
P. Rutschmann et al. (eds.), Novel Developments for Sustainable Hydropower,
https://doi.org/10.1007/978-3-030-99138-8_15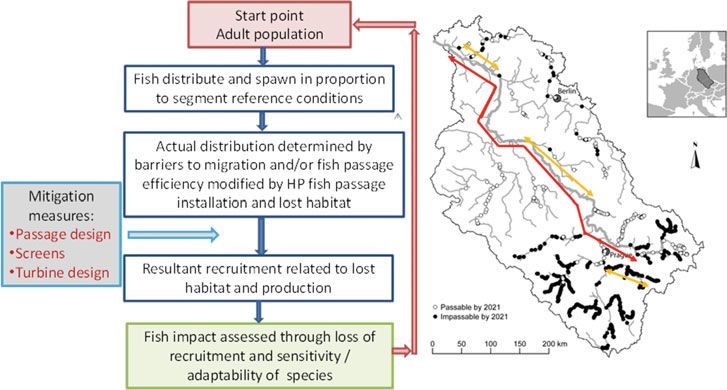
168                                                                      R. van Treeck et al.

the Union’s gross final consumption as new binding target for the EU by 2030, with a
possible upwards revision already in 2023.
   Directive 2018/2001/EU also advocates measures to support small renewable schemes
through direct price initiatives such as feed-in tariffs (Article 17). Such incentives
supported refurbishment and new installation of renewable energy schemes, including
small-scale hydropower schemes in EU Member States. However, hydroelectricity gen-
eration causes a variety of environmental effects (compare Chap. 4) causing trade-offs
between carbon emission-free energy generation and environmental impacts, which con-
tradict other EU policies like the Water Framework Directive or the Biodiversity Strategy.
Still, there is no commonly agreed, standardized and reproducible environmental risk and
impact assessment of hydroelectricity generation to inform decisions on commissioning
new or refurbished hydropower plants.
   This chapter presents the first comparable environmental hazard scoring tool for risks
and impacts of hydropower plants on fishes and further guidance for assessing cumulative
effects of consecutive barriers and hydropower plants within a river to support informed
decisions to mitigate environmental impacts from hydropower.

15.2     The European Fish Hazard Index

The trade-off between renewable hydroelectricity and environmental risks and impacts
of hydropower plants (HPPs) on river ecosystems needs careful consideration at every
single hydropower scheme. A suitable assessment framework evaluates hazards of one
hydropower constellation relative to others as a function of their specific operational,
constructional and technical characteristics and the ambient fish community, its sensitivity
and species-specific mortality risk.
    The European Fish Hazard Index (EFHI, van Treeck et al. 2021), is a fish-based assess-
ment tool for screening the risks of hydropower for fishes and meets these requirements.
It translates conceptual and empirical knowledge about hydropower-related hazards for
fishes into site-specific risk scores. The EFHI is designed as modular assessment frame-
work that offsets the relative hazard of a planned or existing HPP with the susceptibility
of the local fish assemblage. It explicitly considers specific autecological characteristics
of local species (van Treeck et al. 2020), their conservation value and specific regional
management targets. The EFHI is applicable across all European biogeographic regions
and can be adjusted to local environmental conditions and conservation objectives by
selecting particular target species. At the same time, the EFHI is comprehensive and
sufficiently versatile to be applied to a wide range of HPP designs in various stream
types.
    The EFHI integrates both, species-specific sensitivities of the fish community derived
from species’ life-history traits and conservation value as well as specific operational,
constructional, and technical characteristics of an HPP. Principally the EFHI’s hazard
15 Risk Assessment and Decision Making on Mitigation Measures                                          169

components and the final EFHI score increase with increasing severity of operational,
constructional, and technical hazards of the HPP and with increasing sensitivity of
the affected species community. The highest possible EFHI scores will be assigned to
hydropower plants posing the highest overall mortality risks to fishes, installed in streams
with numerous sensitive or conservation-critical species.
    EFHI considers five constructional, technical and operational aspects of hydropower
schemes that directly affect fishes: (i) upstream and downstream flow alterations, (ii)
entrainment risk, (iii) turbine mortality, (iv) upstream fish passage, and (v) downstream
fish passage (Fig. 15.1). These factors and their specific hazards are extensively described
by van Treeck et al. (2021). Therefore, this chapter only briefly refers to the EFHI’s
mechanistic functioning. The EFHI considers hazards in relation to the characteristics
of the ambient, site-specific fish community. This is captured by using the sensitivity of
species to additional mortality (van Treeck et al. 2020) to weigh hazards.
    The EFHI requires information about the: (i) HPP’s main dimensions, turbine speci-
fications, operating conditions, fish migration facilities and fish protection installed, (ii)
target species, and (iii) river reach characteristics. Hazard thresholds were derived from
conceptual and empirical knowledge or model results and subsequently categorized to

 Dam & turbines             Risk scores                   Fish assemblage

     US flow                Overall flow             Conservation
                                                                     Species
    condition               alterations                concern
                                                                                       DS passage

     DS flow                Entrainment
                                                                                       FGS gap width
    condition                   risk
                                                                    Anatomy

  Turbine flow               Turbine                                                  FGS presence &
                                                                     Length
      rate                   mortality                                                    design

                               US                                                    Bypass presence &
  Turbine type                                                       Shape
                             passage                                                      design

   Hydraulic                   DS                                     Swim              US passage
    head                     passage                                 bladder
                                                                                      UMF presence &
                                                                                         design
    Stream
                                                                    Sensitivity

   Discharge

                            EFHI

Fig. 15.1 Mechanistic model of the European Fish Hazard Index components. Rectangles = input
parameters, ellipses = derived variables, open circle = final index. The “risk scores” box represents
the process of transferring risk classes, species sensitivities and anatomies into adjusted and unad-
justed hazard- and species-specific risk scores as shown in Table 15.1, which are aggregated to the
EFHI. Figure obtained from van Treeck et al. (2021)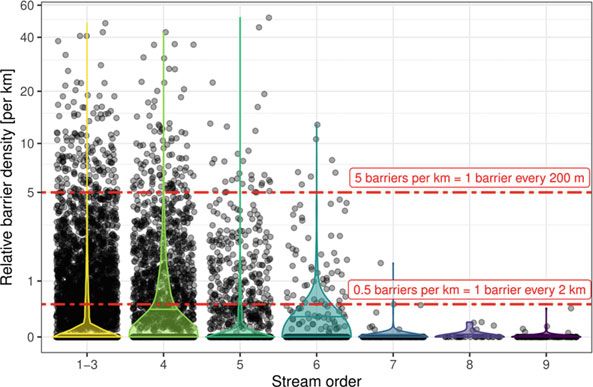
170                                                                           R. van Treeck et al.

“high”, “moderate” or “low” risk. These categories were cross-tabulated and weighed by
the rounded integer value of the species’ biological sensitivity (obtained from van Treeck
et al. 2020) and yield a numerical score for each hazard and target species as shown in
Table 15.1. Component- and species-specific hazard scores can take values from 0 to 1
in 0.25 steps, with higher scores indicating more severe hazards. Up to five target species
can be selected to best reflect the local fish assemblage, conservation concerns and river
reach. Target species can be manually assigned to the highest sensitivity class, regardless
of their original score, to account for regional conservation concerns and management
targets.
   The single elements of the EFHI will be briefly described in the following.

15.2.1 Flow Alterations

The EFHI assesses the impact of both upstream and downstream flow alterations.
Upstream flow alteration is assessed based on the HPPs’ reservoir storage capacity, which
is typically given relative to the average net inflow per time period (Langbein 1959,
McMahon and Mein 1978). Reservoirs with a storage capacity exceeding the average
annual net inflow are scored high risk. Smaller reservoirs and impoundments were further
discriminated by their average flow velocity: Those reducing the mean flow velocity below
0.5 m/s were classified moderate risk and those still maintaining mean flow velocities of
0.5 m/s or higher low risk.
   Downstream flow alterations are typically attributed to either hydropeaking or water
abstraction (e.g., in residual flow stretches of diversion-type plants). Because hydropeak-
ing inherently results in a completely altered discharge regime with severe impacts on
stream biota, this operation mode was always scored high risk. The hazard of water
abstraction, particularly problematic in residual river stretches of diversion schemes, was
scored by environmental flow recommendations following Tharme (2003). Remaining
discharge below 10% of the mean annual low flow (MNQ) was scored high risk. Higher
discharge, but less than or equal 10% of mean annual flow (MQ) was scored moderate
risk and >10% MQ low risk. The overall downstream risk was assigned according to the
higher risk class. Upstream and downstream hazard classes were aggregated into the total
flow alteration hazard using the same principle.

Table 15.1 Weighed
                                                          Target species sensitivity
numerical impact scores for
specific HPP hazards and          Hazard classification   4 (high)    3 (moderate)     2 (low)
sensitive species for             High                    1           0.75             0.5
calculating of the EFHI. Target
                                  Moderate                0.75        0.5              0.25
species sensitivity scores from
low (2) to high (4) from van      Low                     0.5         0.25             0
Treeck et al. (2020)
15 Risk Assessment and Decision Making on Mitigation Measures                             171

15.2.2 Entrainment and Turbine Mortality (ETM)

The total flow rate of all installed turbines was used as proxy of the entrainment risk
for fishes describing the probability of fishes passing through the turbines rather than
taking any other route downstream. This risk was estimated as ratio of flow rate to mean
discharge (MQ) and scored high at ratios ≥1, moderate between >0.5 and 4% and 8% moderate and >8% high risk. To evaluate HPPs with more than one
turbine, the EFHI assigns risk scores for each individual turbine and species as shown in
Table 15.1 and, subsequently, aggregates the relative contribution of each turbine to the
overall mortality rate weighted by the turbines’ specific flow rates. The turbine with the
highest flow rate gets the proportional relevance “1” and all further turbines an equal or
proportionally lower proportional relevance depending on their flow rate. The proportional
relevance of each turbine serves to weigh the mortality risk score.
    We applied the frequently used blade-strike model by Montén (1985) that calculates
the probability of fishes striking a blade depending (among others) on their length and the
space between turbine blades. For these models we used either the body length of fishes
being physically able to pass the FGS or common length of an adult specimen if no FGS
was installed. Modelled mortality rates for Francis and Kaplan turbines were classified
low (0–4%), moderate (>4–8%) and high (>8%), respectively.
    Other turbines without available mortality models were scored based on empirical
data. Low risk turbines were water wheels (
172                                                                     R. van Treeck et al.

The risk score was set to zero for species without swim bladder and thus, not experiencing
barotrauma risk. The risk score remained unchanged for physostomous fishes with an open
swim bladder allowing for quicker pressure compensation, and it was raised by 50% for
physoclistous fishes with closed swim bladder unable to quickly balance pressure changes
(Brown et al. 2013, 2014; Colotelo et al. 2012; Harvey 1963; Wilkes et al. 2018).

15.2.3 Upstream Fish Passage

A major driver of the effectiveness of upstream fish passage facilities is their discharge
relative to the mean discharge of the river, with higher values increasing passage success
(Wolter and Schomaker 2019). We used two linear regressions to determine the minimum
recommended discharge in an upstream migration facility as a function of the discharge of
the stream. One was applied to rivers with a mean discharge up to 25 m3 /s and a discharge
in the upstream migration facility between 3 and 5% of that value, while the other was
used for larger rivers that need less proportional discharge in the upstream migration
facility (between 1 and 3%). Input discharge values as well as calculated “best-practice”
values were rounded to one decimal point and compared. If the actual discharge in the
upstream migration facility equalled or exceeded recommendations, the risk class was
scored low. A discharge ≥50% of the calculated recommendation was scored moderate
risk. Discharges 45° as
well as any constellation without fully accessible bypass were scored as moderate risk.

15 Risk Assessment and Decision Making on Mitigation Measures                          173

A missing FGS or bypass was scored as high risk. Similar to upstream fish passage haz-
ards, the bi-directional performance of a nature-like fishway is rewarded by reducing the
downstream passage hazard score by 20%.

15.2.5 Final EFHI Score

The calculations outlined above produce in total 20 single score values: four hazard com-
ponents individually assessed for five fish species each. Their aggregation is conducted in
two steps; first the arithmetic mean is calculated for each component and second, the
component means are averaged to the final EFHI score. Final scores ≤0.33 were clas-
sified “low risk”, scores between >0.33 and 0.66 were classified “moderate risk” and
scores >0.66 were classified “high risk”.

15.2.6 Application of EFHI

To demonstrate the EFHI, it was applied to a small hydropower installation (
174                                                                              R. van Treeck et al.

the effects of potential mitigation measures and modifications of plant components on the
hazard risk for fishes.
    The EFHI can also be used to compare risk variations of similar HPPs in response
to differences in sensitivity and conservation value of the ambient fish assemblages. For
example, if the same HPP characterized above is located in an European eel (Anguilla
anguilla) catchment hosting more sensitive fish species (e.g., trout Salmo trutta and nase
Chondrostoma nasus instead of minnow and spirlin), the higher conservation value of the
fish assemblage would substantially raise the final EFHI score to 0.68 “high risk”, even
though stream size and HPP components remain unchanged.
    The hazard components and final EFHI scores of the four scenarios outlined above are
displayed in Fig. 15.2.

15.3      Cumulative Impact Assessment

The larger the rivers are the more they become exposed to multiple pressures, which
might antagonistically or synergistically interact and result in cumulative impacts of pres-
sures. While a variety of pressures might create cumulative impacts, the following section
addresses only cumulative impacts of a series of barriers with or without hydropower
plants in a river. It aims to provide guidance that allows hydropower developers as well
as water managers to consider effects at a catchment scale, and thus maintain a high level

Fig. 15.2 EFHI scores of an exemplary small hydropower plant in default operation mode (yellow),
after improving fish safety (blue), after failure of the fish protection measures (brown) and assuming
a more sensitive ambient species community (purple)
15 Risk Assessment and Decision Making on Mitigation Measures 175
of environmental protection in line with the Water Framework and Habitats Directives.
The cumulative impact assessment (CIA) presented here provides valuable inputs that
need to be considered when a hydropower scheme is proposed and developed for con-
struction or retro-fitted to mitigate potential impacts. However, it is important to recognize
that generic models cannot be built for this purpose, because every scheme is different and
its contributions to power production will vary depending on river conditions and opera-
tional practices. Whilst offering generic guidelines for assessment of cumulative impact
of multiple hydropower schemes, CIA is limited in its assessment of risks and uncertainty
about the impact of individual schemes on fisheries and the environment, which must be
assessed using scheme-specific impact assessments and then used to understand the role
of individual schemes in a wider cumulative assessment. The CIA protocol is constructed
to support the Decision Support System for hydropower schemes that is presented in
Sect. 15.4 of this chapter.
The CIA approach considers all transversal barriers in a river system. Depending on
available migration facilities for fish, barriers form more or less significant migration
obstacles for fish, fragment habitats and populations. Barriers are also obstacles for flow
and sediment transport creating impoundments upstream with lower flow velocities and
higher sedimentation, which typically result in habitat loss for rheophilic, gravel spawn-
ing river fishes. Therefore, the CIA approach also considers the cumulative length of
impoundments in a river system, which corresponds to habitat loss for river fishes. It
must be noted that numerous eurytopic and stagnant water-preferring species will benefit
from impoundments. However, this benefit is not positively counted, because it does not
correspond to the type-specific fish community and thus to a good ecological status of
the river system according to the Water Framework Directive. Finally, some of the bar-
riers are used for hydroelectricity production. Here in addition to the other impacts also
fish mortality at hydropower plants might accumulate and is considered by the CIA. The
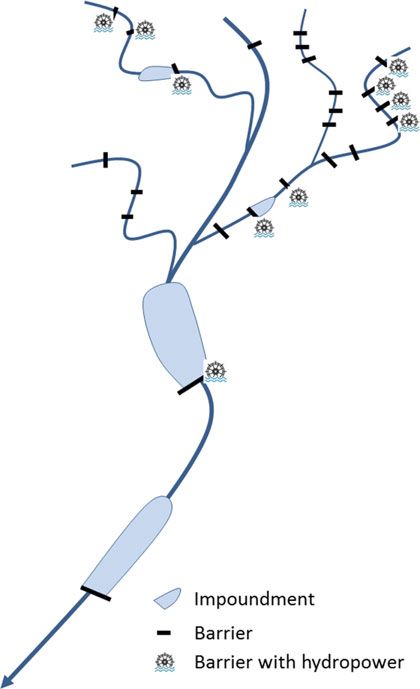
different spatial elements considered in the CIA approach are illustrated in Fig. 15.3.
From a fish-ecological perspective it has to be considered, that diadromous species—
these are species that obligatorily use marine and freshwater habitats during their life
cycle—essentially have to pass all obstacles between their marine and freshwater habitats.
Therefore, these species, e.g. European eel and Atlantic salmon, will experience the full
cumulative effects of all pressures. Potamodromous species are also obligatory migrants,
but they complete their life cycle only in freshwaters. Depending on habitat availability,
they might pass only a limited number of barriers that will exert cumulative impacts.
The majority of non-obligatory or facultative migrating species does not depend on reg-
ular migrations and might complete their life cycle even within river fragments depending
on habitat availability. However, all fishes show more or less extended exploratory move-
ments and homing behaviour, with larger fishes moving longer distances and using larger
home ranges (Radinger and Wolter 2014). Therefore, in particular the large-bodied species
face a higher encounter probability with barriers and hydropower plants, but they hardly
have to pass more than one barrier and thus will be least impacted by cumulative effects.176 R. van Treeck et al. Fig. 15.3 Elements of cumulative impact assessment: cumulative share of impoundments/habitat loss for river fishes, cumulative number of barri- ers/fragmentation/migration obstacles, and cumulative mortality at hydropower plants Independent of their migratory life history trait, all fish species will be affected by the cumulative length of impoundments that changes the hydromorphologic river character and by the fragmentation of habitats that increases with the number of barriers in a river system. 15.3.1 Cascades of Consecutive Impoundments Generally, the natural power potential of Europe’s watercourses is heavily utilized for energy production, particularly in alpine areas such as Norway, Austria, Switzerland or Southern Germany where topographical and hydrological conditions are most suitable. For example, the degree of hydropower development is already at a level of about 95, 90 and 70% in Switzerland, the Federal province Upper Austria and Bavaria, respectively (Jungwirth et al. 2003). At a global level, conservative estimates assume a total surface area of reservoirs of more than 400,000 km2 (source: internationalrivers.org), which does
15 Risk Assessment and Decision Making on Mitigation Measures                          177

not include habitat losses generated by smaller dams and weirs. As a result, 15% of
the global annual river runoff is stored in reservoirs (Likens 2010) and 48% of the global
river volume is moderately to severely impacted by flow regulation, fragmentation or both
(Schmutz and Moog 2018). Moreover, hydropower plants often occur in cascades creating
a series of impounding reservoirs in one stream and thereby cumulatively contributing to
the overall change of the hydraulic and habitat conditions of otherwise naturally free-
flowing ecosystems.
   Therefore, it is a main objective to quantify and assess the habitat loss caused by
the cumulative impoundment effects of multiple anthropogenic barriers (i.e. cascades of
dams and weirs) that alter the natural flow and habitat conditions of rivers with impacts
on the riverine fish community. This involves several methodological questions related to
the estimation/quantification of the spatial effects of impoundments (e.g. how large are
impoundments and how much habitat area is altered) as outlined below.

Delineating Impoundments
A rather obvious way to delineate river impoundments is their direct on-site measure-
ment in the field. While this might be considered time and resource consuming, it is very
accurate to map flow modifications on-site, i.e. to assess deviation from natural/reference
flow conditions and to determine the spatial extent of the impoundment in an upstream
direction, especially in smaller streams. For example, to facilitate the assessment of flow
modifications in Germany, the State Agency for Nature, Environment and Consumer Pro-
tection (LANUV) provided an overview of reference conditions of naturally flowing rivers
based on hydromorphological river typologies (Timm et al. 1999).
   Alternatively, the impoundment effect can also be roughly calculated from the dam
height and the natural stream slope. Therefore, the dam height, HD is simply divided by
the bottom slope S:

                                       x = HD/S

   For example, a 1 m high dam in a stream with a natural slope of 2 ‰ (0.002) creates
and impoundment of about 500 m length.

Impact Assessment of Habitat Loss Due to Impoundments
We consider the total sum of lengths of all impounded sections of a river relative to the
remaining free-flowing sections as the most decisive measure of the cumulative effect size
of impoundments. Therefore, the cumulative length of impoundments per river section is
divided by the total length of that river section. As a section, we consider the segment
of the river between two confluences, i.e. points where two rivers merge. This follows
the general principle of portioning streams into segments, which is also used in classi-
cal stream order concepts. This assures that relatively small impoundments of smaller
streams are not compared to the entire (potentially free-flowing) main stem which gen-
erally provides habitat for different fish communities. Vice versa, habitat losses due to
178 R. van Treeck et al.
impoundments in the main stem (or higher order rivers) should be addressed independent
of (potentially free-flowing) head water sections, to account for the fact that different parts
of the river along the longitudinal gradient are inhabited by different fish communities.
To provide an example, we followed the outlined approach to calculate the relative
length of all impoundments per river section (= cumulative length of impoundments of
river section i/total length of river section i) for all Austrian rivers. Similarly, we calcu-
lated the relative barrier density (= number of barriers of a river section i/total length
of river section I). Spatial data on impoundments, barriers and the watercourse were
obtained from the Water Information System Austria (WISA, https://maps.wisa.bmlrt.gv.
at/gewaesserbewirtschaftungsplan-2015). Vector maps indicate in-situ mapped impound-
ments. River sections were extracted as lines between two confluences. For the visual
analysis relative share of impoundments per river section as well as barrier density data
were grouped into classes of stream order ranging from headwater streams (classes 1–3)
to large lowland rivers (class 9, River Danube). The results show that the relative cumula-
tive share/length of impoundments is increasing with increasing stream order (Fig. 15.4)
while the barrier density is highest in low order streams and decreasing downstream. This
becomes especially evident for the River Danube (stream order = 9) where most river sec-
tions are already impounded and only a few free-flowing river sections remained, whereas
the number of barriers (i.e. barrier density) is comparably low. By comparison, sections of
lower order head water streams might have higher numbers of small weirs and thus many
impounded sections; however, these impoundments are usually rather short and there are
still many non-impounded river sections.
Fig. 15.4 Relative cumulative length of impoundments per river section and across stream orders
in Austria (data from Water Information System Austria). Left to right is the upstream–downstream
gradient. Points show relative cumulative impoundment length for single river sections. Violin plots
indicate density distribution for a given stream order class15 Risk Assessment and Decision Making on Mitigation Measures 179
15.3.2 Fragmentation Due to Multiple Barriers
In addition to the alteration of river habitats due to impoundments, hydropower and
their associated dams and weirs fragment river networks. Barriers represent one of the
largest anthropogenic impacts on river ecosystems and limit habitat connectivity at mul-
tiple spatial and temporal scales (Fuller et al. 2015). This might express in particular
in the impediment of ontogenetic migrations (e.g. spawning runs) and ordinary habitat
movements of river fish (e.g. Marschall et al. 2011; Radinger and Wolter 2015; Radinger
et al. 2018) and associated genetic fragmentation of populations (e.g. Gouskov et al.
2016). Recent studies emphasized that the location of a barrier within a river system and
especially its location relative to suitable habitats and species occurrences determines its
impact on fish (Kuemmerlen et al. 2016, Radinger and Wolter, 2015). Nevertheless, even
moderate densities of barriers might not be acceptable given the commonly high mobility
of river fish (Radinger and Wolter 2014). For example, Radinger et al. (2015) modelled
the occurrence patterns of riverine fish in response to hydromorphological variables and
in-stream structures and gained best modelling results when the conditions in a distance
of 1–4 kms up- and downstream of a site were considered, thus indicating potentially
extensive movements of fish within and between habitats.
Corresponding to previous studies (e.g. Van Looy et al. 2014), we consider the number
of barriers per river km (i.e. relative barrier density) a suitable and easily obtainable indi-
cator of the degree of fragmentation of a given river section. Analogous to the calculation
of the relative share of impoundments, we consider a river section as the segment of the
river between two confluences, i.e. points where two rivers merge. This assures that parts
of the river network with rather low densities of barriers, as common in low-gradient
streams and rivers, are not mixed with highly fragmented river network sections, as more
common in high gradient streams as illustrated in Fig. 15.5 for Austrian rivers.
Assessment of Habitat Loss and Fragmentation Due to Multiple
Cumulative Barriers
Based on the median values (half of the river sections per stream order), the cumula-
tive length of impoundments was rather low in low order river sections and increased
downstream (Fig. 15.4). This relation very well reflects the hydromorphic conditions of
predominantly Alpine and Prealpine river systems, with steep slopes resulting in low
impoundment length. However, the cumulative length of impoundments is a metric for
habitat loss only and does not allow conclusions on the severity of habitat fragmentation
and migration barriers. Inversely to the cumulative length of impoundments, the relative
number of barriers per river kilometre was high in low order river sections and decreased
in the downstream direction (Fig. 15.5).
These findings lead to a scoring of impacts and habitat loss resulting from impound-
ments and fragmentation due to barriers as shown in Table 15.2.180 R. van Treeck et al.
Fig. 15.5 Relative barrier density (number of barriers per km) per river section and across stream
orders in Austria (data from Water Information System Austria). Left to right is the upstream–down-
stream gradient. Single points show relative barrier density for a single river section. Violin plots
indicate the density distribution for a given stream order class
Table 15.2 Impact scoring of habitat loss due to relative cumulative impoundment lengths and
barrier density
Low impact Moderate impact High impact
% impounded length (relative to the total ≤10% >10–30% >30%
length of the river section)
Relative barrier density (barriers per km, 5 barriers/km
per river section)
Given that the highest hydromorphic and ecologic state of a river is free flowing with
functioning sediment generation, transport and sorting processes and a nearly undisturbed
riverine species community, a slight deviation might be 10% habitat loss. Therefore, habi-
tat losses up to 10% in total might be considered of low cumulative impact. Accordingly,
habitat losses of up to 30% in total in a river segment might be accepted as moderate
cumulative impact, while higher losses of habitats have a high impact on riverine species
communities. The high cumulative impacts from habitat losses in most segments in higher
order rivers corresponds well with the reported habitat degradation and deviation from
good ecological status according to the WFD.
Given the high mobility of riverine fish, a barrier every two kilometres or less (i.e.
0.5 relative barrier density) is considered moderate fragmentation impact. Barrier densi-
ties of five (=1 barrier every 200 m) clearly conflicts with the movement behaviour and15 Risk Assessment and Decision Making on Mitigation Measures 181 home range of most river fish (Radinger and Wolter 2014) and thus is considered a high fragmentation impact. 15.3.3 Cumulative Impacts—Diadromous Species Understanding and evaluating cumulative impact of multiple HPPs in a catchment context requires fitting the life history characteristics to a life cycle model of the target species. These vary for different migratory species groups and account for the impact of individual schemes on components of the population life cycle. Conceptual frameworks to assess the cumulative impact of multiple hydropower schemes are provided in Figs. 15.6 and 15.7 for anadromous and catadromous species, respectively. Each framework provides a starting point for assessment based on a count of the original adult population and follow this through the life cycle determining where the population will be impacted and by what proportion in addition to natural mortality. The anadromous framework starts with upstream migration passed the scheme (upstream barrier effect), opportunity for spawning and recruitment to the extant population based on habitat availability and finally losses caused by downstream migration through the suc- cessive hydropower schemes (Fig. 15.6). The catadromous framework (Fig. 15.7) starts with adults departing the river habitats and accounts for losses caused by downstream Fig. 15.6 Cumulative impact assessment for anadromous species—inputs and losses
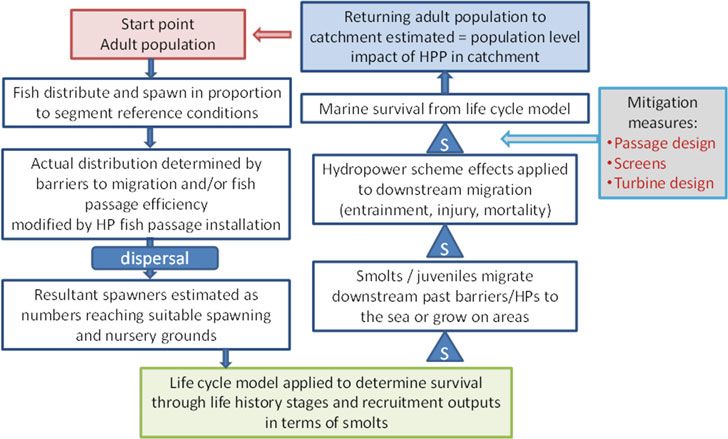
182                                                                      R. van Treeck et al.

Fig. 15.7 Cumulative impact assessment for catadromous species—inputs and losses

migration through the successive hydropower schemes and then the impact on return-
ing juvenile fishes dispersing in the target catchment following recruitment in the marine
environment.
   Each component of the life cycle can be modelled based on criteria specifically related
to each individual scheme or based on field surveys. Where such data are not available,
expert judgement or available information in the literature should be used to populate
the models. Key elements in these frameworks are assessing impediment to upstream
migration, loss of important habitat upstream of the hydropower installations and thus loss
of recruitment to the extant population and loss of fish during downstream migration as a
result of injury or mortality at the hydropower schemes or impacts of delayed migration.
Each of these parameters can be quantified and the additive effect can be determined to
understand the population impact of the cascade of hydropower schemes.

Barrier Passability
One of the key impacts of hydropower schemes is the disruption to connectivity caused by
the dam structure. All hydropower schemes create a barrier to hold back or divert water
to the turbine(s). The size of the barrier is highly variable depending on the design of the
scheme but needs to be accounted for. An example of the cumulative impact of multiple
barriers on a system is shown in Fig. 15.8. Here the impacts of seven barriers in succes-
sion on the population size of an upstream migrating species are compared with different
levels of fish passability. It can be clearly seen that the cumulative effects of compro-
mised passabilities < 0.5 (i.e. less than 50% of the approaching specimens successfully
passed) at the barriers result in extirpation of the population in the upstream areas. It is
thus essential to model the impact of variable passabilities at barriers to determine the
cumulative impact.
15 Risk Assessment and Decision Making on Mitigation Measures                               183

Fig. 15.8 Cumulative impact of multiple (seven) consecutive barriers of a given passability rate
(from 0.3 = 30% of approaching fish to 1 = 100%)

    A number of tools are available to assess barrier passability for fish (Kemp and
O’Hanley 2010). A coarse resolution rapid barrier assessment methodology that is suitable
for multiple fish species and considers both up and downstream dispersal was devised by
Kemp et al. (2005) and later in 2012, by the Scotland and Northern Ireland Forum for
Environment Research (SNIFFER). The assessment method uses rule-based criteria for
fish morphology, behaviour, swimming and leaping ability to estimate barrier passability.
The latter is the fraction of fish (in the range 0–1) that are able to successfully pass a
given barrier. Each barrier is assigned one of four passability levels as follows: 0 is a
complete barrier to movement; 0.3 is a high impact partial barrier, passable to a small
proportion of fish or passable only for short periods of time; 0.6 is a low impact partial
barrier, passable to a high proportion of fish or for long periods of time; and 1 is a fully
passable structure.

Downstream Migration
Once fish have spawned, adults of many species must migrate downstream, either to the
sea (anadromous species) or the lower reaches of the river (potamodromous species).
The juveniles of both migratory guilds will also ultimately migrate downstream to com-
plete their life cycles. In addition, adult catadromous species such as eel must eventually
migrate downstream to complete their life cycles. In European rivers downstream migrat-
ing fish mostly actively swim downstream and may pass the dam by one of several
corridors: downstream migration facility, turbine, water release over spillway or through
sluice gates. In addition, it should be recognised that some juvenile life stages of fish move
184 R. van Treeck et al.
downstream by drifting in the current. This mode of migration past hydropower structures
is dependent of the allocation of flows and with the majority water going through the tur-
bines, most juveniles will experience the trauma of high pressure and sheer and will
unlikely survive the experience.
As indicated, one route for downstream fish migration is passage through the turbine at
hydropower installations, which can be related to injury and mortality, caused by several
damage mechanisms as already outlined for the EFHI and in Chap. 4. Harrison et al.
(2019) posit that overall passage efficiency for diadromous fish populations using turbine
routes to pass hydropower dams in a downstream direction (DS Passage efficiency) can
be considered a product of the conditional probability of reservoir, forebay and turbine
entry, along with turbine passage survival, turbine passage exit survival, delayed survival
and sub-lethal effects. These effects are again cumulative and result in an almost complete
loss if downstream passage is low and mortality at the power station is high (Fig. 15.9),
which is often the case.
15.3.4 Cumulative Impacts—Potamodromous Species
Addressing cumulative impact for potamodromous species follows a similar approach
to diadromous species except that the species of concern only migrate within the river
system, either up and downstream including into tributaries or onto floodplain systems to
complete their life cycles. The schematic framework of cumulative impact assessment for
potamodromous species is shown in Fig. 15.10 and the models can be populated based on
information provided in the following sections on successive dam passage, home range
and mobility and migration distances.
Successive Dam Passage
Few studies have investigated the passage success of non-diadromous species over more
than one consecutive barrier in either an upstream or downstream direction.
Fig. 15.9 Scheme for
Mortality of 2% Mortality of 70%
cumulative downstream
START: 100% of all downstream
passage efficiency for different migrating fish
mortality rates Dam 1
98% 30%
Dam 2
96% 9%
Dam 3
94% 2.7%
Dam 4
92% 0.81%
Dam 5
90% 0.24%15 Risk Assessment and Decision Making on Mitigation Measures 185
Fig. 15.10 Cumulative impact assessment for potamodromous species—inputs and losses
In the Dutch lower Rivers Rhine and Meuse, De Leeuw and Winter (2008) studied
the movement of potamodromous fish species using transponders and a network of 29
detection stations. In total, 110 ide, 76 barbel, 51 chub and 8 nase were tagged, of them
57, 30, 15 and 4 specimens, respectively, were never detected during the study period
between February 2003 and June 2006. Passage over weirs was observed for very few
individuals only, as follows: of 2 approaching barbel 2 successfully passed the weir in
an upstream direction, as did 3 of 4 chub, 1 of 2 nase, and 6 of 30 ide. Passage success
in downstream direction was much less: 1 of 7 approaching barbel, 1 of 1 nase, 3 of 11
ide and not a single chub (De Leeuw and Winter 2008). The movement and passage over
consecutive weirs of these four potamodromous species has also been studied by Benitez
et al. (2018) in the Rivers Meuse and Ourthe in Belgium and by Lucas and Frear (1997)
in the River Nidd (UK). All studies were performed using active or passive telemetry
techniques and observed an average cumulative passage success of these species of 41%
at the first barrier and 10% at the second.
Based on the little data available, there is evidence that migration of potamodromous
cyprinids may fall to as low as 10% after bypassing two weirs. It has to be noted; however,
that there might be less individual motivation in potamodromous fish for migrating larger
distances compared with diadromous species, which also strongly depends on habitat
quality and availability in the river reach between barriers (Benitez et al. 2018). It still
remains challenging to identify the number of mobile specimens willing to pass longer
distances over several barriers. More research is needed to gather information.186 R. van Treeck et al.
Migration Distance
To understand how far potamodromous species potentially migrate within river systems,
empirical data on maximum migration distances have been compiled. They might serve as
proxy to assess the maximum number of barriers a potamodromous fish has to pass during
its life to complete its life cycle. The usual home range is typically much shorter. These
migration distances vary according to river length and do not indicate long- or short-
distance migrating as a kind of ecological trait of a species. Migrations have to cover the
distance to the—not necessarily nearest (compare Fredrich et al. 2003, for chub Squalius
cephalus)—spawning site or seasonal habitat. The spatial arrangement of river segments,
river reaches and habitats strongly depends on river size and length. Accordingly, migra-
tion distances correlate with river size measured for example as Strahler of Shreve order.
In larger rivers, the same species moves over significantly longer distances; therefore, river
size and study time emerged as significant predictors of movement distance (Radinger and
Wolter 2014).
Migration distances vary considerably within species depending upon individual moti-
vation (Table 15.3). Fish personality, as well as genetic factors, seasonality, and purpose
of the migration influence the distances covered (Brodersen et al. 2008; Brönmark et al.
2013). Resource migrations and diurnal and seasonal habitat shifts largely depend on the
home range size (Fredrich 2003) and are thus related to river size (Radinger and Wolter
2014).
Also, discharge was reported to affect the annual migration distances as well as the
intensity of spawning runs based on catch data for European sturgeons in the River
Rhine (Kinzelbach 1987) and Atlantic salmon in the River Elbe (Wolter 2015). Especially
in years with high floods, salmon were reportedly caught much further upstream than
commonly observed (Wolter 2015). Similarly, further migration distances and improved
passage of barriers must be assumed for potamodromous fish at higher discharges.
All potamodromous species are iteroparous, i.e. spawn several times during their repro-
ductive life, which means that repeated upstream and downstream migrations for spawning
are the rule. Typically, the downstream migration of the adults after spawning has no dis-
crete runs or migration peaks but spreads over a longer period. Examples of downstream
migration distances for potamodromous species are provided in Table 15.4.
Downstream migrations also take place when fish change sites to reach more pro-
ductive or more suitable feeding grounds. Displacement through high water conditions
or while searching for food may result in large scale downstream displacement. The
same mechanism is effective during drift of larval fish or the undirected outmigration of
juveniles. This movement is characterized by a non-uniform orientation towards the cur-
rent which largely contrasts with active movement with the flow that is observed during
adverse conditions (Lucas and Baras 2001).15 Risk Assessment and Decision Making on Mitigation Measures 187
Table 15.3 Empirical upstream migration distances of potamodromous and facultative migrating
species
Species Distance (km) River Method Reference
Potamodromous migrants
Aspius aspius 166 Elbe Telemetry Fredrich (2003)
Barbus barbus 22.7 Ourthe, Belgium Telemetry Ovidio et al.
(2007)
Barbus barbus 12.7 Ourthe, Belgium Telemetry Ovidio et al.
(2007)
Barbus barbus >25 Meuse, Belgium Telemetry De Leeuw and
Winter (2008)
Barbus barbus 2–20 Nidd/Ouse, Telemetry Lucas and
England Batley (1996)
Barbus barbus 20 Nidd, England Telemetry Lucas and
Frear (1997)
barbus barbus 34 Severn, England Mark-recapture Hunt and Jones
(1974)
Barbus barbus 318 Danube Mark-recapture Steinmann
et al. (1937)
Barbus barbus 2 Jihlava, Czech Mark-recapture Penaz et al.
Republic (2002)
Chondrostoma >25 Meuse, Belgium Telemetry De Leeuw and
nasus Winter (2008)
Chondrostoma 140 Danube Mark-recapture Steinmann
nasus et al. (1937)
Leuciscus 169 Danube Mark-recapture Steinmann
cephalus et al. (1937)
Leuciscus >25 Meuse, Belgium Telemetry De Leeuw and
cephalus Winter (2008)
Leuciscus 25 Spree Telemetry Fredrich et al.
cephalus (2003)
Leuciscus idus >45 Meuse, Belgium Telemetry De Leeuw and
Winter (2008)
Leuciscus idus 19 Elbe Telemetry Kulíšková et al.
(2009)
Leuciscus idus >100–187 Elbe Telemetry Winter and
Fredrich (2003)
Leuciscus idus 82 Danube Mark-recapture Steinmann
et al. (1937)
(continued)188 R. van Treeck et al.
Table 15.3 (continued)
Species Distance (km) River Method Reference
Leuciscus 0.03–0.7 Frome, England Telemetry Clough and
leuciscus Ladle (1997)
Leuciscus 9.5 Donau/Melk, Austria Mark-recapture Zitek and
Schmutz (2004)
Sander 326 Elbe Mark-recapture Faller and
lucioperca Schwevers
(2012)
Sander 122 Elbe Telemetry Nellen and
lucioperca Kausch (2002)15 Risk Assessment and Decision Making on Mitigation Measures 189
Table 15.4 Empirical downstream migration distances of potamodromous and facultative migrat-
ing
Species Distance (km) River Method Reference
Aspius aspius 166 Elbe Telemetry Fredrich (2003)
Aspius aspius 125–164 Elbe Telemetry Fredrich (2003)
Aspius aspius >100 Elbe Telemetry Fredrich (2003)
Aspius aspius 190 Elbe Telemetry Nellen and Kausch
(2002)
Barbus barbus 22.7 Ourthe, Belgium Telemetry Ovidio et al. (2007)
Barbus barbus 12.7 Ourthe, Belgium Telemetry Ovidio et al. (2007)
Barbus barbus 22 Severn, England Mark-recapture Hunt and Jones
(1974)
Barbus barbus 295 Danube Mark-recapture Steinmann et al.
(1937)
Barbus barbus 1.7 Jihlava, Czech Mark-recapture Penaz et al. (2002)
Republic
Chondrostoma 446 Danube Mark-recapture Steinmann et al.
nasus (1937)
Leuciscus 15 Spree Telemetry Fredrich et al.
cephalus (2003)
Leuciscus idus >200 Meuse, Belgium Telemetry De Leeuw and
Winter (2008)
Leuciscus idus 68–100 Elbe Telemetry Kulíšková et al.
(2009)
Leuciscus idus >100–187 Elbe Telemetry Winter and Fredrich
(2003)
Leuciscus idus 105 Danube Mark-recapture Steinmann et al.
(1937)
Leuciscus idus 150 Elbe Telemetry Fredrich (2000)
Leuciscus idus 100–165 Elbe Telemetry Nellen and Kausch
(2002)
Leuciscus 0.03–0.7 Frome, England Telemetry Clough and Ladle
leuciscus (1997)
Leuciscus 4.5 Frome, England Telemetry Clough et al. (1998)
leuciscus
Leuciscus 9.1 Frome, England Telemetry Clough and
leuciscus Beaumont (1998)
Lota Lota 68 Tanana, Alaska Telemetry Breeser et al. (1988)
(continued)190 R. van Treeck et al.
Table 15.4 (continued)
Species Distance (km) River Method Reference
Abramis brama 50 Danube Mark-recapture Steinmann et al.
(1937)
Esox lucius 14.4 River Rena, NO Telemetry Sandlund et al.
(2016)
Sander 35 Elbe Mark-recapture Faller and
lucioperca Schwevers (2012)
15.3.5 Managing Cumulative Effects
Cumulative impacts of transversal barriers on biota can be assessed even without partic-
ular information on the ecological status of riverine biota, solely based on the cumulative
fragmentation/barrier density and the cumulative length of impoundments relative to the
river length.
Both fragmentation and impoundments pose significant hydromorphic degradation
resulting in the deterioration of the ecological status or potential of a river. Based on
the significance thresholds suggested here (Table 15.2):
i. new projects have to demonstrate that they will not raise the total length of impound-
ment or fragmentation above the respective thresholds (30% impounded and 5
barriers/km, respectively). In conservation areas, the stronger low-impact-thresholds
should be applied (Table 15.4);
ii. barriers might be selected and prioritized for removal to drop the total impounded
river length below 30% or the number of barriers below 5/km, which will result in
significant habitat gain for riverine biota including also non-migratory and facultative
migrating fish species.
Cumulative impacts could be also assessed and managed only for selected species of
conservation concern, e.g. for eels or migratory salmonids. This is the most elaborated
application supported by predictable passage needs of diadromous species. Common man-
agement actions include implementation of upstream fish migration and downstream fish15 Risk Assessment and Decision Making on Mitigation Measures 191 protection facilities at barriers. The overall performance in mitigating cumulative impacts is determined by the efficiency of the individual facilities with the least performing ones causing the greatest bottlenecks. Therefore, the management of cumulative impacts is often reduced to identifying and mitigating the largest bottlenecks. New hydropower projects at existing barriers have to outline already in the application phase how they will improve up- and downstream fish passage and protection and to show that they will not worsen the overall situation and dilute the population of the target species. It must be noted that up- and downstream migration facilities can be effective for lampreys and fishes, but do neither enhance the hydromorphic quality of rivers and river processes nor other riverine biodiversity. The gold standard should be reducing the cumulative impacts of barriers on habitat quality and fragmentation below the outlined thresholds. Much of the cumulative impact assessment at hydropower schemes described pre- viously is based on the principle that the dam acts as barrier impeding upstream and downstream migration, modifies habitat quality up- and downstream to some degree and potentially causes mortality. In reality, these features vary between schemes depending on location, size, scale, infrastructure and hydrological and hydraulic characteristics of the installation. The precise information for each scheme cannot be accessed in a generic manner using models or similar tools, and must be collected for each hydropower scheme in a systematic manner. As such, cumulative impact assessment serves to determine the overall impact of existing barriers and hydropower schemes in a catchment. The procedure also allows to determine effects of mitigation measures. For example, if a fishpass is newly installed or retrofitted for more efficiency, the gain for fish protection can be estimated using the EFHI. Similarly, installing turbines that are less damaging to fish or more protective screens will mitigate downstream mortality of fish. Where a series of hydropower schemes are installed, the cumulative impact assessment framework enables analysis of which structure would provide the greatest response if specific mitigation measures will be applied. This can be linked to a cost–benefit analysis and the schemes can be prioritized according to the best return on investment. Overall the perspective of cumulative impacts of multiple hydropower schemes in the same catchment must be accounted for in the regional planning context and mitigation measures to minimise their impacts built into the catchment planning procedures as well as measures against the loss of other services as a result of the multiple schemes. The CIA framework provided here allows more informed decision-making and prioritisation.
192                                                                         R. van Treeck et al.

15.4     Decision Support Tool

15.4.1 Decision Making in Hydropower Development and Mitigation

The proliferation of hydropower development to meet obligations under the Renewable
Energy Directive has also seen the emergence of conflict between the hydropower devel-
opers and the fisheries and conservation sectors. The hydropower industry wants a joined
up response to their planned developments with sound guidance and robust decision-
making. On the other hand, the fisheries and conservation interests have concerns over the
impact that these schemes can have (especially the impact on WFD and Habitats Directive
status) and want to consistent and robust evaluation of proposed schemes. They need to be
reassured that the standards of design, construction and operation will provide adequate
protection of wildlife and biodiversity, and the ecosystem services that they provide. As
a result, there is a need to develop robust and transparent, evidence-based, support for
decision making that is easy for developers and regulators to use while enabling a high
level of appropriate environmental protection and mitigation.
    Like all development projects, planning a new hydropower proposal or refitting an
existing scheme involves consideration of a number of distinct stages within the project
life cycle (for example see the Hydropower Sustainability Assessment Protocol, IHA
2018). These stages move from the early stage screening of proposals and scoping of
options, to detailed project preparation, implementation, operation and scheme mainte-
nance. It is likely that this process also requires full Environmental Impact Assessment
(EIA) as part of the planning cycle, depending on the scale of the scheme and the nature
of the impacts identified in early stage screening. At each stage in the project cycle, there
are important development decision points that direct project planning and progression to
the next stage. Some of the critical decisions can be faced in the early stage of the project
life cycle. In the case of hydropower development, these decisions relate to the screening
of proposals to identify impacts and the scoping of appropriate and effective mitigation
requirements.
    It is this early stage screening that informs key decisions and acts to scope the require-
ments for both full EIA and detailed options appraisal for mitigation measure requirements
and design. Whilst guidelines exist for assessing the sustainability of hydropower schemes
or the need for retrofitting existing structures, they are often limited in their assessment of
risks and uncertainty about the impact of schemes on fisheries and the environment. Few
provide support for the decision-making process at each stage of evaluation. At each stage
of the process, decisions have to be made about the acceptability of the risks and uncer-
tainty of impacts of hydropower schemes, and the ability to manage those risks. Existing
decision frameworks and planning protocols (e.g. IHA 2018) provide valuable inputs into
key areas that need to be considered when a hydropower plant (HPP) or scheme is pro-
posed and developed for construction or retro-fitted to mitigate potential impacts. These
included:
15 Risk Assessment and Decision Making on Mitigation Measures 193
i. assessment of licensing requirements for permitting of hydropower plants (e.g.
permitting of abstractions and impoundments);
ii. assessment of ecological impacts, including fisheries and biodiversity;
iii. checking the ecological status of water bodies and the pressures already imposed
on fish populations/communities by obstructions and hydropower in River Basin
Management Plans
iv. identification of mitigation measures (especially fish passage) and steps to take in
either permitting of a new hydropower scheme or the re-fitting of an existing scheme
(including provisions on risk assessment);
v. consultation and determination (approval or rejection) of application/project plan.
Given this, a planning and decision support framework was developed in FIThydro and
was aligned to the principles of project management and EIA, providing a structured
early stage screening and scoping tool to support hydropower project planning in relation
to impacts on fish and their mitigation. This screening tool, based on a risk assess-
ment framework, is described here. The FIThydro Decision Support System (DSS) is
not meant to replace existing national frameworks or general assessment protocols like
the Hydropower Sustainability Assessment Protocol, but is intended to support these
frameworks and improve decision making in respect of mitigation for fish-specific issues.
15.4.2 FIThydro Decision Support System
The FIThydro DSS is a systematic screening and scoping assessment tool implemented
as open access, web-based system. The DSS aims to guide environmentally sustainable
hydropower production and promote safe fish passage and sustainable fish populations,
through the evidence-based planning, development and operation of existing and new
hydropower schemes, including the revision of permits. It was designed to draw on the
outputs and innovations from various tasks within the FIThydro project and in particular,
the tool was designed to integrate with this knowledge base implemented as FIThydro
wiki (Fig. 15.11).
The planning and decision framework developed within the FIThydro DSS provides a
systematic approach to decision-making regarding proposals for hydropower schemes and
mitigation of their impacts on fish populations. Integral to the decision support framework
are risk assessment procedures that aid the decision to proceed with a scheme, prioritise
which hazards require mitigation and to scope how the likely impacts of schemes could
be mitigated.
Here, we summarise the FIThydro decision support system workflow (Fig. 15.12)
which enables operators and regulators to develop structured proposals for new HPPs,
and to both, review and risk assess, those proposals whilst identifying appropriate mitiga-
tion measures to address the impact of both new and existing HPPs. The DSS frameworkYou can also read