Research Report 2009 - Centre National de Recherches ...
←
→
Page content transcription
If your browser does not render page correctly, please read the page content below
mm/h
                                                                            150
                                                                            100
                                                                            75
                                                                            50
                                                                            30
                                                                            20
                                                                            10
                                                                            5
                                                                            2
                                                                            1
                                                                            0,5

       Operational Arome   New Arome version in test   Radar observation

Research
Report
2009
Research
Report 2009
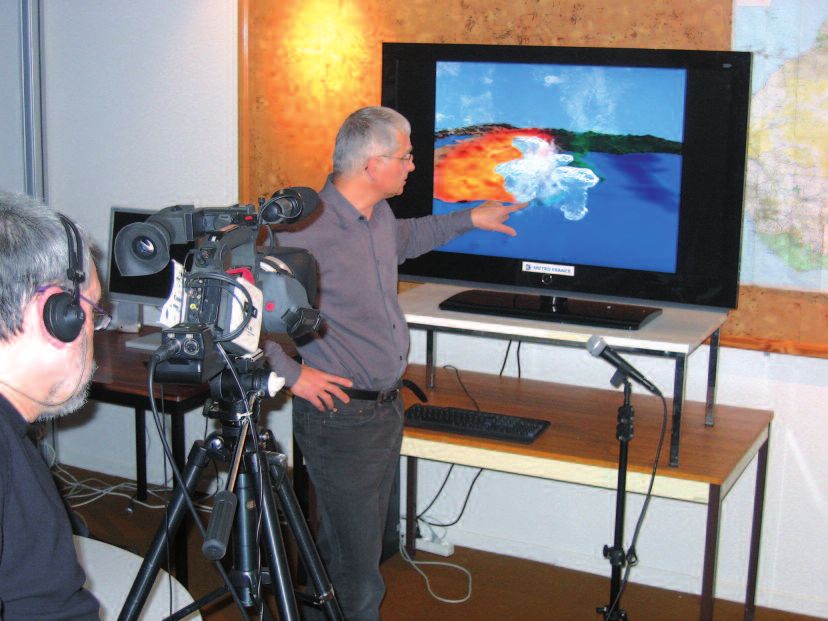
Table of contents
                 Foreword         page 4

     Weather forecasting models                page 6
           Synoptic numerical weather prediction
                     Data assimilation
                    Cyclone forecasting
                        Nowcasting

  Studies of meteorological process                page 16
              From the small to the large scale
                        Fog studies

Work around the AMMA programme                      page 22

 Climate and climate change studies                 page 26
                    Climate change studies
     Impacts of climate change and adaptation strategies

Atmosphere and environment studies                 page 36
                   Hydro-meteorology
       Oceanography (modelling and instrumentation)
           Atmospheric chemistry and air quality
            Avalanches and snow-cover studies

           Instrumentation             page 44
                   Aircraft instrumentation
        On-site instrumentation and remote sensing

  Coordination and communication                   page 50

                Appendix         page 54
When I became Director of Research in       configurations have been developed for
the spring of 2009, I found a Centre        our forecasting systems ARPEGE, ALADIN
National de Recherches Météorolo-           and AROME, which will ensure both opti-
giques quite different from the one I had   mal use of the new computing resources
left six years before. The Research envi-   and clear progress in forecast quality.
ronment in France is evolving fast:         The use of satellite data is advancing
Universities are the new places of power,   fast. The cooperation of Météo-France
the “Agence Nationale pour la Recherche”    with CNES, EUMETSAT and ESA has never
has been introduced as the main funding     been so intense. We are engaged in
mechanism and, generally speaking,          Earth Observation projects such as IASI,
support can be obtained from multiple       SMOS, AEOLUS, CoreH2O, PREMIER,
sources for research on adaptation to       POGEQA, and several Satellite Appli-
Climate Change. There are also urgent       cation Facilities. In the field of Climate, a
requirements from the aeronautical and      new version of our Earth-System model
Defence sectors, and these require-         has been prepared to guarantee our
ments drive the research agenda to          contributions to the upcoming 5th IPCC
some extent. As far as laboratories are     report. Consultations with IPSL have
concerned, we now have three joint units    started to share a larger part of the Earth
with CNRS (CNRM-GAME, SAFIRE, and           System modelling infrastructure. Re-
LACy). The first one has reached a res-     search has largely contributed to the gro-
pectable size and now includes a            wing offer of Météo-France regarding
“Laboratory Committee”. A description       adaptation to Climate Change. We are
of the research process has also been       engaged in many projects with users in
introduced into the Météo-France quality    the fields of hydrology, town planning,
management system.                          and agriculture. The exploitation of the
Clearly, our modern society demands         observations collected during the inter-
much of meteorological research. It also    national AMMA programme is currently
offers new opportunities, but these tend    delivering many publications, and an
to come randomly. We need strict wor-       international conference held in Oua-
king methods in order to keep essential     gadougou last July attracted 500 scien-
strategic directions in our world of        tists representing many nations and
contracts and deliverables. I would like    disciplines. Finally the preparation of the
to take the opportunity to thank my pre-    HYMEX programme on the water budget
decessors, Daniel Cariolle and Eric Brun,   and intense rainfall over the Mediter-
for having developed a robust governing     ranean area and its integration in the
structure that allows Météo-France          larger work on the habitability of the
research to be steered safely.              Mediterranean Basin has made regular
The results of 2009 are a clear testimony   progress.
to the excellence of their work: in
Numerical Weather Prediction, new

           4 . Research Report 2009
© Camille Luxen

Philippe Bougeault, Director of Research at Meteo-France,
speaking live from Toulouse Meteopole for France 3 TV
during the Researchers’ night 2009, on September 25th.

                                                            Research Report 2009   .5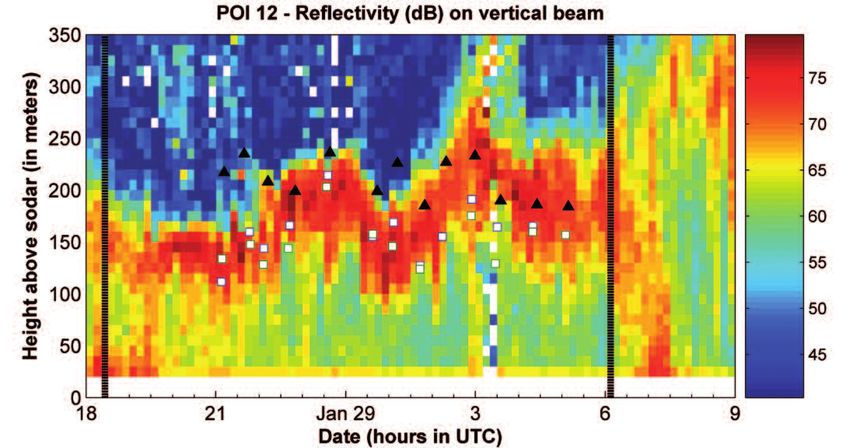
Weather forecasting
                             models
The research on numerical weather prediction aims to produce better weather forecasts and also new tools, thanks to numerical atmospheric
modelling systems, with configurations that can be adapted to several applications: global scale ARPEGE, ALADIN and AROME for local/
regional fine predictions, and an ENSEMBLE prediction system of assimilation and prediction for probabilistic forecasts.
In 2009, the physics parametrization of the global model ARPEGE was updated with the introduction of a prognostic turbulence scheme, a new
representation of shallow convection and the introduction of ocean/atmosphere interactions, which greatly improved the modelling of the
lower layers. Some progress has been made regarding the use of satellite radiances by a better assimilation of Metop/IASI and Aqua/AIRS data
through research on cloudy radiances. All this work has largely helped to improve the ARPEGE forecasts, as verified by forecast scores and by
studies of the 24th January 2009 storm. It was also of some benefit to ALADIN and AROME, which, moreover, have been given a new local sur-
face assimilation scheme (surface soil and sea level temperature).
The next step was to adapt software to the new, more powerful NEC SX9 supercomputer. This led to an increased resolution of numerical sys-
tems as well as new scientific improvements such as the assimilation of radar reflectivity in AROME using an original technique of Bayesian
inversion of precipitation observations, which makes Météo-France one of the leading centres in the world for radar assimilation. Some impro-
vements have been achieved concerning wind gust products, which are essential during storms, and satellite image simulations. These new
versions of ARPEGE, ALADIN and AROME will be operational in early 2010.
At the same time, the ensemble prediction system is making headway so as to give the best short range probabilistic information possible over
mainland France.

                                                                                    1

                                                                                                                                                                     1

 AROME local adaptation of the preoperational ARPEGE predicted situation of 16th September 2009 at 6:00UTC for a 30h forecast, total 1-hour surface precipitation (mm) and
instant cloudiness (grey shades for low, medium and high cover).

Upstream numerical prediction research focuses on several scientific topics such as: (1) data assimilation techniques with an emphasis on the
modelling of error structures, (2) studies of storms and heavy precipitation events in relation with large scale atmospheric dynamics, (3) grea-
ter use of satellite data in cloudy and/or rainy conditions over land, and (4) increased efficiency of high resolution models. These fields of
research are advancing in collaboration with the French and international scientific community and are part of worldwide research projects
involving many labs and agencies, such as Hymex, AMMA, Concordiasi, Thorpex-Tnawdex, SESAR, and the Seventh Framework Programme, and
are in line with the requirements of the Ministry of Defence.
This research work is complemented by cooperation within Europe, with the ECMWF, ALADIN and HIRLAM communities, and allows the concer-
ted development of numerical prediction on a shared basis.

                                                                         6 . Research Report 2009
Synoptic numerical weather prediction

                                          New pre-operational versions
                                        of the ARPEGE and AROME models
The extension of the supercomputer                benefits from evolutions in the ensemble                      milation of these observations. The vertical
(NEC/SX9) has permitted a major evolution of      assimilation, in particular the use of the 4D-                resolution of the AROME model has been
the ARPEGE and AROME models used for ope-         Var algorithm. The spatial resolution of the                  increased, in particular in the planetary boun-
rational weather forecasting at Météo-France.     ARPEGE model has been increased with the                      dary layer, with nearly twice the previous
The initialization of the global model,           use of 70 vertical levels and a horizontal                    number of vertical levels. The new AROME
ARPEGE, which is based on the 4D-VAR assi-        mesh varying from 10 km over France to                        release is built with 27 levels in the first
milation, significantly improved with the         60 km at the antipodes. This configuration                    3 000 metres. The representation of physical
increase in the resolution of the analysis        allows direct coupling with the meso-scale                    processes is improved for the calculation of
increments (60 km instead of 90 km) and in        model AROME and simplifies the operational                    the convective updraft in the shallow convec-
the horizontal density of the assimilated         suite and its use by the forecasters.                         tion scheme and by taking into account the
satellite observations, and with the assimila-    The radar reflectivities of the French ARAMIS                 sedimentation of cloud droplets, which are
tion of new IASI (water vapour and surface)       network are assimilated in the AROME 3D-Var                   important for simulating fog.
and AMSU-B (low troposphere humidity over         analysis. This has been made possible
land) channels. The characterization of the       thanks to many development and research                                             2
background and observation error statistics       activities on the pre-processing and the assi-

                                        Surface precipitation cumulated over 1 hour (in mm) and low, medium and high
                                 2      instantaneous cloudiness (grey colours) for a 30h forecast valid on 16th September 2009
                                        at 6 UTC made with the pre-operational version of the ARPEGE model.

                                                                  Research Report 2009   .7
Towards operational                                Estimating forecast                                 Toward an operational
use of the Aladin model                             uncertainties: PEARP,                                 probabilistic forecast
   for overseas areas                              the Météo-France state                                        suite
                                                     of the art ensemble
Météo-France is planning to implement
regional NWP systems for its overseas domi-                forecast                                    The PREVIPROB project was initiated in early
                                                                                                       2009 for a period of three years. It aims to
nions. The target configuration is an Aladin                                                           install a suite of probabilistic forecasts from
3DVAR assimilation, very similar to the           PEARP (for Prévision d’Ensemble ARPEGE) is           the short to the medium range. In order to
one used for Réunion Island. Thus, New            Météo-France’s global and mesoscale en-              achieve this objective, tools will be develo-
Caledonia, Polynesia, and the West Indies         semble prediction system for Europe. This            ped for ensemble prediction systems.
and French Guyana will be able to take advan-     ensemble is especially tuned for short range         Firstly, coupling applications (hydrological
tage of Aladin outputs with 8 km resolution       predictions.                                         model, surges model, marine or environ-
and 70 vertical levels for the short-term fore-   In 2009, significant changes were implemen-          mental pollution tracking, etc.) will be imple-
casts over their areas.                           ted and tested within PEARP. They aimed to           mented on ensemble prediction systems,
In 2009, tests were performed with a dynamic      better quantify the sources of uncertainty           including PEARP, developed and maintained
adaptation from “70-level Arpège”. They allo-     inherent in any weather forecast. PEARP will         by CNRM. It will then be possible to produce
wed the model domains for the Pacific to be       be coupled with the Météo-France ensemble            probabilistic forecasts for the detection and
carefully selected. They validated the use of     assimilation system in order to better esti-         monitoring of specific risks (floods, forest
the surface scheme SURFEX and demonstra-          mate the initial uncertainty. Moreover, using        fires, pollution) by modelling the uncertain-
ted the improvements for the tropics due to       several different physical packages will allow       ties associated with these forecasts.
the new physical parameterizations, which         a kind of model error to be represented.             Secondly, post-processing will provide opti-
have been operational in our models since         Finally, a significant increase in the size of the   mal forecast probability density functions for
February 2009. The figure shows a forecast of     ensemble (from 11 to 35 members) should              both ensemble prediction systems and sin-
heavy rain over the New Caledonia area.           improve forecasting of relatively infrequent         gle models. This post-processing is based on
Given the performance of global models in         events. A first evaluation shows that these          statistical techniques using probability laws
the tropics, IFS, with its resolution of around   modifications have a positive impact in terms        tailored to each parameter (normal distribu-
16 km since the beginning of 2010, has been       of all the probabilistic scores computed so          tion for temperature, gamma distribution for
chosen as the coupling system. The use of         far.                                                 rainfall, Weibull distribution for wind speed).
IFS will require asynchronous coupling be-        This new version of PEARP was brought into           Finally, studies oriented towards aid in deci-
cause of production time constraints. The         operation in December 2009 and will be tes-          sion-making will use probabilistic forecasts
coupling of the surface will be still done with   ted by French forecasters during the following       to analyze the needs of the end-user by cost
Arpège.                                           winter. Other evolutions, such as an increase        and loss models.
The implementation of data assimilation in        in the horizontal resolution from 15 to 10 km        The project involves the development of vi-
the overseas Aladin configurations will           over France, are expected in 2010. PEARP             sualization products, a methodology for using
require the installation of a simplified proce-   and EPS from ECMWF are the main sources of           probabilistic forecasts, checks and training
dure in order to define customised configu-       information about the uncertainties of short-        and will finally lead to the implementation of
rations. For each area, the background            and medium-range weather forecasts, whose            a probabilistic forecasts suite.
covariance error matrix will have to be calcu-    more extensive use is the main objective of
lated. The aim is to automate this calcula-       the PREVIPROB project.                                                     5
tion, which is necessary for the 3DVAR
assimilation.                                                             4
Evaluation of Aladin overseas models cou-
pled with IFS and including assimilation
should begin during spring 2010 and the
operational implementation is planned for
early 2011.

                      3

                                                               8 . Research Report 2009
3

            6 hours of cumulated precipitation of an Aladin
                        24-hour forecast on June 21st 2009
                          over the New-Caledonia domain.


Case of January 24th, 2009. We are focusing on strong wind gusts for the beginning of the afternoon. The left panel presents probabilities of gusts
exceeding the 120 km/h threshold in operational PEARP. The right panel presents the same parameter for the new version of PEARP that is described                                                                  4
in the main text. The new version provides a better prediction of the event with higher frequencies that are better located.

                                                                                                      1,0                                                                               1,0
                                                               5
                                                                                                      0,8                                                                               0,8
                                                                           Density of probabilities

                                                                                                                                                             Density of probabilities

                                                                                                     0,6                                                                               0,6
                    Discrete and continuous probability density function
                  for forecast precipitation. Forecast on 09/02/2006 at                               0,4                                                                               0,4
                 12:00 for Bordeaux, step 48h (non-precipitation case)
                      on the left. Forecast on 01/03/2006 at 12:00 for                                0,2                                                                               0,2
                   Bordeaux, step 48h (precipitation case) on the right.
                                                                                                      0,0                                                                               0,0
                                                                                                            0        2       4        6       8         10                                    0        2       4        6       8         10
                                                                                                                6 hours cumulated precipitations (mm)                                             6 hours cumulated precipitations (mm)

                                                                                          Research Report 2009               .9
Data assimilation
Implementation of an ensemble Impact of hyperspectral
4D-Var assimilation infrared sounders
in Numerical Weather
Data assimilation is based on a statistical
characterization of forecast errors. The expec-
The superiority of the ensemble 4D assimila-
tion has been confirmed by comparisons with Prediction
ted amplitudes of these errors (described by departures between forecasts and observa-
variances), which depend on the weather tions, and by studies of the impact of IASI and AIRS, respectively onboard the
situation, need to be specified. variances provided by the ensemble on the European MetOp and the US Aqua polar orbi-
In this context, an ensemble using six pertur- forecast quality. The associated increase in ting satellites, are hyperspectral infrared
bed assimilations is running operationally. computation cost is moderate, and compati- sounders which provide thousands of chan-
The spread of such an ensemble allows the ble with the ongoing computation power nels in each profile. They have been in opera-
space and time dynamics of forecast errors to increase. tional use in the global model ARPEGE and
be estimated. Moreover, a 4D version of this It is planned to extend the use of departures the limited-area model ALADIN since 2006 for
ensemble assimilation is being tested and between forecasts and observations to esti- AIRS and 2008 for IASI.
should simulate errors of the 4D-Var system mate the contributions of model errors (to be As infrared spectra are affected by the pre-
better. distinguished from errors induced by initial sence of clouds, their detection and characte-
This is illustrated by figures a and b, which conditions). This will enable this error compo- rization are of prime importance. Firstly, only
correspond to a severe storm case over nent, which is poorly known at present, to be clear channels were assimilated. To take the
France on 24th January 2009. The geographi- estimated objectively. cloud effects into account, an algorithm is
cal distribution of variances is more realistic used to retrieve a cloud-top pressure and an
in the 4D version (figure a) than in the 3D ver- 6 effective emissivity in each pixel, which are
sion (figure b), with a maximum that is more then fed into the system to assimilate cloud-
pronounced and better located over France, affected channels. This has been evaluated
in accordance with the strong uncertainty for AIRS spectra and led to an increase in the
associated with this kind of intense weather amount of data used and also to a positive
system. impact on forecasts. Similar developments
are in progress for IASI.
In the global model, ARPEGE, assimilating 4
times more data, from 1 every 250 km in ope-
rations to 1 every 125 km, has shown a posi-
tive impact on forecasts for all variables (e.g.
the wind or the geopotential) and at all
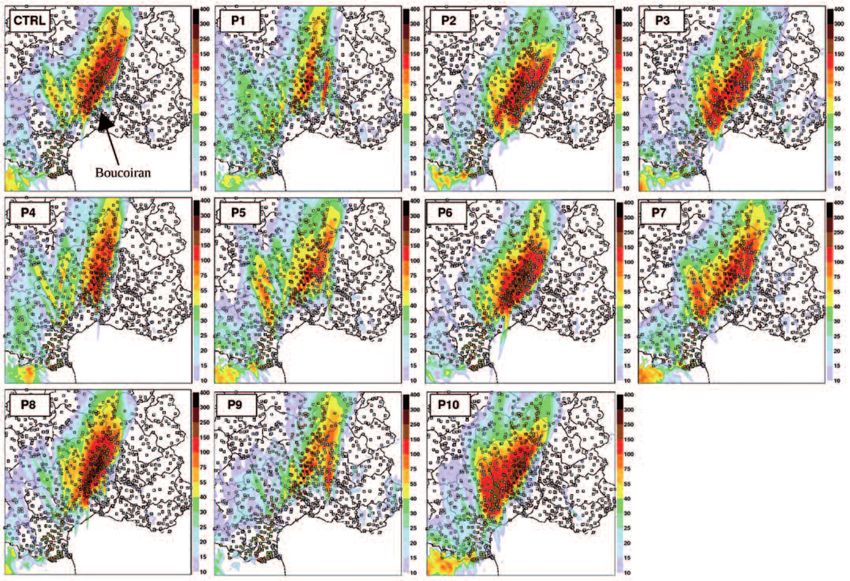
Assimilation of radar reflectivities ranges, and especially in the Southern
in the AROME model Hemisphere. IASI and AIRS data have also
been assimilated at high density in the
convective scale model AROME. Despite
Through studies of precipitating systems, the winds and reflectivities). The data from the 24 rather poor temporal coverage of the domain,
assimilation of the volume radar reflectivities radars of the network will be assimilated but they had a positive impact for upper air and
from the national ARAMIS network into the neither the very low reflectivities from the surface fields in all time ranges up to 30h.
AROME model has given a better description lower troposphere (echoes which may be uni- The prediction of precipitation, which is a key
of qualitative and quantitative precipitation dentified anomalous beam propagation) nor point for AROME, has also been improved.
short-term forecasts, especially for cases of the lowest elevations affected by high values The next steps will mainly consist of characte-
good vertical sampling of the atmosphere. of topographical beam blockage will be assi- rizing land surface properties to enhance the
Relative humidity profiles from radar reflecti- milated. assimilation of infrared sounders over land
vities are firstly retrieved and then assimila- Daily evaluations of this assimilation have for all models.
ted. The method has the main advantage of shown positive results in a pre-operational
using vertical information provided by the context. In particular, a positive impact has 8
volume radars that are the most useful. As been found for very-short-range precipitation
both rainy and non-rainy observations are forecast scores. Fig. b shows positive scores
used, either precipitations are produced or for 6-hour accumulated precipitation fore-
the model dries. Figure a shows the impact of casts against rain gauges, for between 3-hour
assimilating reflectivities from high altitudes and 9-hour forecasts, when the reflectivities
(rain does not reach the ground) on a relative are assimilated (REFL) against CTRL (reflectivi-
humidity analysis. The propagation of the ties are not used). Improvement is also obser-
information is consistent with the observed ved in forecast scores for other parameters
spatial scales. Since the end of 2008, the (such as wind) over long periods.
reflectivity assimilation has been systemati-
cally evaluated by means of a radar product 7
optimized for the Arome model (Doppler
10 . Research Report 2009a b
Maps of standard deviations of forecast errors of zonal wind (unit: ms-1) around 500 hPa on 24th January 2009 estimated with two different
6 versions of ensemble assimilation. (a): standard deviations given by an ensemble 4D assimilation; (b): standard deviations given by an ensemble
3D assimilation.
b) Equitable Threat Score
1,0 20
Nombre de réseaux (nobs > 30)
0,8 REFLEX 15
CTRL
0,6
ETS
10
0,4
0,2 5
0,0 0
0,1 0,5 1 2 5 10 15 20
Seuil (mm/h)
Probability of detection
1,0 20
Nombre de réseaux (nobs > 30)
0,8 REFLEX 15
CTRL
a - Left, vertical cross-section (corresponding to the dashed line 0,6
POD
10
on the radar composite map right) from a relative humidity difference between 0,4
an experiment with assimilation of radar reflectivities and an experiment 0,2 5
in which reflectivity was not assimilated. 0,0 0
0,1 0,5 1 2 5 10 15 20
Seuil (mm/h)
False Alarm Rate
1,0 20
Nombre de réseaux (nobs > 30)
b - From top to bottom, averages of Equitable Threat Scores (ETS), 0,8 15
Probability of detection (POD) and False Alarm Rate (FAR) for 6-hour 0,6
FAR
10
precipitation forecasts against rain gauges, between 3-h and 9h forecasts 0,4
(at 00 and 12 UTC from 15 April to 23 April 2009 00h), versus threshold 5
0,2
(mm/h) for CTRL (green line) and REFL (black dashed line).
The thin dashed line represents the number of forecasts taken into 0,0 0
0,1 0,5 1 2 5 10 15 20
account in the calculations, i.e. for which the number of observations Seuil (mm/h)
7 above the threshold exceeds 30.
12h precipitation accumulation as forecast by AROME with no assimilation of AIRS or IASI data (a),
and with assimilation of AIRS & IASI data (b),
8 to be compared with rain gauge measurements (c),
for the period between 00 and 12 UTC on 21st May 2009.
a b c
Research Report 2009 . 11Validation of the humidity profiles retrieved with IASI
from the Jaivex campaign
The fluctuations of humidity profiles are at satellite and broadcast on the GTS (case B), Experiments B and C significantly improve
present poorly evaluated through the assimi- and from a subset of 1700 channels sensitive the retrieved profile and the contribution of
lation of satellite data. The JAIVEX campaign, to temperature and to water vapour only IASI in the inversion.
which took place during the validation phase (case C). The improvement in the retrieved This work will continue with the treatment of
of the METOP satellite, provided a high- profiles can be assessed by the better cohe- cases over land and by increasing the num-
quality set of IASI observations co-registered rence with the profile of the dropsonde, the ber of vertical pressure levels.
with several dropsondes. observed residuals – calculated smaller on
The marine clear situations (25 observations) the whole spectrum, a larger contribution of 9
enabled the retrieval of humidity profiles to information coming from IASI in the retrieval
be improved. We set the 178 channels used and a finer vertical resolution.
by ECMWF as the reference (case A in the The figure shows results for a clear situation
figure), together with their two matrices of close to a cloud layer (29/04/2007). The
errors of observations and background. We strong fluctuation in humidity is very badly
estimated the impact of a more accurate represented by the forecast. The reference
matrix of observation errors and a dynamic conditions do not allow the forecast to be left:
selection of 150 channels from the set of 366 the fluctuations are not retrieved by the inver-
channels selected before the launch of the sion and little information comes from IASI.
300
9 A
C
B
Profiles of IASI Contribution / Bg
400
500
600
700
800
900
1000
0,0 0,2 0,4 0,0 0,2 0,4 0,0 0,2 0,4
300
A B C
BG BG BG
400 ANA ANA ANA
RET RET RET
Humidity profiles
500
DROP DROP DROP
600
700
800
900
1000
0 5 10 15 0 5 10 15 0 5 10 15
q (g/kg) q (g/kg) q (g/kg)
Part of the information provided by IASI (upper figures) with regard to forecast onto the pressure levels of RTTOV and corresponding humidity profiles (bottom figures). The black
curve shows the profile of the dropsonde, the continuous curves the profiles retrieved from 2 IASI spots at 14km (red) and 26km (blue) and 10 minutes from the dropsonde launch.
The fine dotted curve corresponds to the forecast (1Dvar initialization) and the bold dotted curve shows the closest analysis.
12 . Research Report 2009Cyclone forecasting
Analysis of the interaction
of tropical cyclone Ivan (2008) with the ocean
Tropical cyclones extract most of their energy columns. It may be observed that the cyclone
from the upper layers of the ocean. Cyclone was less intensified by the coupled simula-
intensification is only possible if the surface tion than by the forced one, which overrated
temperature of the ocean is higher than 26°C the intensification level. A more detailed
to at least 30 feet below the surface. Firstly, study analysed the physical processes res-
cyclone winds extract energy from the ocean ponsible for the differences between the two b
through surface fluxes and this, in turn, simulations. b - evolution
intensifies the cyclone winds. However, they In the future, this type of coupled models will of the intensity of Ivan
also generate some dynamic effects on the be implemented for the operational predic- (maximum wind at 10m)
upper layers of the ocean, which may modify tion of tropical cyclones. analysed (reference in black),
the sea surface temperature (SST). Thus, by the forced simulation
the interactions are particularly complex. 10 (green) and by the coupled
Moreover, a better understanding of the simulation (purple).
mechanisms between cyclones and the a
ocean is crucial to the improvement of
cyclone intensity forecasts.
The figure below shows the study of tropical
cyclone Ivan (South-West Indian Ocean,
2008) and its interactions with the ocean as
10
it moves from a region of cool SST to warm
SST. Two simulations from times t=0 and
t=96h were conducted with the high-resolu- a - track of the cyclone Ivan between
tion Meso-NH model. The first simulation (for- the two times of the simulations
ced) had a fixed SST field at the surface. The (t=0 and t=96h), on a map showing
second simulation (coupled) allowed the SST the initial sea surface temperature.
to evolve with time through a coupling of
Meso-NH with an oceanic model that was
able to simulate the evolution of water
Skill of the Aladin-Reunion model on the case of tropical cyclone Gael (2009)
Aladin-Reunion is a limited-area model that However, other models foresaw this inward The model will continue to evolve with an
covers the South-West Indian Ocean with a movement either closer to Madagascar or as increase in horizontal (8 km) and vertical
10-km grid mesh. This operational model is a straight track. However, in terms of intensity resolution soon.
continually being adapted to improve the forecasts, Aladin-Reunion generated too
forecasting of the tracks and the intensities of great a deepening of the cyclone. 11
tropical cyclones.
In 2009, some of the physical parametriza-
tions of Aladin-Reunion were modified, with, 11
in particular, the use of a new parametriza-
tion of the air-sea fluxes. The main interest of
this model is its ability to correctly represent
the structure of cyclones, which global
models cannot do. In terms of track predic-
tion, its skills are reasonably good, and
sometimes excellent. Thus, in February 2009,
the tropical cyclone Gael passed 400 km
North of Réunion Island before swerving
southward round the island. All the Aladin-
Reunion forecasts from 4th February onward
(see figure) show this swerve and the forecas-
ted tracks are very close to the real track.
Tracks of Gael: analysed (black),
and forecast by several simulations of Aladin-Reunion
at different initial times (one colour per initial time).
Research Report 2009 . 13Nowcasting
The ARISP project Characterization Detection and tracking
The Airports of Paris (ADP) and Météo-
of the cloud cover of storm cells
France’s Paris Office of Studies and from satellite imagery in the service
Climatology (BEC) have agreed on the neces-
sity to develop a new runway temperature in the SAFNWC of aviation
forecasting system, called ARISP (AROME-
ISBA-Piste). The basic principle of such a The Satellite Application Facility in support The FLYSAFE project has defined and tested a
model is not new for Météo-France: a meteo- of Nowcasting (SAFNWC) is part of the weather information system contributing to
rological model (ARPEGE), interpolated both EUMETSAT ground segment. It provides users the flight safety of all aircraft. This system
spatially and temporally by means of with a software package for extracting pro- gives real-time information to pilots about
appropriate software (SAFRAN), provides ducts useful for nowcasting purposes from the position and the trend of the following
meteorological inputs for the Interface-Sol- the MSG-SEVIRI derived products. The part of weather hazards: thunderstorms, icing and
Biosphère-Atmosphère (ISBA) model which, the software dedicated to cloud product turbulence in clear sky conditions.
knowing both the atmospheric forcings and retrieval (cloud types, cloud top height) was The thunderstorm hazard system was develo-
the physical properties of the ground column developed in 2009. ped jointly by Météo-France and the German
below, is able to compute the evolution of Many improvements have been made. The Aerospace Centre. The underlying idea is to
its temperature and humidity profiles. This major change concerns low level clouds. The complement the thunderstorm description
scheme is used operationally by SIR (SAFRAN- twilight detection of fog or low stratus has from the onboard radar by adding ground
ISBA-ROUTE), a road temperature forecasting been greatly improved using a combination weather information. In order to reduce the
system. of temporal analysis and image processing data flow and to facilitate the integration of
A new feature in the system currently being techniques. Furthermore, low stratus clouds hazards into onboard systems, the thunder-
developed by BEC is the use of forecast para- can easily be mistaken for mid-level clouds; storm representation has been simplified so
meters from the new operational model this confusion has been reduced by the use that the pilots and/or the onboard data
AROME instead of from SAFRAN. The fine of the 8.7µm infrared channel. This visualisa- fusion process receive the minimum useful
mesh of AROME (horizontal resolution: tion is especially important to forecasters information. The thunderstorm hazard is
2.5 km) is expected to serve this fine scale but also for automatic applications using depicted by two volumes. The first volume is
application better. Moreover, the original SAFNWC cloud types, such as fog risk map- defined by the radar imagery and gives a pic-
microphysics of AROME and its ability to ping, or SEVIRI radiance assimilation in the ture of risk of heavy rain, hail and lightning.
represent realistic clouds improve its fore- fine mesh model AROME. Additionally, the The second volume is defined by the satellite
casts of infra-red and visible radiation, and use of the High Resolution Visible (HRV) imagery. It particularly characterizes the top
these ingredients of radiative transfer are a channel has led to improved daytime identifi- of systems, including the risk of severe turbu-
major component of the soil temperature. cation of sub-pixel cumulus clouds. lence for commercial aviation.
Preliminary results comparing ARISP and SIR Although the SAFNWC/MSG software was The weather information system for thunder-
for a winter’s day cycle are shown in the designed for MSG SEVIRI data applications, storm hazards has been tested in a flight
figure on the next page. Météo-France, LMD and ICARE have adapted simulator configuration but also in flight
Other features are also being added, such as it to retrieve cloud products from other geos- conditions by two research aircraft. The com-
original ISBA tuning (individualized for each tationary satellite imagery (GOES 10-11-12, plementary nature of ground information and
runway profile) and the use of meteorological MTSAT-1). The modified software is now ope- airborne radar data has been confirmed, in
observations to initialize the forecasts. rational at the ICARE centre to support to the particular by completing the convective infor-
The first tests of this system will take place Megha-Tropique mission. mation outside the angular coverage of the
during winter 2009-2010 for Roissy Charles- airborne radar and also in cases of beam atte-
De-Gaulle airport and during the following 13 nuation by heavy rain. The combined system
winter for Orly airport. can also warn pilots of a convection triggering
area before it is detected by the onboard
12 sensor.
14
14 . Research Report 200910
5 12
0
Comparison, during a day’s cycle, of the departures between
forecast temperatures and in situ observations for two systems:
ARISP (using an experimental version of AROME, in yellow) and SIR (in blue).
The bottom point of each bar is the Q25 percentile, the point in the middle
-5
is the median and the upper point is the Q75 percentile.
Data were collected during winter 2007-2008.
1 3 5 7 9 11 13 15 17 19 21 23
13
Examples of cloud type retrieved from GOES-11
geostationary satellites over the Pacific Ocean
in support of the Megha-Tropique mission.
14
Superimposition of the airborne radar image (Raster),
thunderstorm hazard volumes from the ground weather
information system (Polygons), hazard boxes from the onboard data fusion process
(Red Boxes), and safe trajectory proposed by the onboard computer (Green Line)
Research Report 2009 . 15Studies of
meteorological process
From the small to the synoptic scale
The finality of understanding and modelling meso-scale processes and phenomena is to improve the numerical weather prediction and climate
prediction models at Météo-France. Meso-scale research covers deep convection, micro physics processes of cloudy and precipitating systems,
the study of convective and stable boundary layers including fog and ocean-atmosphere interface processes considering many different kind
of surfaces (natural, urban, lake, ocean), and also mainland hydrology.
At the end of 2008, the new meso-scale model AROME was implemented operationally over France as a result of the successful convergence
of the Meso-NH/AROME physics parametrizations and the fruitful assimilation of new data into the model (GPS, radar). The development and
the validation of a new shallow convection scheme (called EDKF), first in meso-NH and then in AROME, has enabled to correct some early short-
comings of organized wind structures in AROME. Upstream research has also taken place to pave the way for mid-term kilometric and sub-
kilometric scale numerical weather predictions. In this area, work has been initiated to merge PEARP Ensemble predictions with AROME
Ensemble assimilation on severe rainfall events in order to develop a methodology for an ensemble prediction with the AROME model at the
kilometric scale. These efforts are combined with other studies to define an Ensemble prediction of rapid floods using the ISBA-TOPMODEL
hydro-meteorological system. Weak and strong points of the sub-kilometric AROME and meso-NH models have been analyzed in order to pre-
pare the use of these models at such resolutions in an operational context as well as for research. At these scales, it is difficult to describe the
mechanisms behind the turbulence since we are faced with a “grey area”. Set against LES simulations, a preliminary study has shown the flaws
of the current parametrizations of the turbulence in meso-NH. The studies of fog, of sound propagation or to improve cloud parametrization are
resorting more and more frequently to these LES.
Field campaigns and the exploitation of the data collected are two other aspects of meso-scale research. Data analysis from the 2006 AMMA
field campaign has continued in 2009. The analyses of data from the COPS field campaigns (assimilation of GPS and radar data using AROME),
and of those from the Carboeurope campaign in the South West of France, using the simulation of the whole 2005 field campaign, showed
good behaviour for the simulation of CO2 fluxes and concentrations with the ISBA-A-Gs scheme. Throughout 2009, several research teams have
taken part in the SNORTEX measurement campaign on the remote sensing of snow covered forests, and in the CAROLS campaign on the esti-
mation of soil superficial moisture with a view to the launch of SMOS. Lastly, a sustained effort has been necessary to coordinate and plan the
HyMeX experiment programme on Mediterranean water cycle management (see figure). Preliminary studies are being undertaken to define the
implementation of the HyMeX programme, such as a version of AROME that can assimilate data of the western Mediterranean basin, and real
or idealized study cases of intense rainy events for the northwest Mediterranean basin.
1
1
The 5 major HyMeX research themes deal
with prediction improvements and preventive actions
against intense Mediterranean events (intense rain,
rapid flood, storms, drought), and assessment
of the local impact of climate changes,
especially on the Mediterranean thermohaline circulation.
16 . Research Report 2009Improvement of the cloud scheme
in the AROME model
Even at the horizontal resolution of AROME LES domain as a single grid box of the meso- fields. The hypothesis of a unimodal distribu-
(2.5 km), there are still subgrid clouds that an scale model (5 km). The reference distribu- tion used at large scale is no longer valid at
“all or nothing” method, assuming that a tion deduced from LES data appears mesoscale resolution.
model grid is either totally cloudy or comple- bounded, flexible and sometimes asymme- The future objective is to determine a bimo-
tely clear, fails to represent. Therefore, it tric and shows a second mode. For cumulus dal distribution, built as a linear combination
is necessary to consider a subgrid cloud clouds, this second mode corresponds to the of two Gaussian distributions. A method to
scheme which describes the cloud variability water feed from the surface associated with define their parameters from the model varia-
inside a model grid box, based on a statisti- the triggering of shallow convection whereas, bles will be designed in order to be able to
cal distribution which should be valid for all for stratocumulus clouds, it shows the implement such bimodal distribution in
cloud types. entrainment of dry air from the free tropo- the Méso-NH and AROME subgrid cloud
Large Eddy Simulations (LES), with a resolu- sphere drying out the cloud layer. The theore- schemes.
tion of the order of 100 m, were carried out tical unimodal distributions classically used
with the Méso-NH model to estimate these by atmospheric models do not consider this 2
subgrid fluctuations by considering the whole second mode and underestimate the cloud
2
Vertical profiles of the cloud fraction for the reference
distribution (LES) (black), the double Gaussian distribution (blue)
and different theoretical unimodal distributions
for a shallow cumulus case.
Only the double Gaussian distribution is able
to fit the reference distribution.
Research Report 2009 . 17A study of severe Climatology of fine mesh wind in the low layers
convective events for foreign locations
with the output In order to establish a fine mesh wind cli- re-analyses, parameters have been defined
of fine mesh matology, several suitably long series of to differentiate the various weather types
Météo-France models wind measurements are usually necessary.
Obviously, such series are not available
and classify them (class 4 for the Gulf of
Guinea, 7 for the Indian Ocean, 10 for the
world-wide (e.g. oceans, deserts, moun- Eastern Mediterranean). The statistical analy-
The aim of the Forecast Laboratory is to pre- tains). The research programme that SHOM sis of 23 years of re-analyses (1979/2001)
pare and validate possible new tools for ope- and Météo-France have jointly set up for made it possible to specify a hundred dates
rational forecasting purposes. In this context, 3 years aims to develop a method to esta- that represent the climates of these areas.
after the damage caused by the F4-tornado in blish high resolution wind climatology in The next step will be to carry out high resolu-
the region of Haumont in the North of France areas where wind measurements are rare. tion simulations for each zone of interest on
(on 3rd August 2008), it was decided to sup- The methodology follows the pattern of the these hundred dates, in order to rebuild the
plement the existing set of tools with the CNRM B95 action on metropolitan France but wind climatology of each area. To this end, it
U.S.A.’s severe convection indices. They are is now used for 3 areas that are very different is planned to have series of interlocked simu-
now computed on a daily basis and for in terms of climate: the Gulf of Guinea, the lations starting from the ERA 40 low resolu-
the whole Météo-France suite of models northern Indian Ocean and the Eastern tion re-analysis, followed by ALADIN model
(ARPEGE, ALADIN and AROME, reaching 15, Mediterranean basin. simulations (30 and 10 km resolution), and
10 and 2.5 km of horizontal resolution, res- Recent progress in modelling has provided ending with the 2.5 km resolution AROME
pectively). high resolution models that take climatic model.
The STP (Significant Tornado Parameter) is phenomena (such as convection, breeze) and
used in the U.S.A. to quantify the risk of relief into account in a more realistic way. 4
appearance of tornados. It is a complex for- However, due to computing limits, it is not yet
mula (see figure): a product of 4 non-dimen- possible to run these non-hydrostatic models
sional terms, with normalization factors over a long period of time to produce a refe-
leading to a threshold of 1 or so, with an rence climate. Consequently, a weather type
increasing probability of tornados. method has been used. From the ERA40
The STP values depicted in the figure were
computed from ALADIN and AROME outputs
and for the Haumont region at 20 and 21 UTC
(just before and after the tornado), corres-
ponding to 2h and 3h forecasts from the 18
UTC analysis. Clearly, the signal is stronger Evolution of a low-level cyclone into a storm
and better located for the higher resolution
model AROME than for ALADIN, with signifi- in the absence of an upper-level precursor
cant values up to 0.8 in (a) and greater than
1.2 in (b). Before reaching the French coasts, the two The initial low of the first storm was replaced
The encouraging results obtained for this European storms of Christmas 1999 were by an idealized one for which various charac-
Haumont case led us to compute the STP low-level cyclones with moderate amplitude teristics could be modified, such as its hori-
indices daily over France throughout the sum- travelling across the Atlantic. They quickly zontal shape or position. Two factors favour
mer of 2009 and for the three models running deepened during their interaction with the the strong deepening of the idealized low, as
at Météo-France. Results are not so encoura- upper-level large-scale jet. For the second shown by the figure: the case of weak stret-
ging as for the Haumont case, with numerous storm, this interaction was favoured by the ching and a position closer to the upper-level
false alarms and non-detections. Thus, this presence of an upper-level precursor, which jet (figure). It is quite surprising that a change
first attempt to use the STP indices will be fol- was not the case for the first one. If, in a as slight as 1.5 degrees in its position is
lowed by tests of additional products in 2010 numerical simulation, the upper level distur- enough to entirely modify the scenario.
(modifications of the non-dimensional terms, bance is removed from the second storm, this
new input data such as the turbulent kinetic storm simply disappears. This suggests that, 5
energy, etc.) in the absence of an upper-level precursor,
some dynamic properties of a low-level cy-
3 clone are crucial for its future evolution.
In order to identify these parameters, numeri-
cal sensitivity experiments were performed
using the French operational model ARPEGE.
18 . Research Report 20093
Map of the STP for 3rd August 2008 for the ALADIN
and AROME models. The black circle represents the region
of Haumont.
(a) 2 h forecast (just before the tornado);
(b) 3 h forecast (just after).
a
b
a - θ’W at 850 hPa for a class defined over the Gulf of Guinea.
b - Fields of the interlocked models
4 and fields for classification of weather types.
a b 5
Upper panels present two different initial
conditions where the initial low
of the first storm has been replaced
by an idealized one at 06 UTC 25 December
1999. The relative vorticity at 850 hPa
(blue contours; interval: 8 10-5 s-1),
c d and at 300 hPa (black contours, interval:
5 10-5 s-1), and the vertical velocity
at 600 hPa (red contours, interval: 0.4 Pa.s-1)
are represented for
(a) a weakly stretched anomaly and
(b) a strongly stretched anomaly centred
at 36W, 45N
(c) evolution of the relative vorticity maxi-
mum at 850 hPa for an anomaly centred at
46.5N (blue), 45N (red), and 43.5N (green)
(d) same as (c) but for a strongly stretched
anomaly. The black curve corresponds
to the forecast of the real storm starting
on the same date.
Research Report 2009 . 19Fog studies
Fog modelling Fog monitoring Spatialization
Accurate modelling of the life cycle of a fog at Roissy airport of low visibilities
layer is always a great challenge. However,
fog can have important societal impact
with an acoustic to improve mist
(e.g. transportation or pollution), and it is remote sensor and fog detection
necessary to improve the knowledge on the
physical mechanism driving a fog layer. In the framework of a national programme in CARIBOU
Currently, our research focuses on the deter- aiming to improve fog forecasting at airports,
mination of the initial conditions, on the an experiment has been carried out to test The CARIBOU analysis has been providing
impact of aerosols, and on the very fine scale the potential of an acoustic remote sensor – spatialized information about mist and fog
circulation inside a fog layer. the sodar – to provide operational observa- risks for metropolitan France since June
As for other meteorological forecasting sys- tions of the phenomenon. The theory leads 2007. CARIBOU detects the phenomenon but
tems, improving the quality of the forecast is us to think that a sodar, which detects turbu- does not forecast it. Moreover, analyses do
very dependent on the initial conditions. An lent temperature heterogeneities, should be not give visibility values and they are not sys-
ensemble Kalman filter and a particle filter able to detect the top of fog layers in real tematically available throughout the domain.
assimilation scheme have been developed in time. A new method has been developed to correct
the Cobel-Isba numerical forecasting system. However, as no thorough testing has been these drawbacks. It is based on the spatiali-
Cobel-Isba is a local numerical fog prediction carried out yet, it was decided to undertake zation of visibility values observed in situ by
system used operationally at three airports in some experiments to check this capacity. A means of a multiple linear regression invol-
France : Paris-CdG, Paris-Orly and Lyon. These sodar was purchased in early 2008 and ving meteorological and geographical predic-
two new assimilation methods have impro- deployed at Roissy airport in June 2008. After tors. This interpolation of residuals improves
ved the quality of fog forecasting at local a few weeks of operations, it became clear results as it gives a better correspondence
scale. that the sodar was able to work properly des- with observations of visibility and therefore
Some research is also in progress on the pite significant ambient noise. an indication of the expected visibility over
microphysical parameterization, in order to The experiment took place during the winter the whole domain.
take the specificity of the fog granulometric of 2008-2009. During four months, a team Then, merging those spatialized visibilities
spectra into account. This work is carried out from CNRM operated a tethered balloon with the current CARIBOU analysis allows us
with data coming from the Paris-Fog and system at Roissy each time fog was either to take into account the quantitative informa-
Toulouse-Fog field experiments. The results forecast or observed. The tethered balloon tion about visibility reductions and the quali-
show a non-trivial dependence between the measured the vertical profile of temperature tative information about the risk of mist or fog
number of aerosol particles and fog. In a very and humidity once every hour in the first few occurrence. Thus, it becomes possible, for
polluted atmosphere, it is very difficult to hundred metres of the atmosphere. About 10 example, to produce maps which match the
form dense fog. Haze, however, is very fre- fog events were thus observed. probability of observing visibility values lower
quent. The results clearly confirm the ability of the than a given threshold (200, 600, 1000 or
Strong horizontal and vertical gradients exist sodar to detect and precisely locate the top of 5000 m).
inside fog layers. Fine resolution is neces- the fog layer in real time, which appears as a Results are encouraging so far. However, new
sary to accurately represent the interactions peak in the signal strength (reflectivity). They developments have yet to be validated before
among the physical processes but, unfortu- show that the sodar provides some additio- this new version of CARIBOU can be imple-
nately, such a resolution is not yet possible nal information to correct the fog height ana- mented operationally. The foremost goal is to
for operational forecasts. Nevertheless, simu- lysis made by the fog forecasting system satisfy the request of the SYMPOSIUM-2 pro-
lations carried out with Meso-Nh at a horizon- (COBEL). It now remains to assess the impact ject (by supplying probability distributions of
tal resolution of 5 m and a vertical resolution of that information on forecasting skills. visibility values) and also to take better
of 1 m, allow the heterogeneities inside a fog account of the characteristics of the visibility
layer to be studied at small scale. 7 observations used.
This research will lead to the development of
new physical parameterizations and, conse- 8
quently, to improved fog forecasting.
6
20 . Research Report 20096
Horizontal cross section in a fog layer.
The liquid cloud water inside the fog layer comes
from a numerical simulation at very fine scale
(5 m in the horizontal and 1 m in the vertical).
The linear structures inside the fog layer can be seen clearly.
Colour coded plot of the sodar signal strength (the reflectivity)
versus time (x-axis) and height above the ground (y-axis).
The colour code is shown on the right. The white squares indicate
the fog layer top as revealed by the tethered balloon.
The black triangles show the maximum height reached
by the balloon. The vertical bars indicate the beginning
and the end of the fog event. The good correlation between
the white squares and the line of high acoustic reflectivity
in altitude demonstrates the operational ability
of the sodar to monitor the top of the fog layer.
7
8
Probability of observing
visibility values less than
1000 m – 09/17/2009 05 UTC (in %).
Research Report 2009 . 21Work around
the AMMA programme
Launched in Niamey in February 2002, AMMA is an international programme to improve our knowledge of the West African Monsoon (WAM)
and its variability, with emphasis on daily-to-interannual timescales including climate change but also its impacts on natural and cultivated
resources, and diseases. AMMA is also working to improve observation networks, weather and climate predictions and their applications (early
warning systems for resources and diseases). AMMA has a keen interest in fundamental scientific issues and societal needs.
During the 3rd AMMA Conference which took place in Ougadougou in July 2009, the main achievements were presented to 500 researchers of
all disciplines. Key features of the monsoon are now better understood, such as the Saharan heat low, interactions between surface and atmos-
phere, cold tongue mechanisms and their role in the monsoon onset. Prediction models, together with remote sensing data, estimate water
budgets and sources over the region better. In collaboration with major numerical weather prediction centres, short term forecasts have been
improved thanks to the assimilation of bias corrected radiosoundings and microwave radiances on the continent. The study of IPCC climatic
scenarios shows that it is over the AMMA region that models differ most. The poor representation of remote connections between tropical
regions raises many issues not only for this part of Africa but also for surrounding areas. Achievements have also been made on the links bet-
ween climate and diseases (meningitis, malaria, rift valley fever), water resources, and farming production, with the first maps of advice for
sowing, and also on the atmospheric pollution in major African towns.
Moreover, the AMMA phase II plan was also discussed during debates and meetings at Ouagadoudou. The programme will further develop its
research on interactions between society, environment and climate and on the improvement of prediction systems and their applications.
1
Assimilation of surface sensitive microwave Convective development
observations in the framework of AMMA within daytime drying
boundary layers
Observations from the AMSU-A & AMSU-B Assimilating these observations had major
instruments provide relevant information consequences on key parameters of the Prior to the monsoon onset, daytime
about the vertical structure of temperature water cycle. An important change was noted Sahelian convective boundary layers show
and humidity. The assimilation of these in the analysed atmospheric fields and in the generic features, which were particularly well
observations is still far from optimal in the precipitation forecasts over the Tropics. Our captured by a suite of instruments on July
models. Observations containing a consi- experiment emphasized that the atmosphere 10th 2006. They include:
derable amount information on incoming was becoming more humid in India, South – significant growth of the mixed layer. On
signals from the surface are usually rejected America and in West Africa while it was drying July 10th, its top matched the variations of
from the assimilation because of an inappro- over Arabia and North-East Africa. The humi- the lifting condensation level until mid-after-
priate description of the land emissivity. In dity change not only concerns the surface but noon (cyan curve in central upper panel),
July 2008, the use of AMSU-A and -B at also many levels of the atmosphere, up to consistently with cloud base heights estima-
Météo-France made substantial progress 500 hPa. The humidity change was success- ted with the colocated ceilometer (red dots),
with the operational implementation of a new fully evaluated using independent GPS data. – well defined boundary layer organizations,
land emissivity parametrization. Since this The changes resulted in a better-organized evolving from morning rolls (MIT radar reflec-
change, strategies have been explored to African monsoon with a stronger ITCZ. tivity, upper left panel) to afternoon cells and
assimilate surface sensitive observations for Forecast errors were significantly reduced then, in some places, to deeper isolated
the first time ever. Studies were undertaken over the Tropics, leading to significant fore- convective elements. This was the case on
to assimilate observations sensitive to the cast improvements at higher latitudes in the July 10th (upper middle panel, time series of
atmospheric boundary layer over land. In 48h to 72h range. vertically pointing cloud radar reflectivities):
addition to a control experiment, a two- a deep convective cell developed within the
month experiment was run during the sum- 2 field of view of the MIT radar and generated
mer 2006. Unlike the first one, the second an almost circular convective outflow (upper
experiment assimilated low level tempera- right panel) spreading through the lowest
ture and humidity observations from AMSU levels where the wind speed was fairly low.
over land. However, sounding data did not show an
increase in CAPE or a decrease in the level of
free convection in the daytime-drying boun-
dary layer (lower panel).
The features that were observed differed from
the usual view that daytime convection over
land should be related to a daytime CAPE
increase. Further studies need to be underta-
ken since this situation seems difficult to
model and its parametrization has been lar-
gely overlooked during recent years.
3
22 . Research Report 2009You can also read